Comprehensive Solutions: Hypothesis Testing and T-Tests in Stats

Verified

Added on  2022/08/14

|5
|1108
|15
Homework Assignment
AI Summary
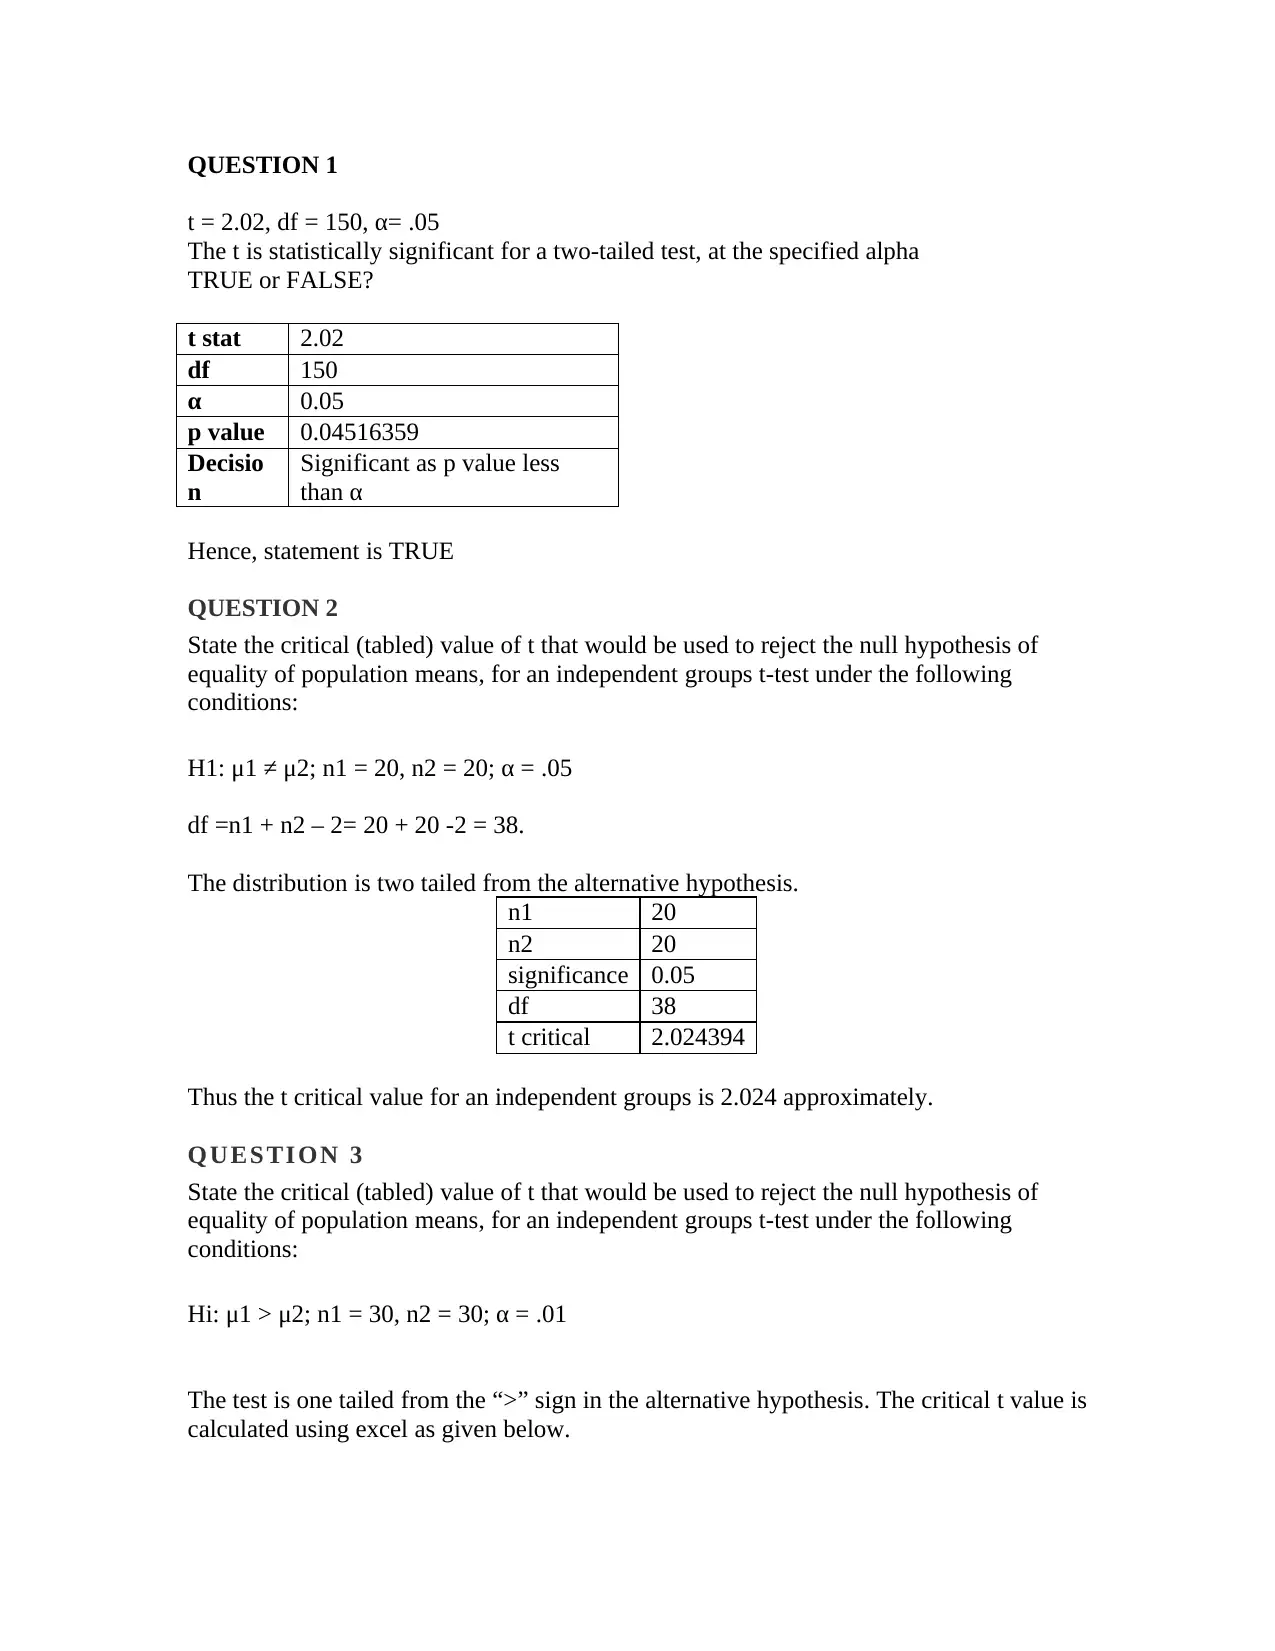
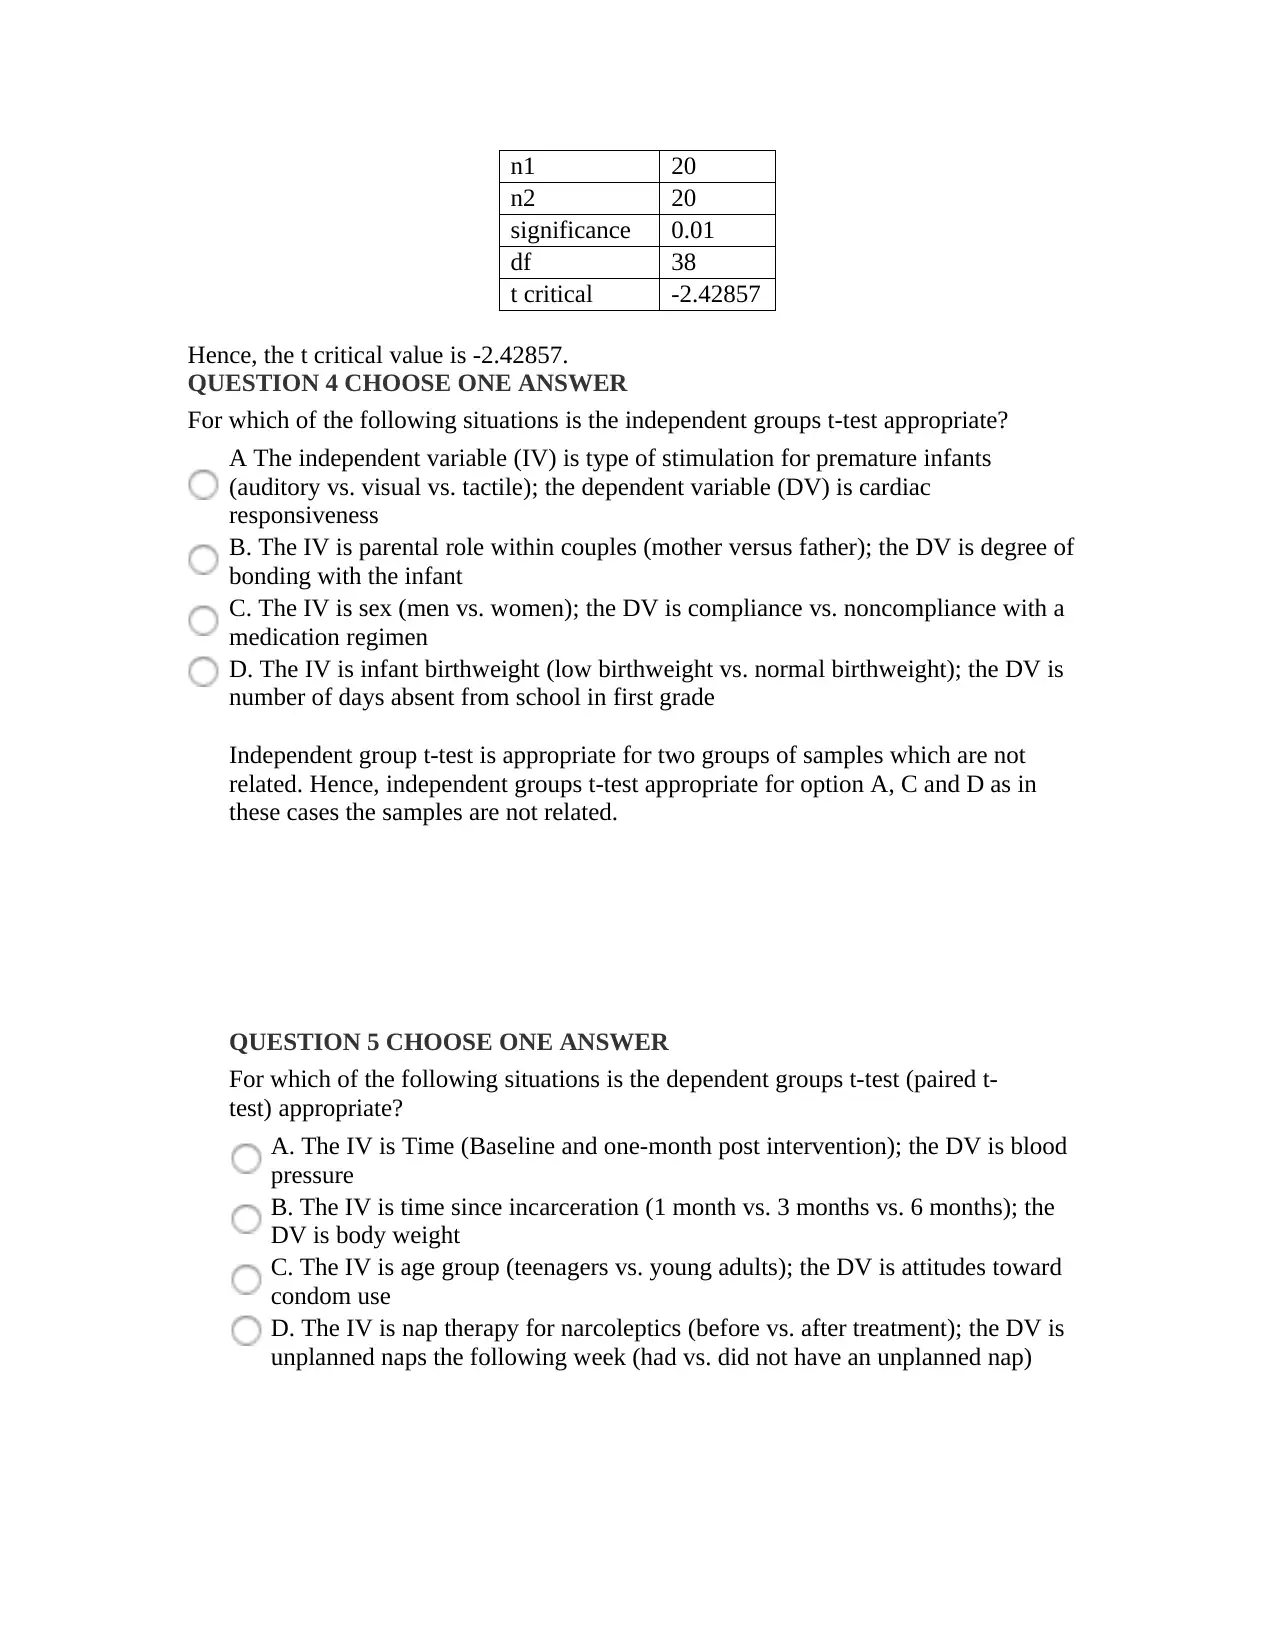
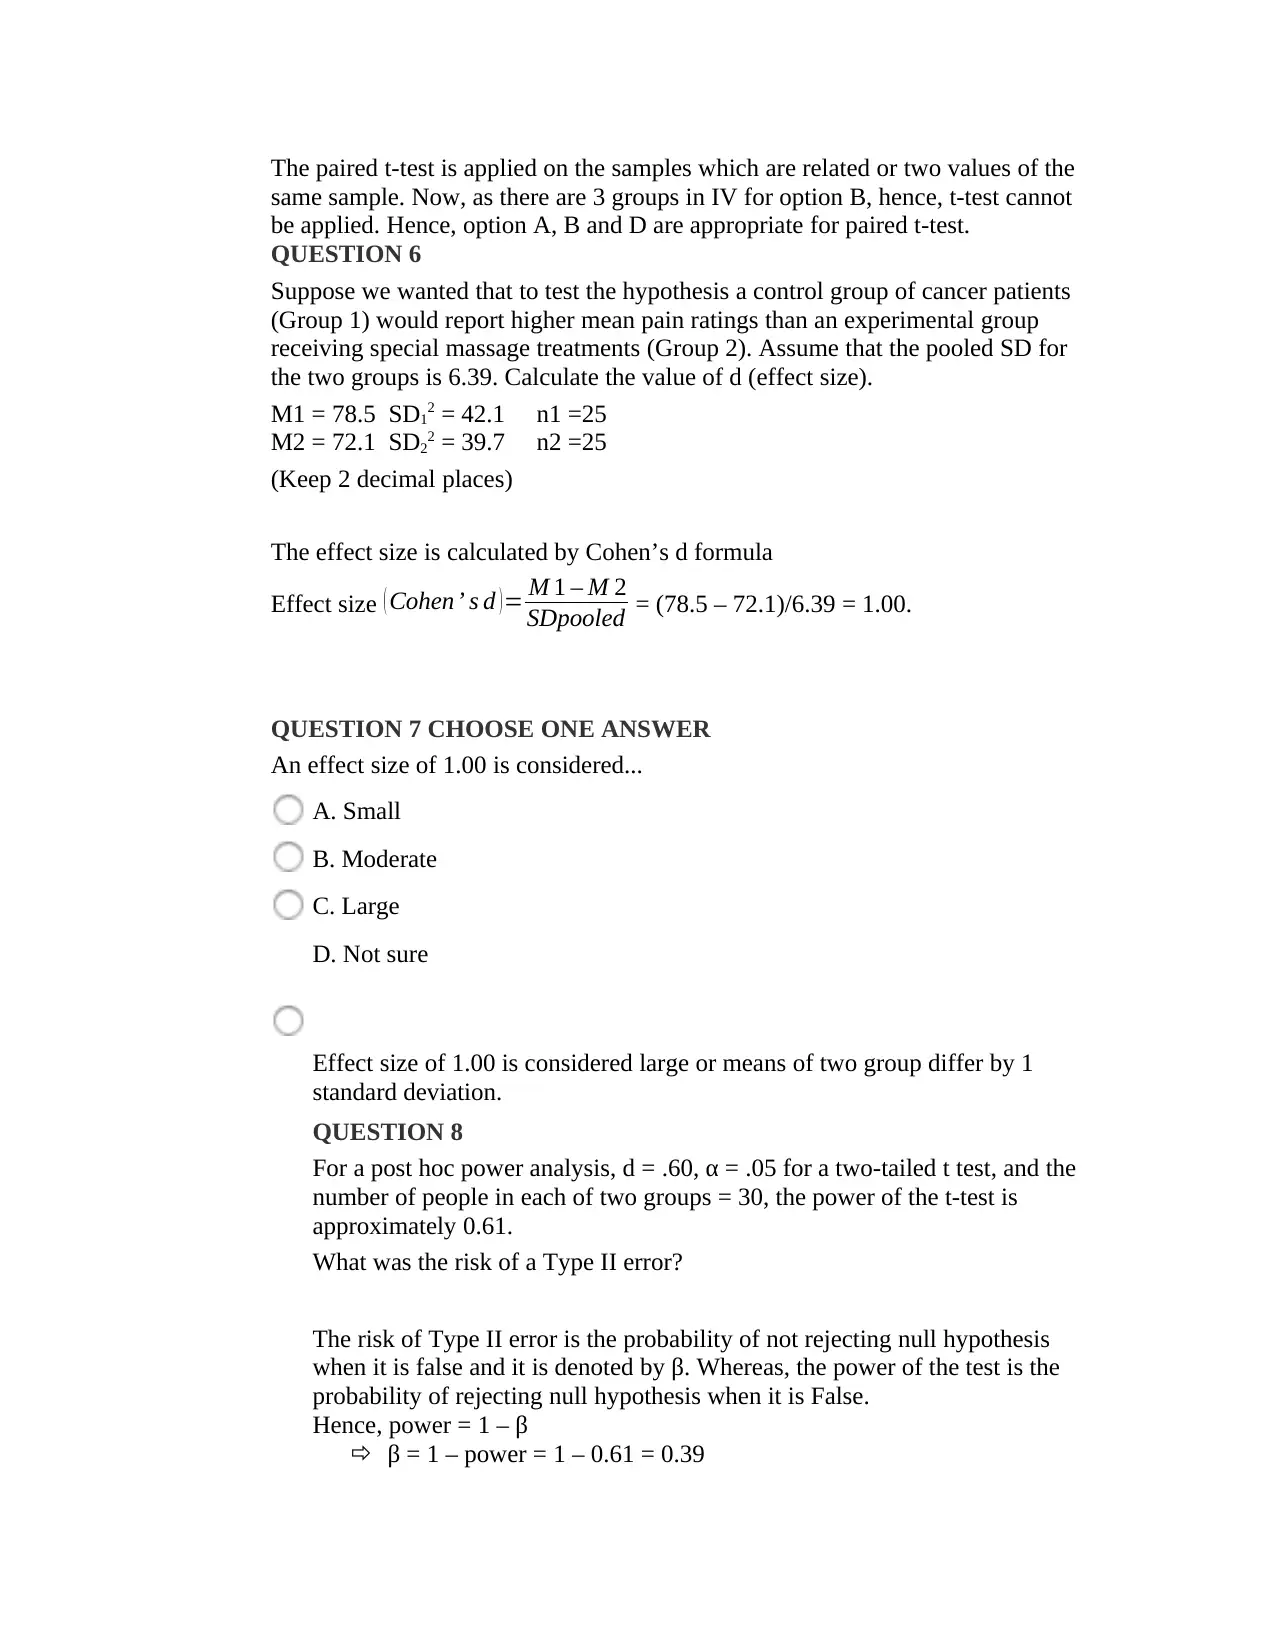
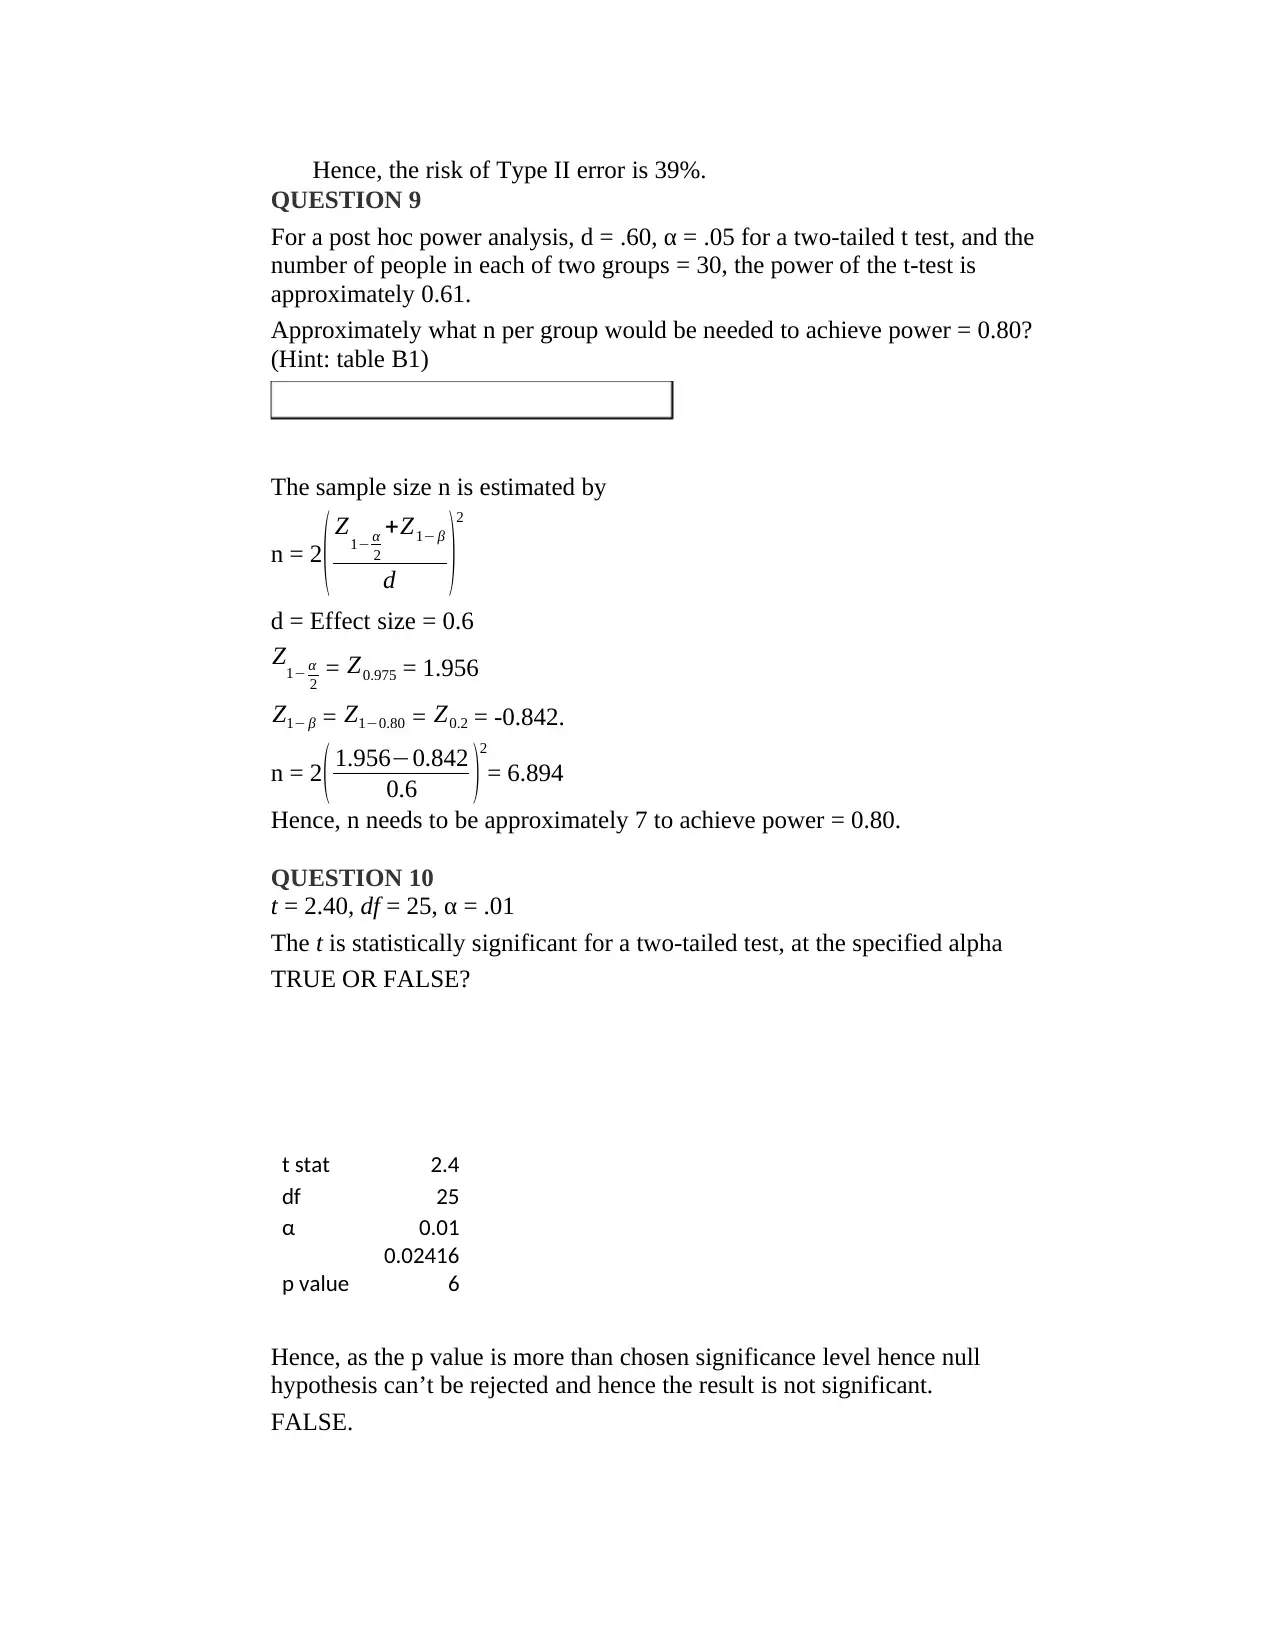
This assignment provides solutions to questions related to hypothesis testing and t-tests in statistics. It covers topics such as determining statistical significance using t-values, degrees of freedom, and alpha levels. The assignment includes calculating critical t-values for independent groups t-tests under various conditions, differentiating between when independent and dependent groups t-tests are appropriate, computing effect size using Cohen’s d formula, analyzing Type II error risk, and estimating sample sizes needed to achieve desired statistical power. Specific questions address the interpretation of t-test results, the meaning of effect sizes, and the practical implications of power analysis in statistical hypothesis testing. The document offers a comprehensive review of key concepts and calculations essential for understanding and applying t-tests in statistical research.
tabler-icon-diamond-filled.svg

Contribute Materials

Your contribution can guide someone’s learning journey. Share your documents today.
Document Page
QUESTION 1
t = 2.02, df = 150, α= .05
The t is statistically significant for a two-tailed test, at the specified alpha
TRUE or FALSE?
t stat 2.02
df 150
α 0.05
p value 0.04516359
Decisio
n
Significant as p value less
than α
Hence, statement is TRUE
QUESTION 2
State the critical (tabled) value of t that would be used to reject the null hypothesis of
equality of population means, for an independent groups t-test under the following
conditions:
H1: μ1 ≠ μ2; n1 = 20, n2 = 20; α = .05
df =n1 + n2 – 2= 20 + 20 -2 = 38.
The distribution is two tailed from the alternative hypothesis.
n1 20
n2 20
significance 0.05
df 38
t critical 2.024394
Thus the t critical value for an independent groups is 2.024 approximately.
Q U E S TI O N 3
State the critical (tabled) value of t that would be used to reject the null hypothesis of
equality of population means, for an independent groups t-test under the following
conditions:
Hi: μ1 > μ2; n1 = 30, n2 = 30; α = .01
The test is one tailed from the “>” sign in the alternative hypothesis. The critical t value is
calculated using excel as given below.
tabler-icon-diamond-filled.svg

Secure Best Marks with AI Grader

Need help grading? Try our AI Grader for instant feedback on your assignments.
Document Page
n1 20
n2 20
significance 0.01
df 38
t critical -2.42857
Hence, the t critical value is -2.42857.
QUESTION 4 CHOOSE ONE ANSWER
For which of the following situations is the independent groups t-test appropriate?
A The independent variable (IV) is type of stimulation for premature infants
(auditory vs. visual vs. tactile); the dependent variable (DV) is cardiac
responsiveness
B. The IV is parental role within couples (mother versus father); the DV is degree of
bonding with the infant
C. The IV is sex (men vs. women); the DV is compliance vs. noncompliance with a
medication regimen
D. The IV is infant birthweight (low birthweight vs. normal birthweight); the DV is
number of days absent from school in first grade
Independent group t-test is appropriate for two groups of samples which are not
related. Hence, independent groups t-test appropriate for option A, C and D as in
these cases the samples are not related.
QUESTION 5 CHOOSE ONE ANSWER
For which of the following situations is the dependent groups t-test (paired t-
test) appropriate?
A. The IV is Time (Baseline and one-month post intervention); the DV is blood
pressure
B. The IV is time since incarceration (1 month vs. 3 months vs. 6 months); the
DV is body weight
C. The IV is age group (teenagers vs. young adults); the DV is attitudes toward
condom use
D. The IV is nap therapy for narcoleptics (before vs. after treatment); the DV is
unplanned naps the following week (had vs. did not have an unplanned nap)
Document Page
The paired t-test is applied on the samples which are related or two values of the
same sample. Now, as there are 3 groups in IV for option B, hence, t-test cannot
be applied. Hence, option A, B and D are appropriate for paired t-test.
QUESTION 6
Suppose we wanted that to test the hypothesis a control group of cancer patients
(Group 1) would report higher mean pain ratings than an experimental group
receiving special massage treatments (Group 2). Assume that the pooled SD for
the two groups is 6.39. Calculate the value of d (effect size).
M1 = 78.5 SD12 = 42.1 n1 =25
M2 = 72.1 SD22 = 39.7 n2 =25
(Keep 2 decimal places)
The effect size is calculated by Cohen’s d formula
Effect size ( Cohen s d )= M 1 M 2
SDpooled = (78.5 – 72.1)/6.39 = 1.00.
QUESTION 7 CHOOSE ONE ANSWER
An effect size of 1.00 is considered...
A. Small
B. Moderate
C. Large
D. Not sure
Effect size of 1.00 is considered large or means of two group differ by 1
standard deviation.
QUESTION 8
For a post hoc power analysis, d = .60, α = .05 for a two-tailed t test, and the
number of people in each of two groups = 30, the power of the t-test is
approximately 0.61.
What was the risk of a Type II error?
The risk of Type II error is the probability of not rejecting null hypothesis
when it is false and it is denoted by β. Whereas, the power of the test is the
probability of rejecting null hypothesis when it is False.
Hence, power = 1 – β
β = 1 – power = 1 – 0.61 = 0.39
Document Page
Hence, the risk of Type II error is 39%.
QUESTION 9
For a post hoc power analysis, d = .60, α = .05 for a two-tailed t test, and the
number of people in each of two groups = 30, the power of the t-test is
approximately 0.61.
Approximately what n per group would be needed to achieve power = 0.80?
(Hint: table B1)
The sample size n is estimated by
n = 2
( Z1 α
2
+Z1 β
d )
2
d = Effect size = 0.6
Z1 α
2 = Z0.975 = 1.956
Z1 β = Z10.80 = Z0.2 = -0.842.
n = 2( 1.9560.842
0.6 )
2
= 6.894
Hence, n needs to be approximately 7 to achieve power = 0.80.
QUESTION 10
t = 2.40, df = 25, α = .01
The t is statistically significant for a two-tailed test, at the specified alpha
TRUE OR FALSE?
t stat 2.4
df 25
α 0.01
p value
0.02416
6
Hence, as the p value is more than chosen significance level hence null
hypothesis can’t be rejected and hence the result is not significant.
FALSE.
tabler-icon-diamond-filled.svg

Secure Best Marks with AI Grader

Need help grading? Try our AI Grader for instant feedback on your assignments.
Document Page
QUESTION 11
t = 2.40, df = 25, α = .05
The t is statistically significant for a two-tailed test, at the specified alpha
TRUE OR FALSE?
t stat 2.4
df 25
α 0.05
p value 0.024166
Hence, as the p value is less than the chosen significance level, hence, there is enough
evidence to reject the null hypothesis or the result is significant.
chevron_up_icon
1 out of 5
circle_padding
hide_on_mobile
zoom_out_icon
logo.png

Your All-in-One AI-Powered Toolkit for Academic Success.

Available 24*7 on WhatsApp / Email

[object Object]