Statistics Assignment: Analyzing Statistical Significance and Tests

Verified

Added on  2022/09/07

|8
|740
|68
Homework Assignment
AI Summary
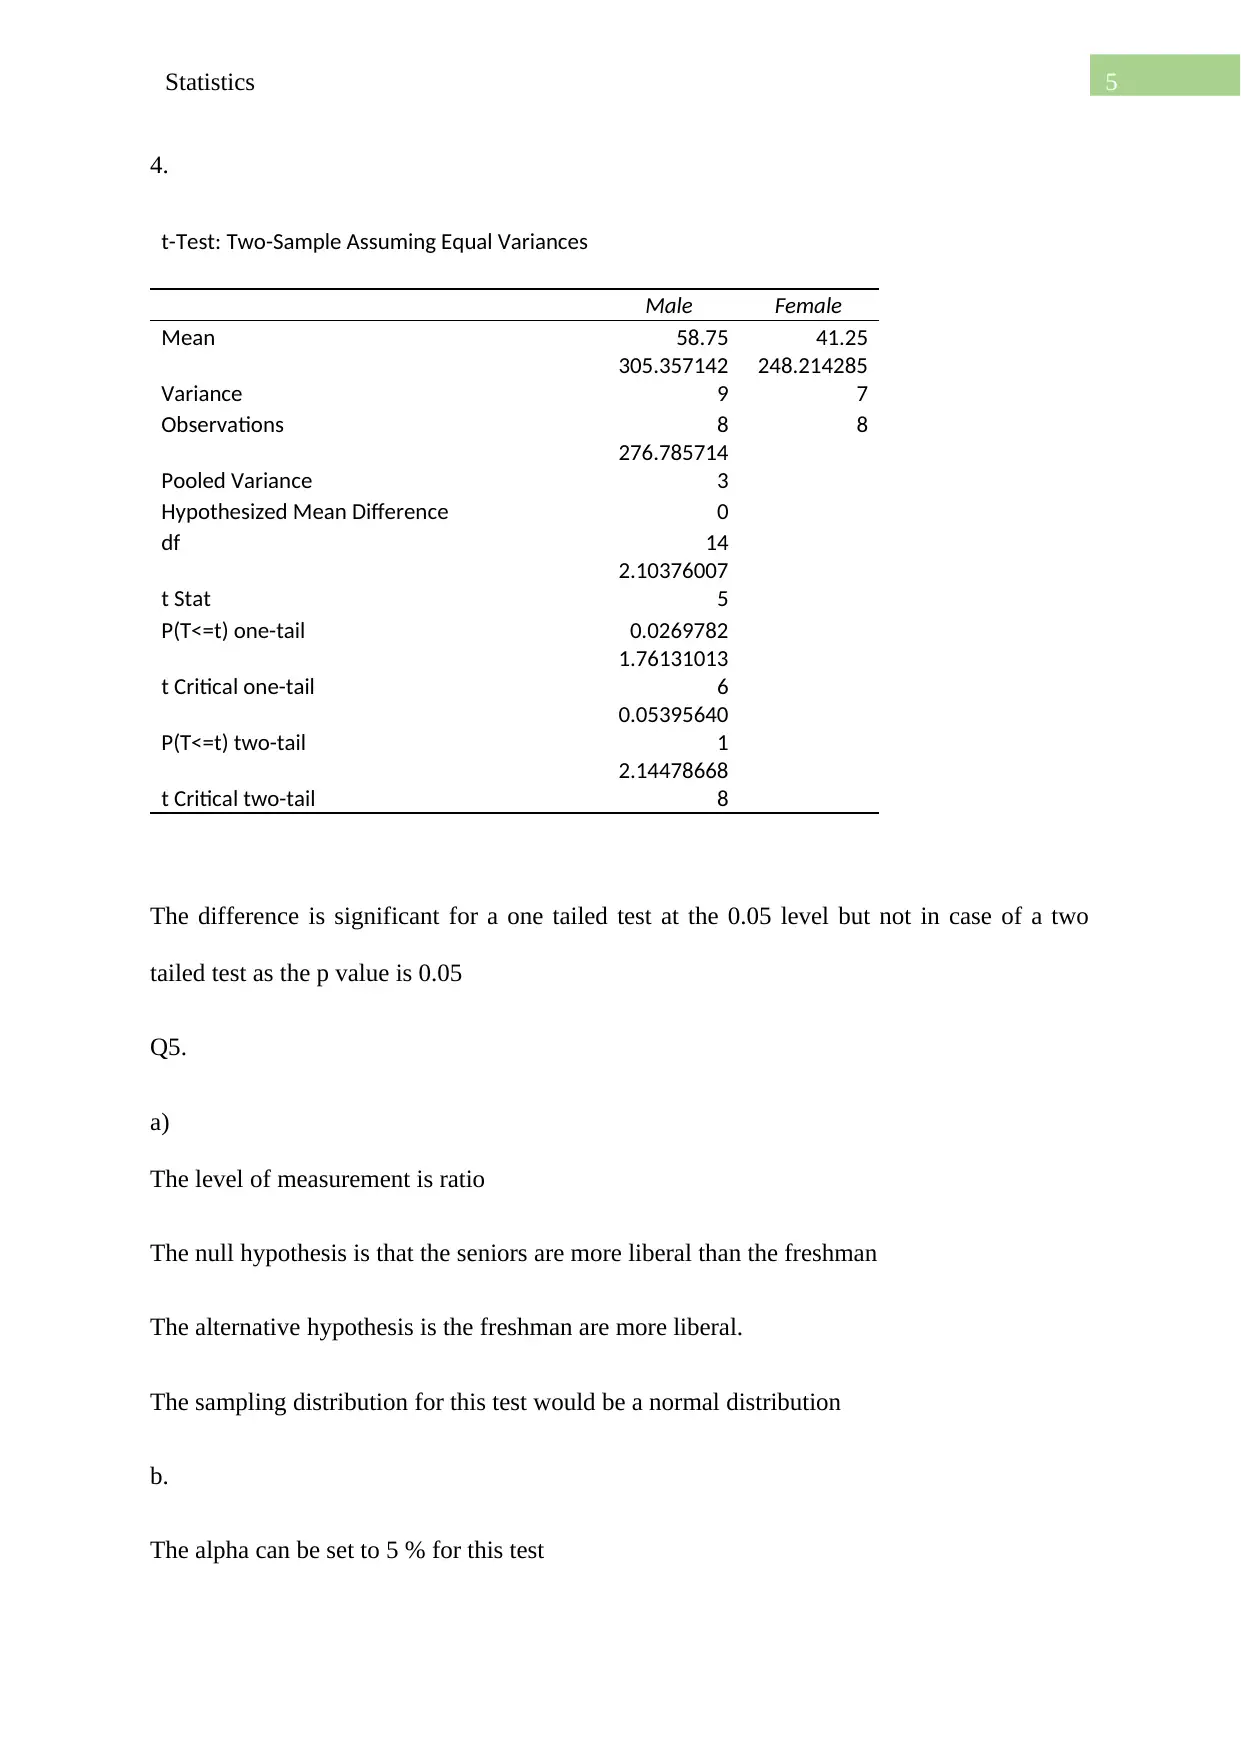
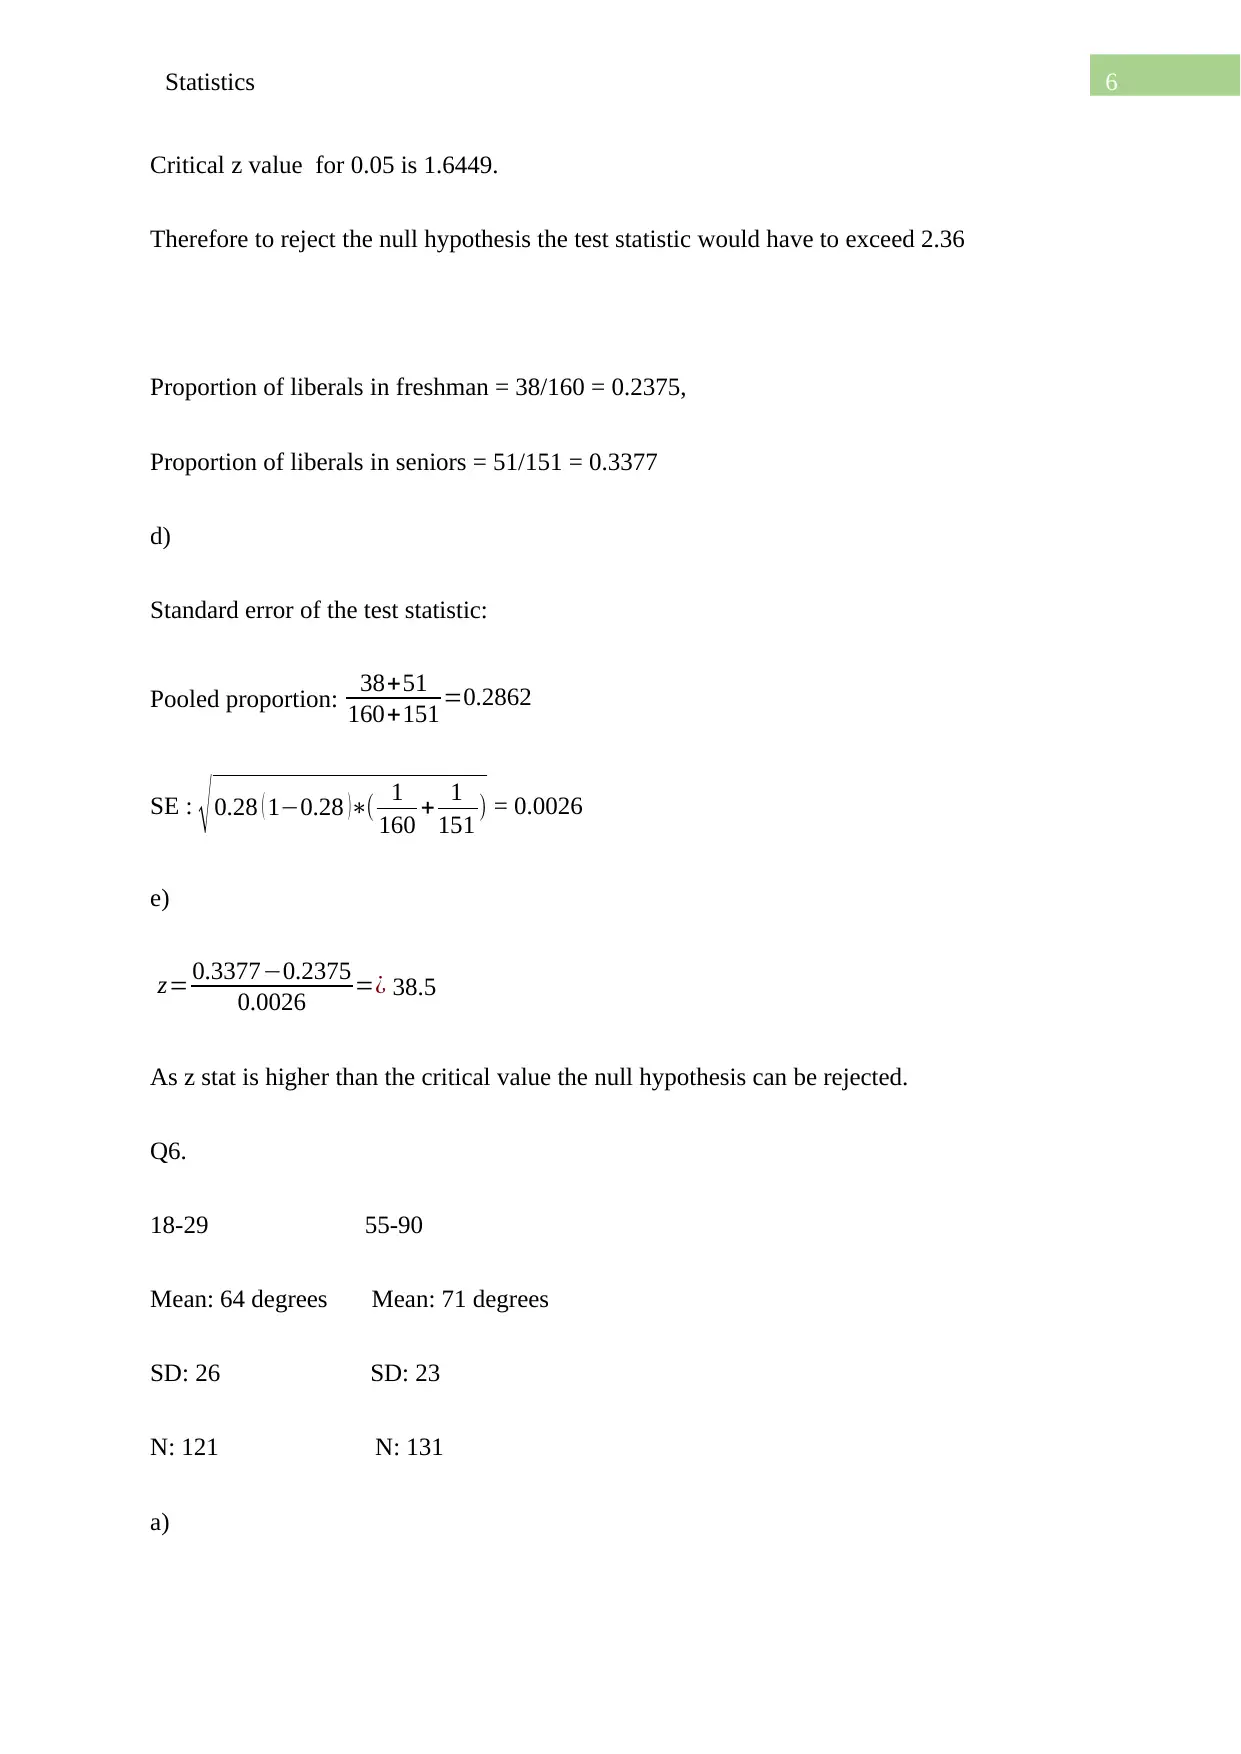
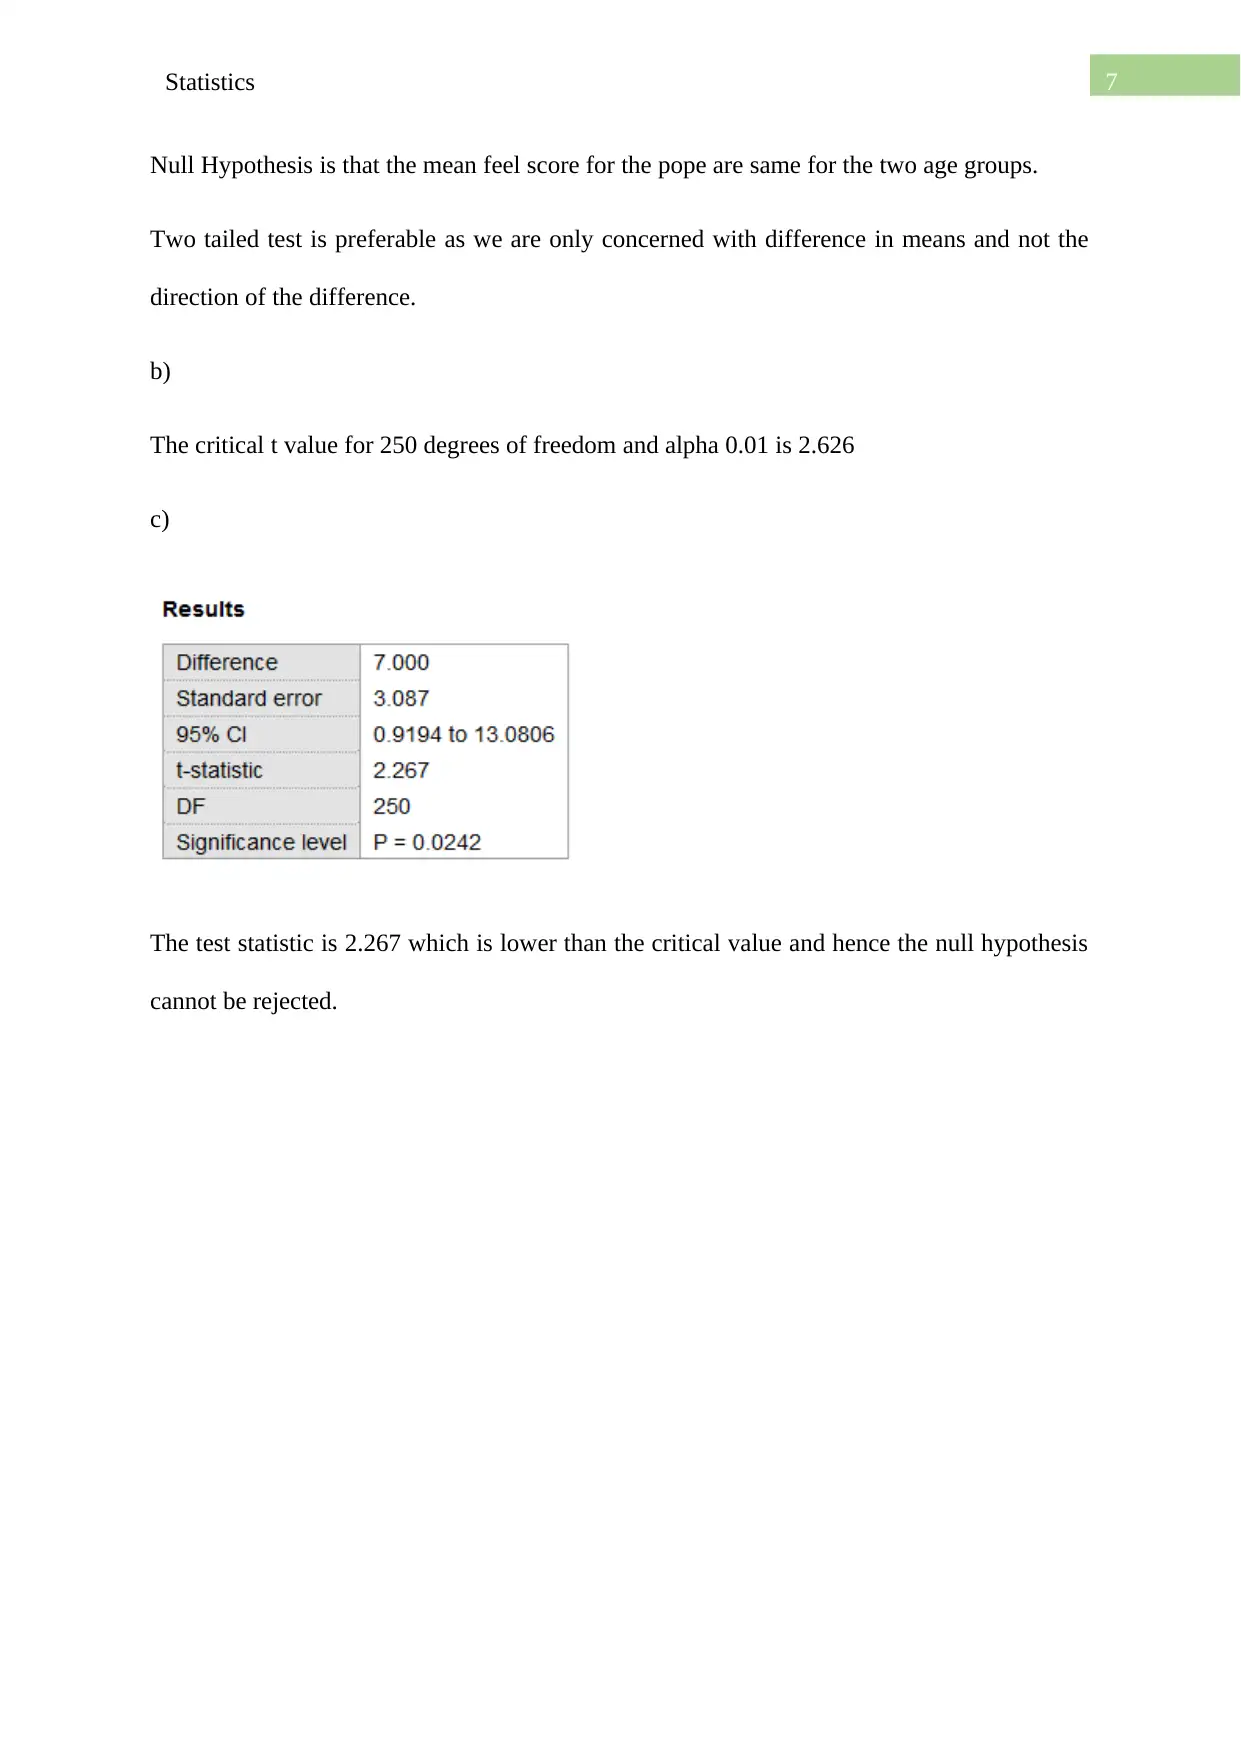
This statistics assignment addresses key concepts including the distinction between substantive and statistical significance, providing examples to illustrate the differences. The solution analyzes several scenarios involving t-tests, determining whether observed values exceed critical values to reject null hypotheses, considering degrees of freedom, and one-tailed versus two-tailed tests. Descriptive statistics, including mean, standard deviation, and standard error, are calculated for a given dataset, along with confidence intervals. The assignment further explores a two-sample t-test, comparing male and female ratings, defining hypotheses, and interpreting the results. Finally, the solution analyzes a z-test comparing liberal attitudes of freshman and senior students, detailing the null and alternative hypotheses, calculating the test statistic, and making a decision based on the critical value. The assignment covers various statistical tests and their applications.
Document Page
Running head: Statistics
Statistics
Name of the Student
Name of the University
tabler-icon-diamond-filled.svg

Paraphrase This Document

Need a fresh take? Get an instant paraphrase of this document with our AI Paraphraser
Document Page
2Statistics
1.
Substantive Significance is concerned about the size of a relationship or an effect. It asks how
much difference exists whereas statistical significance is interested in the how sure are we of
it. Statistical Significance is concerned about precision of the relationship based on some
sample.
2.
1. tobs = 2.1, 15 degrees of freedom, two-tailed test, p. < .05
T crit : 2.13
2. tobs = 1.9, 24 degrees of freedom, two tailed test, p. < .10
T crit: 1.71
3. tobs = 1.5, 30 degrees of freedom, one tail test, p. < .05
T crit:2.04
4. tobs = 1.9, 7 degeee of freedom, one tail test, p. < .01
T crit : 3.50
5. tobs = 4.0, 21 degrees of freedom, two tail test, p. < .001
T crit: 3.82
Document Page
3Statistics
Q2.
3.9
4.6
15.6
10.5
16
6.7
12
9.2
3.8
8.5
The mean, std. dev., standard error and other descriptive are calculated below
Column1
Mean 9.08
Standard Error 1.42101685
Median 8.85
Mode #N/A
Standard Deviation 4.49364984
Sample Variance 20.19288889
Kurtosis
-
1.069266913
Skewness 0.377333988
Range 12.2
Minimum 3.8
Maximum 16
Sum 90.8
Count 10
Confidence
Level(95.0%) 3.214563446
Confidence
Level(99.0%) 4.618071065
Mean: 9.08
Std Dev. : 4.49
Document Page
4Statistics
Std. Error: 1.42
95 % CI for mean : 9.08 ± 3.21=( 5.87 ,12.29)
99 % CI for mean: 9.08 ± 4.61=( 4.62, 13.69)
Q4.
1. Level of measurement for this test is ratio
The null hypothesis is that the mean difference between male rating and female rating
is not different.between male rating and female rating is not different.
The alternate hypothesis is that there exists a difference between rating for males and
females.
A two tailed test is appropriate for the test.
2.
The mean difference in rating the Pope between men and women is 17.5
3.
Std . Dev for the data is 17.85 including males and females
tabler-icon-diamond-filled.svg

Paraphrase This Document

Need a fresh take? Get an instant paraphrase of this document with our AI Paraphraser
Document Page
5Statistics
4.
t-Test: Two-Sample Assuming Equal Variances
Male Female
Mean 58.75 41.25
Variance
305.357142
9
248.214285
7
Observations 8 8
Pooled Variance
276.785714
3
Hypothesized Mean Difference 0
df 14
t Stat
2.10376007
5
P(T<=t) one-tail 0.0269782
t Critical one-tail
1.76131013
6
P(T<=t) two-tail
0.05395640
1
t Critical two-tail
2.14478668
8
The difference is significant for a one tailed test at the 0.05 level but not in case of a two
tailed test as the p value is 0.05
Q5.
a)
The level of measurement is ratio
The null hypothesis is that the seniors are more liberal than the freshman
The alternative hypothesis is the freshman are more liberal.
The sampling distribution for this test would be a normal distribution
b.
The alpha can be set to 5 % for this test
Document Page
6Statistics
Critical z value for 0.05 is 1.6449.
Therefore to reject the null hypothesis the test statistic would have to exceed 2.36
Proportion of liberals in freshman = 38/160 = 0.2375,
Proportion of liberals in seniors = 51/151 = 0.3377
d)
Standard error of the test statistic:
Pooled proportion: 38+51
160+151 =0.2862
SE : 0.28 ( 10.28 )( 1
160 + 1
151 ) = 0.0026
e)
z= 0.33770.2375
0.0026 =¿ 38.5
As z stat is higher than the critical value the null hypothesis can be rejected.
Q6.
18-29 55-90
Mean: 64 degrees Mean: 71 degrees
SD: 26 SD: 23
N: 121 N: 131
a)
Document Page
7Statistics
Null Hypothesis is that the mean feel score for the pope are same for the two age groups.
Two tailed test is preferable as we are only concerned with difference in means and not the
direction of the difference.
b)
The critical t value for 250 degrees of freedom and alpha 0.01 is 2.626
c)
The test statistic is 2.267 which is lower than the critical value and hence the null hypothesis
cannot be rejected.
tabler-icon-diamond-filled.svg

Paraphrase This Document

Need a fresh take? Get an instant paraphrase of this document with our AI Paraphraser
Document Page
8Statistics
References:
Berenson, M., Levine, D., Szabat, K.A. and Krehbiel, T.C., 2012. Basic business statistics:
Concepts and applications. Pearson higher education AU.
Groebner, D.F., Shannon, P.W., Fry, P.C. and Smith, K.D., 2013. Business statistics. Pearson
Education UK.
chevron_up_icon
1 out of 8
circle_padding
hide_on_mobile
zoom_out_icon
[object Object]