Statistics 6: Hypothesis Testing and Statistical Analysis
VerifiedAdded on 2022/08/29
|7
|983
|42
Homework Assignment
AI Summary
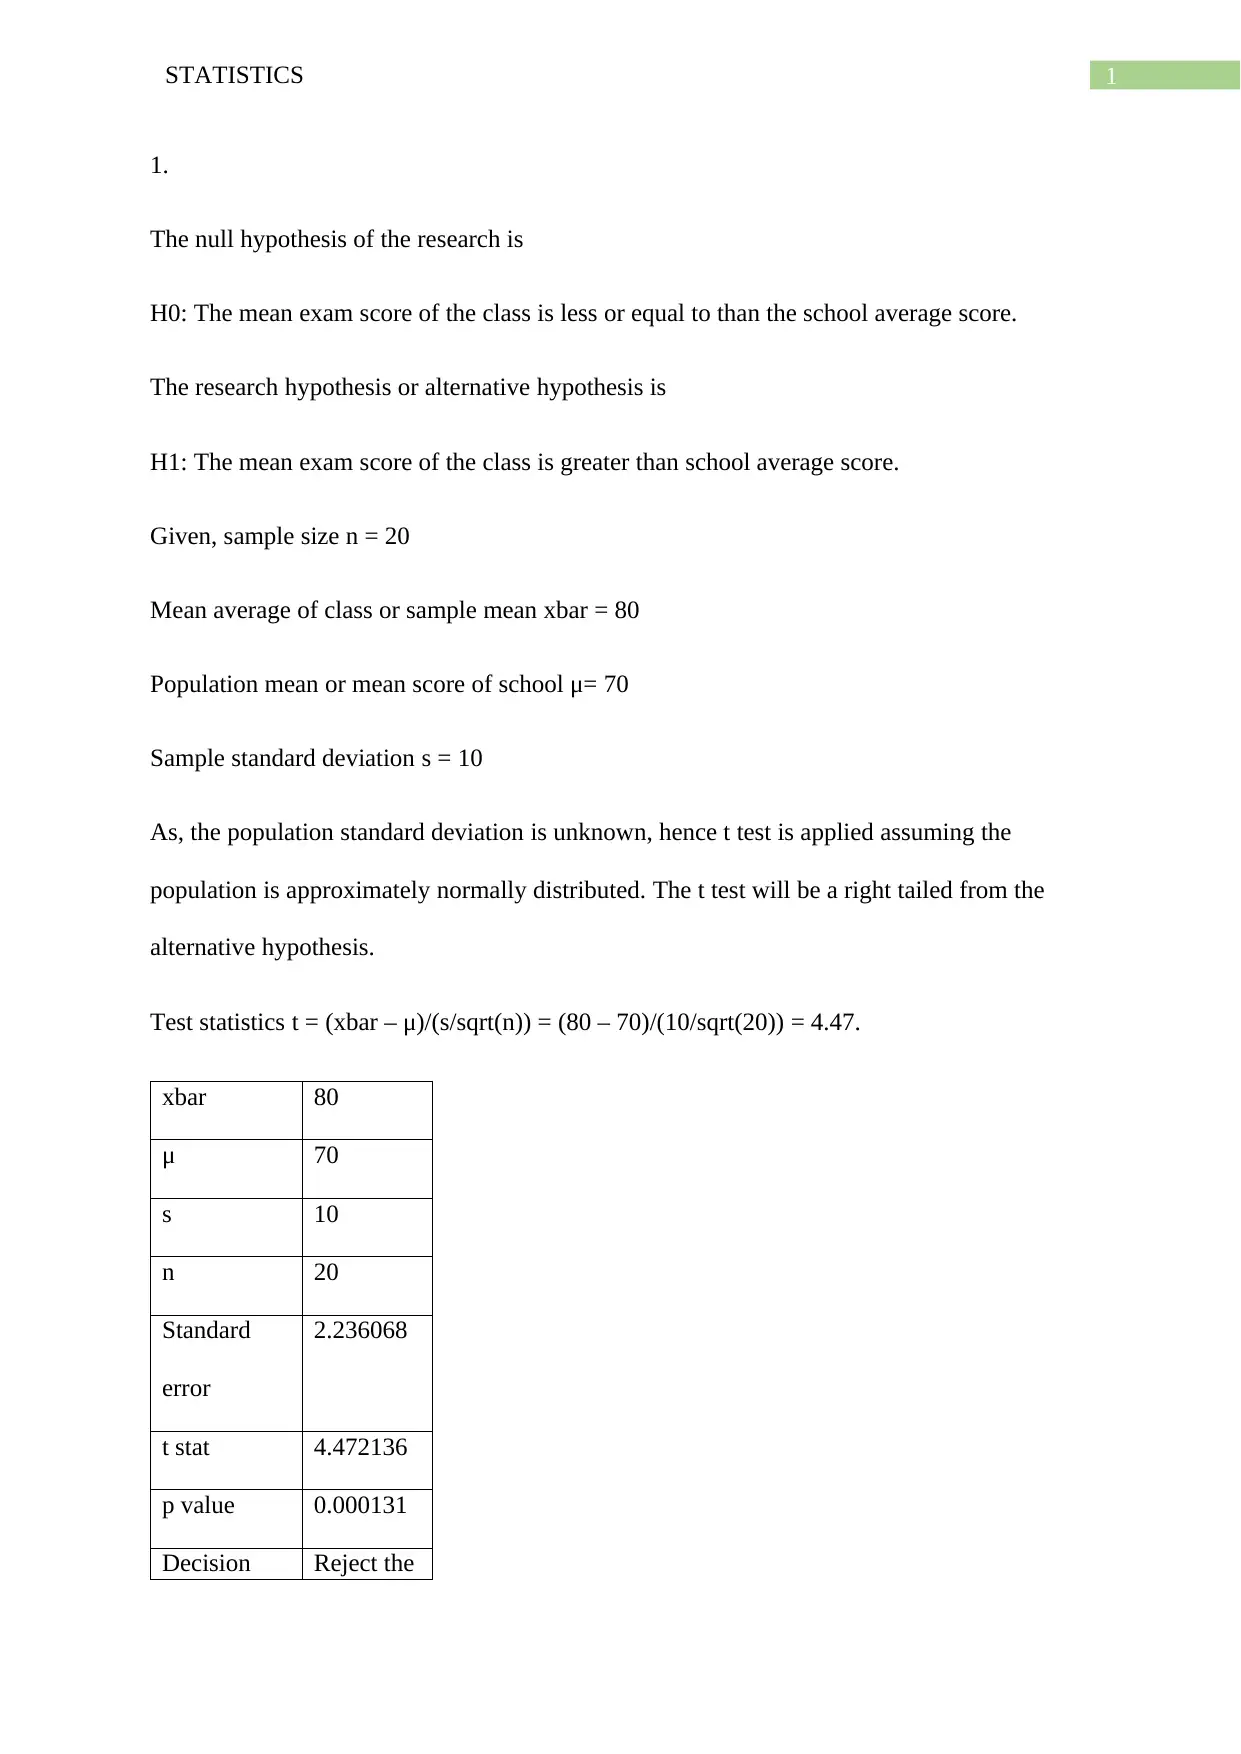
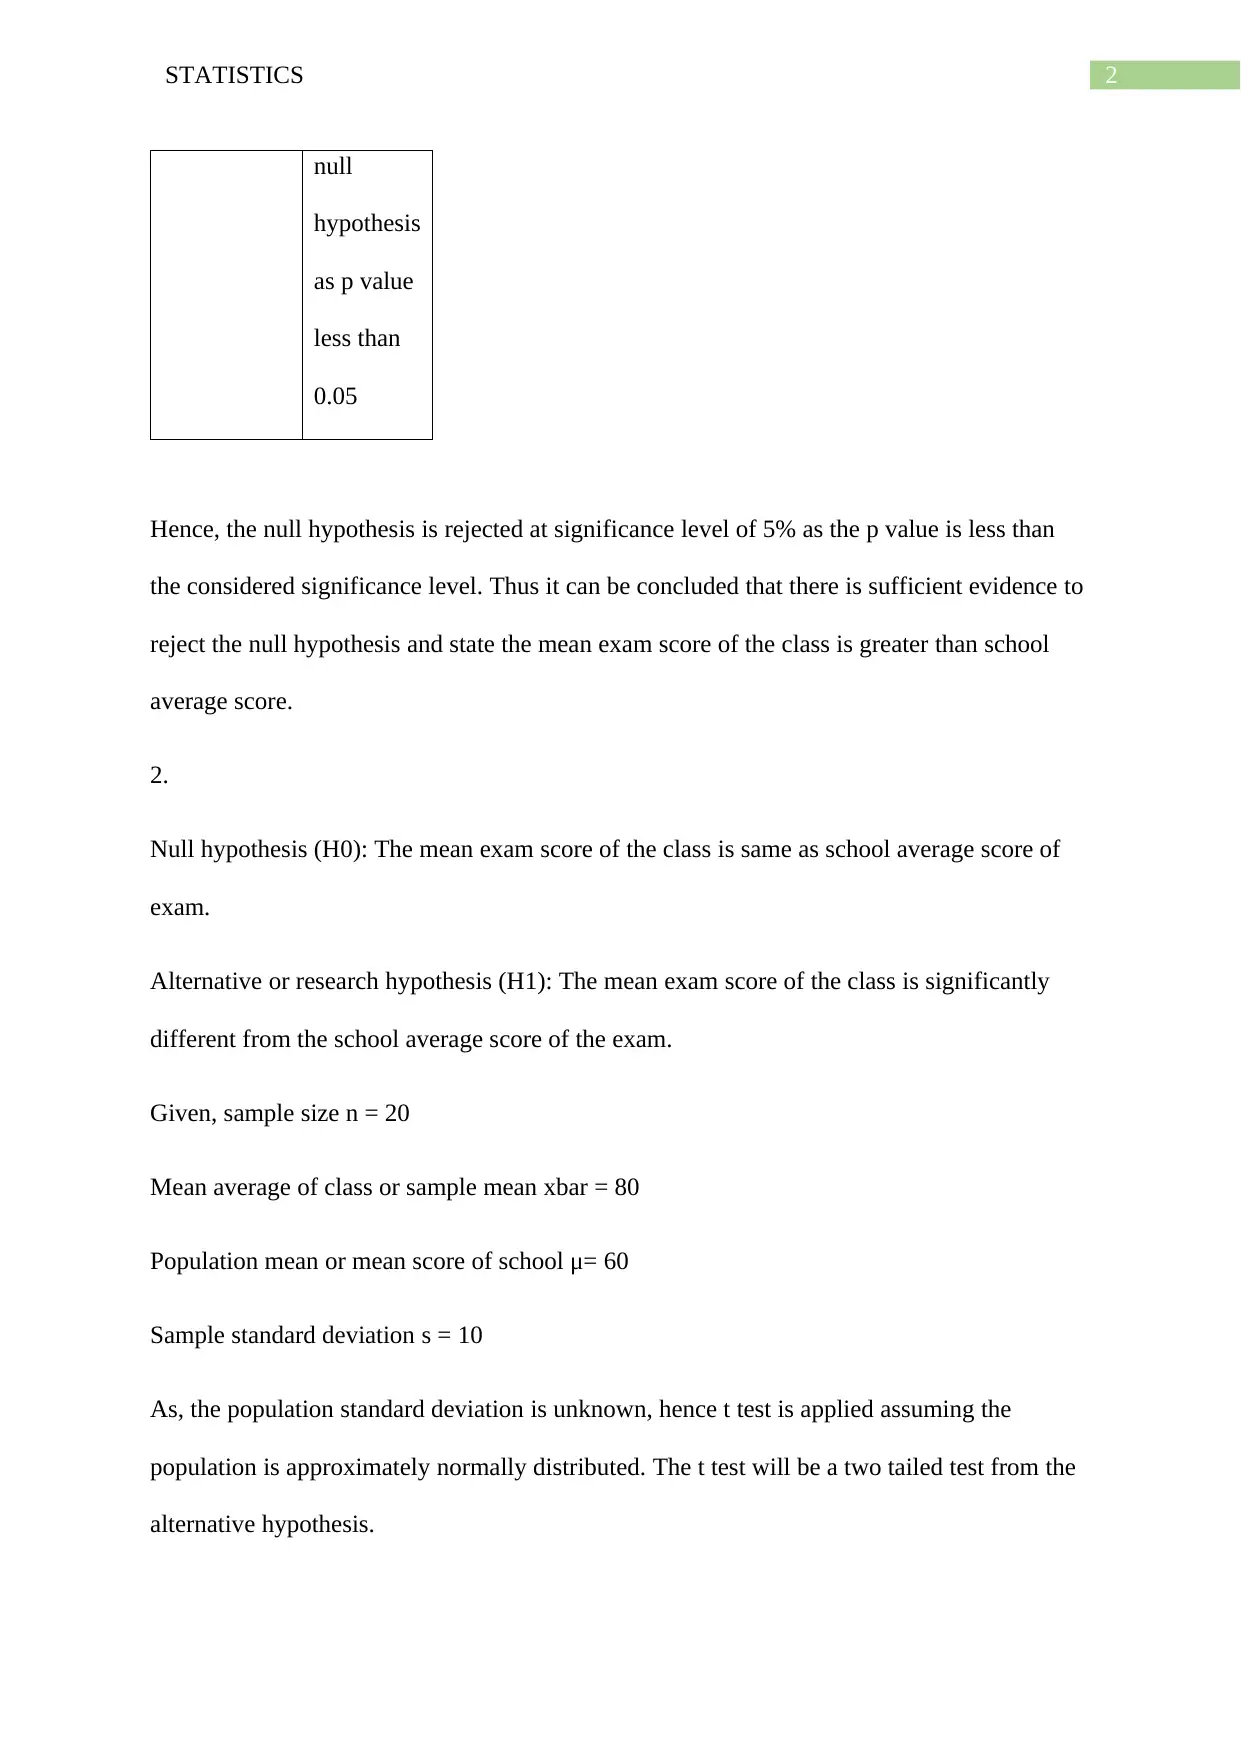
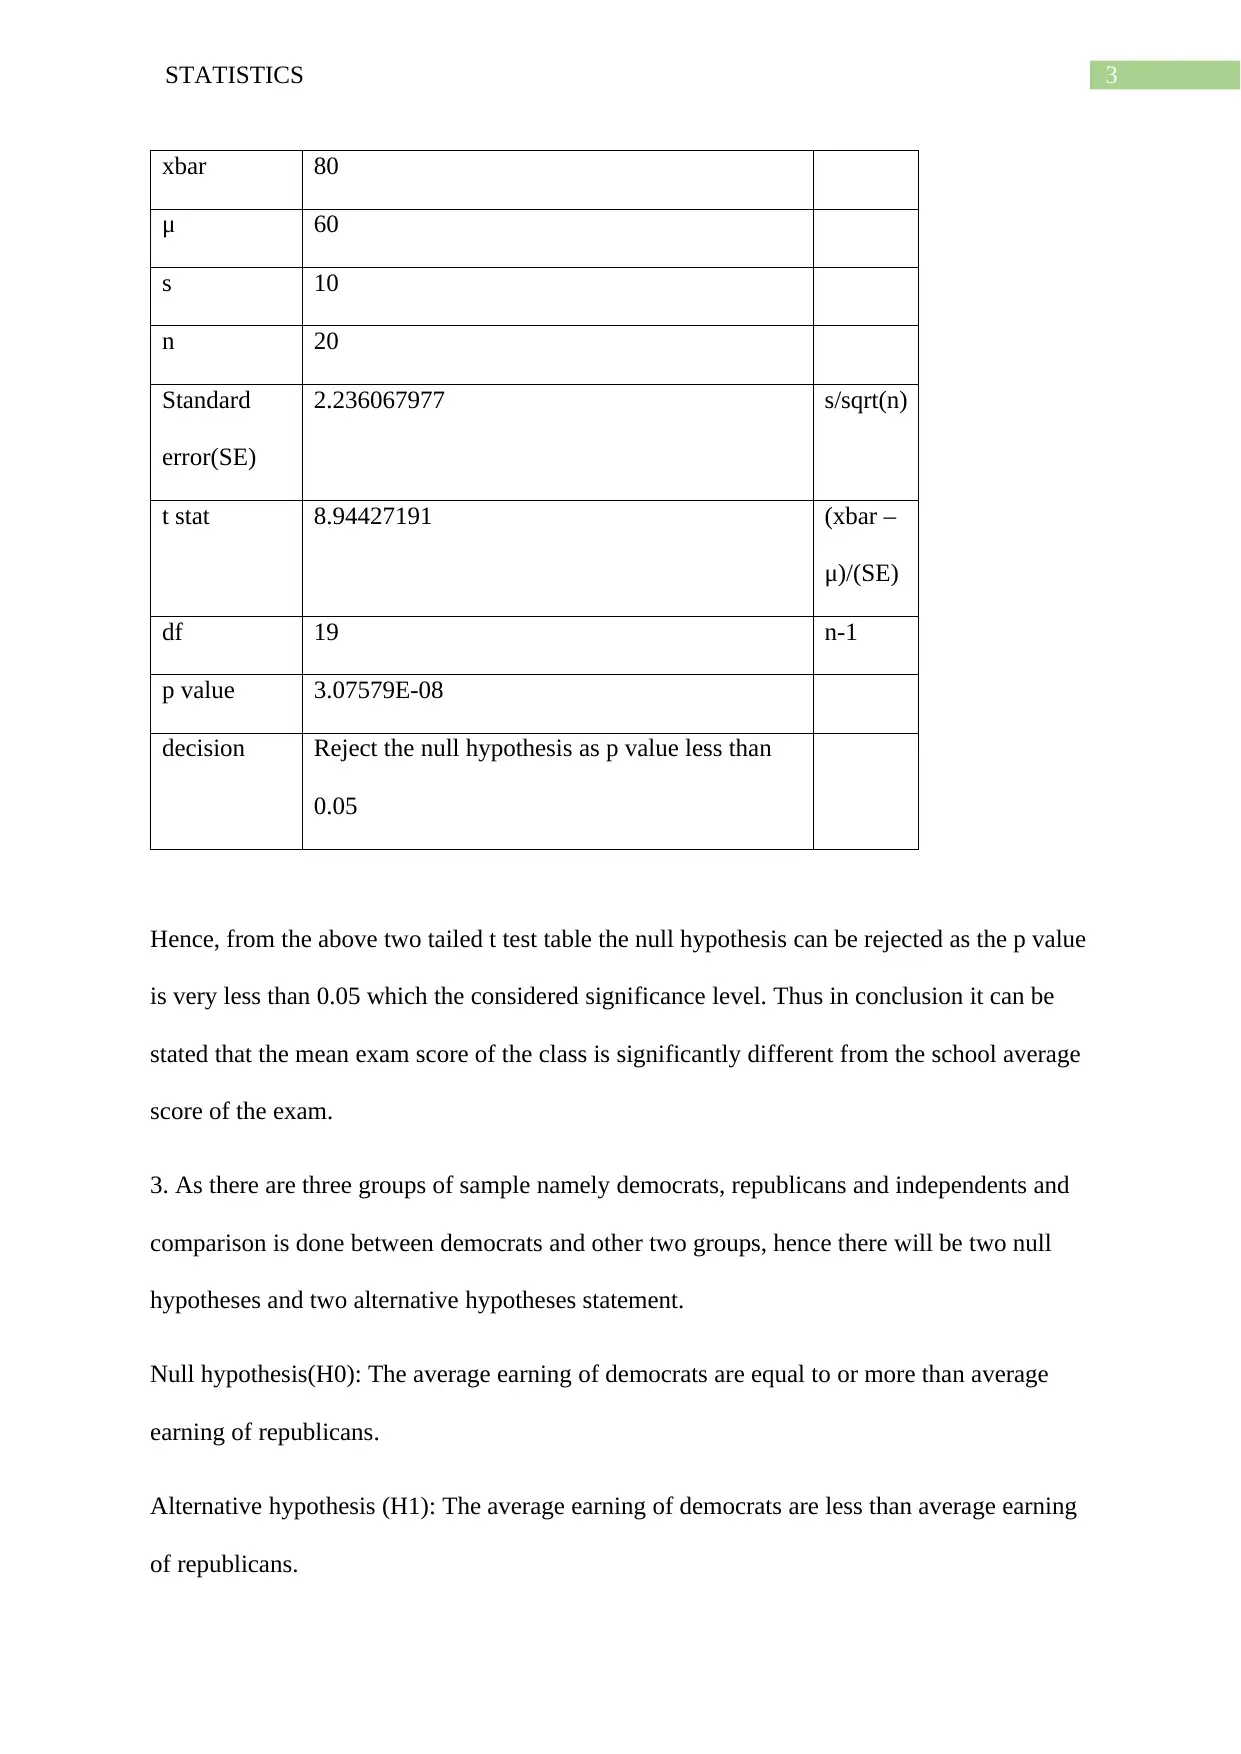
This statistics assignment solution addresses several hypothesis testing problems. The first section tests if a class's mean exam score of 80 is greater than the school average of 70, using a one-tailed t-test and rejecting the null hypothesis at a 5% significance level. The second problem examines if the class mean differs from a school average of 60, employing a two-tailed t-test and also rejecting the null hypothesis. The third part formulates null and alternative hypotheses to compare the earnings of Democrats, Republicans, and Independents. Finally, an independent samples t-test is performed to determine if there's a significant difference between HRT1 and HRT2 scores for two groups, concluding that there's not enough evidence to reject the null hypothesis, indicating the differences in HRT1 and HRT2 are similar across both groups. The solution includes detailed calculations, interpretations, and conclusions for each scenario.

Running head: STATISTICS
STATISTICS
Name of the Student
Name of the University
Author Note
STATISTICS
Name of the Student
Name of the University
Author Note
Paraphrase This Document
Need a fresh take? Get an instant paraphrase of this document with our AI Paraphraser

1STATISTICS
1.
The null hypothesis of the research is
H0: The mean exam score of the class is less or equal to than the school average score.
The research hypothesis or alternative hypothesis is
H1: The mean exam score of the class is greater than school average score.
Given, sample size n = 20
Mean average of class or sample mean xbar = 80
Population mean or mean score of school μ= 70
Sample standard deviation s = 10
As, the population standard deviation is unknown, hence t test is applied assuming the
population is approximately normally distributed. The t test will be a right tailed from the
alternative hypothesis.
Test statistics t = (xbar – μ)/(s/sqrt(n)) = (80 – 70)/(10/sqrt(20)) = 4.47.
xbar 80
μ 70
s 10
n 20
Standard
error
2.236068
t stat 4.472136
p value 0.000131
Decision Reject the

2STATISTICS
null
hypothesis
as p value
less than
0.05
Hence, the null hypothesis is rejected at significance level of 5% as the p value is less than
the considered significance level. Thus it can be concluded that there is sufficient evidence to
reject the null hypothesis and state the mean exam score of the class is greater than school
average score.
2.
Null hypothesis (H0): The mean exam score of the class is same as school average score of
exam.
Alternative or research hypothesis (H1): The mean exam score of the class is significantly
different from the school average score of the exam.
Given, sample size n = 20
Mean average of class or sample mean xbar = 80
Population mean or mean score of school μ= 60
Sample standard deviation s = 10
As, the population standard deviation is unknown, hence t test is applied assuming the
population is approximately normally distributed. The t test will be a two tailed test from the
alternative hypothesis.
⊘ This is a preview!⊘
Do you want full access?
Subscribe today to unlock all pages.

Trusted by 1+ million students worldwide

3STATISTICS
xbar 80
μ 60
s 10
n 20
Standard
error(SE)
2.236067977 s/sqrt(n)
t stat 8.94427191 (xbar –
μ)/(SE)
df 19 n-1
p value 3.07579E-08
decision Reject the null hypothesis as p value less than
0.05
Hence, from the above two tailed t test table the null hypothesis can be rejected as the p value
is very less than 0.05 which the considered significance level. Thus in conclusion it can be
stated that the mean exam score of the class is significantly different from the school average
score of the exam.
3. As there are three groups of sample namely democrats, republicans and independents and
comparison is done between democrats and other two groups, hence there will be two null
hypotheses and two alternative hypotheses statement.
Null hypothesis(H0): The average earning of democrats are equal to or more than average
earning of republicans.
Alternative hypothesis (H1): The average earning of democrats are less than average earning
of republicans.
Paraphrase This Document
Need a fresh take? Get an instant paraphrase of this document with our AI Paraphraser

4STATISTICS
Null hypothesis (H2): The average earning of democrats are equal to or more than average
earning of independents.
Alternative hypothesis (H3): The average earning of democrats are less than average earning
of independents.
4.
As the observations of the two groups represent different people hence the groups are not
related. Hence, an independent sample t test is performed here. At first the observations are
loaded into excel for calculation. Now, the following table is formed where the different
between HRT1 and HRT2 of the two groups 1 and 2 are separated in a table.
Group 1
difference
Group 2
difference
-24 -5
-14 -8
-19 -9
-25 -16
-15 -20
-4 -10
-12 -4
-30 -27
-23 -28
-30 -30

5STATISTICS
Now, independent sample t test is performed assuming the population variances of the two
groups’ populations are unequal and it is also assumed that two populations are
approximately normally distributed.
Null hypothesis(H0): The difference of HRT1 and HRT2 between two groups is zero or the
difference is same for each group in the population.
Alternative hypothesis(H1): The difference of HRT1 and HRT2 between two groups is non-
zero or there is significant difference in HRT1 and HRT2 difference between the two groups.
The t test is a two tailed test from the alternative hypothesis.
Chosen Significance level = 5%
T-test result:
t-Test: Two-Sample Assuming Unequal
Variances
Group 1
difference
Group 2
difference
Mean -19.6 -15.7
Variance 70.04444444 98.9
Observations 10 10
Hypothesized Mean Difference 0
df 17
t Stat -0.948839267
P(T<=t) one-tail 0.177998481
t Critical one-tail 1.739606726
⊘ This is a preview!⊘
Do you want full access?
Subscribe today to unlock all pages.

Trusted by 1+ million students worldwide

6STATISTICS
P(T<=t) two-tail 0.355996962
t Critical two-tail 2.109815578
Hence, the p value of two-tailed test from the table is found to be 0.356 which is more than
the chosen significance level of 0.05 and thus there is not enough evidence to reject the null
hypothesis.
Thus it can be concluded that the difference of HRT1 and HRT2 is same for each group 1 and
2 in the population.
The distribution of difference for the first group can be estimated to have large spread as the
variance is large with mean -19.6. The spread of difference of the 2nd group is much larger
than the first as variance is much higher (98.9) with mean of -15.7 which is very close to first
group.
1 out of 7
Related Documents

Your All-in-One AI-Powered Toolkit for Academic Success.
+13062052269
info@desklib.com
Available 24*7 on WhatsApp / Email
Unlock your academic potential
Copyright © 2020–2025 A2Z Services. All Rights Reserved. Developed and managed by ZUCOL.


