Statistics Assignment: ANOVA, Regression, and Hypothesis Testing
VerifiedAdded on 2020/05/16
|14
|1805
|829
Homework Assignment
AI Summary
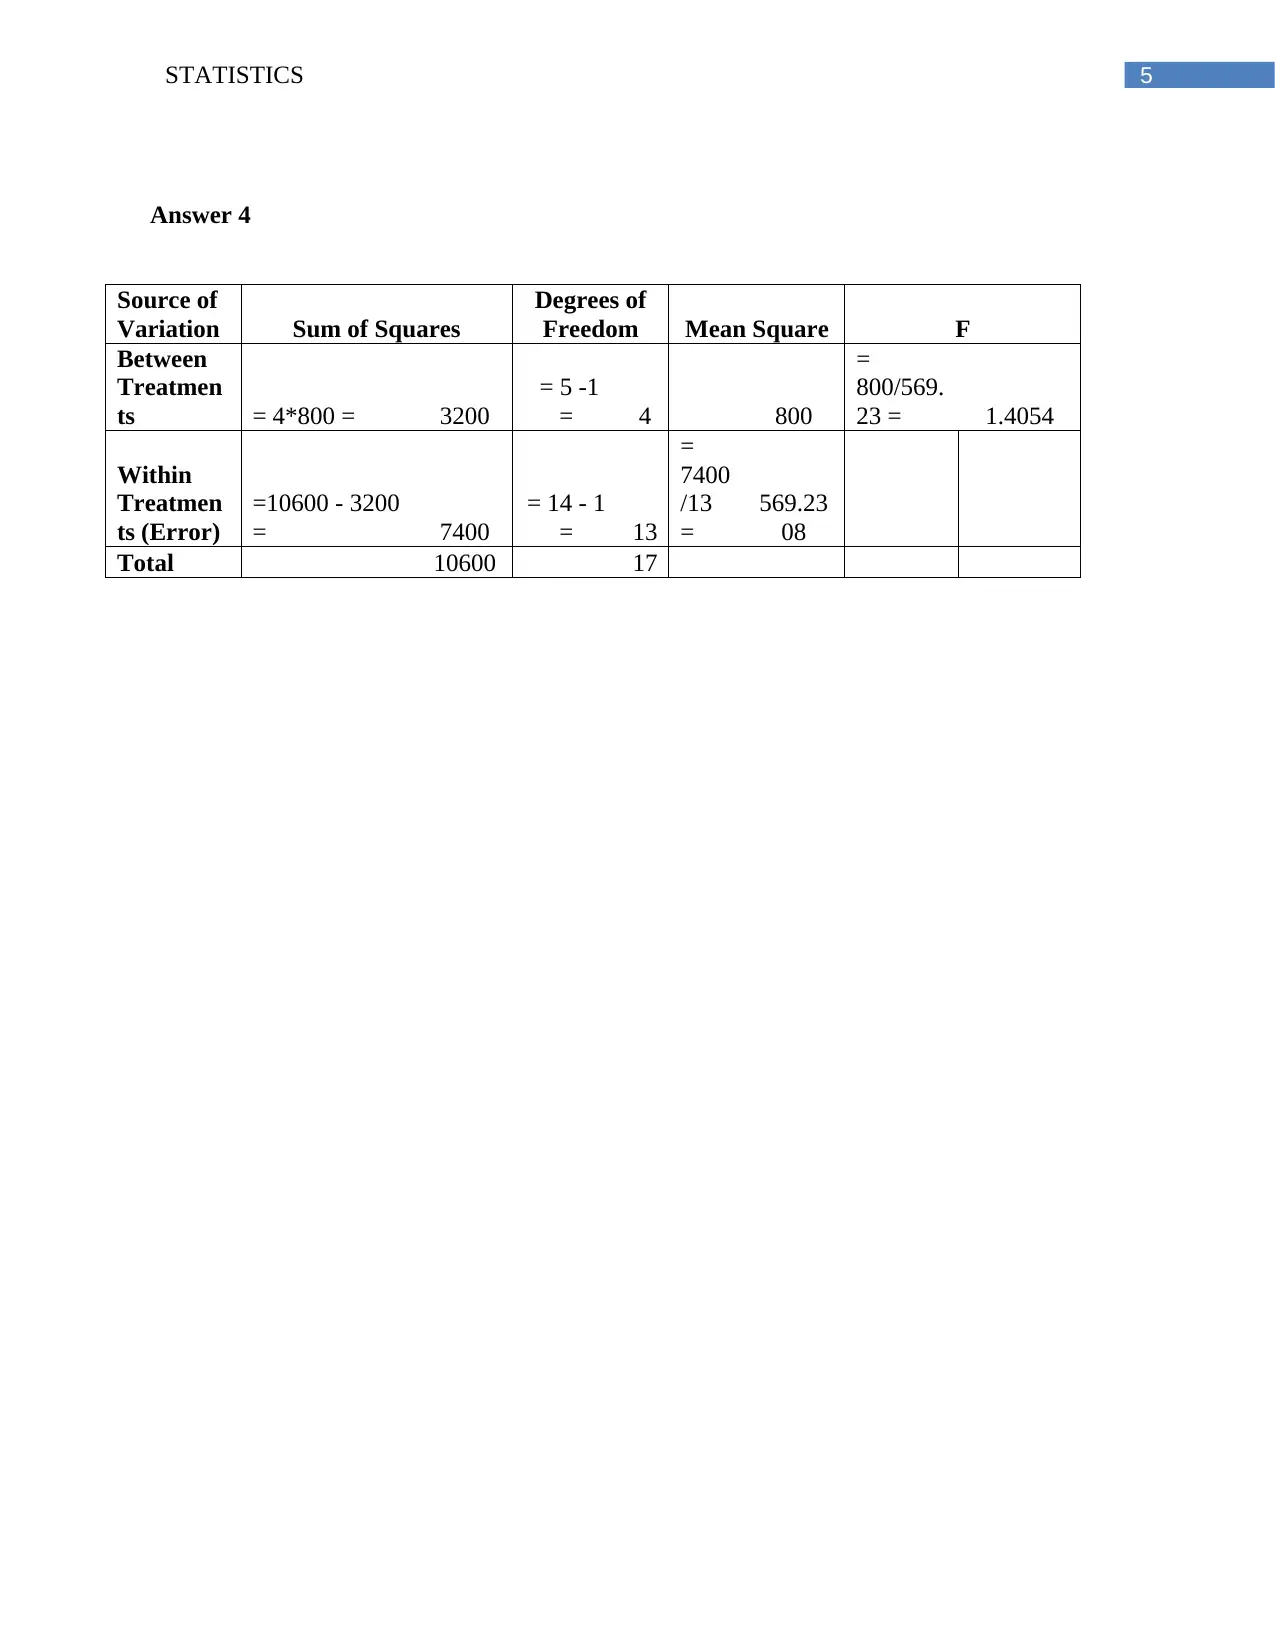
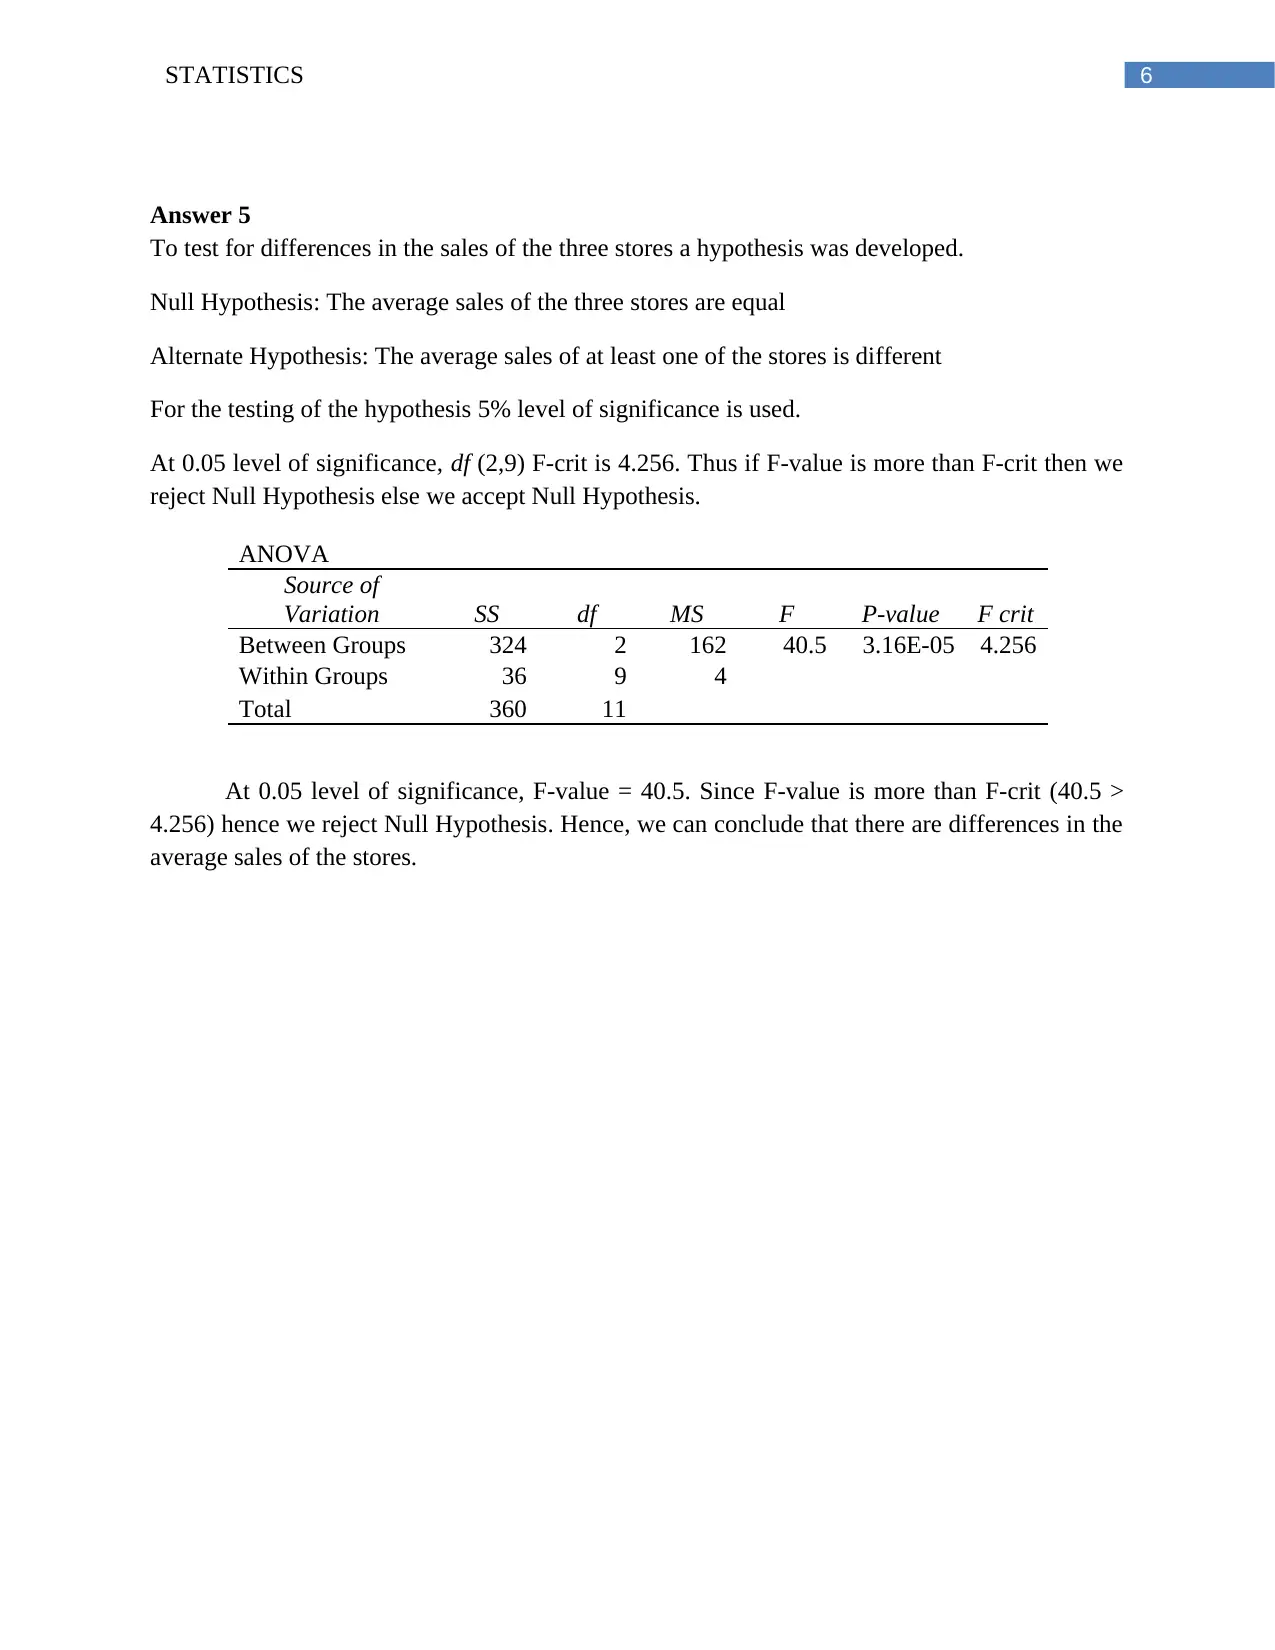
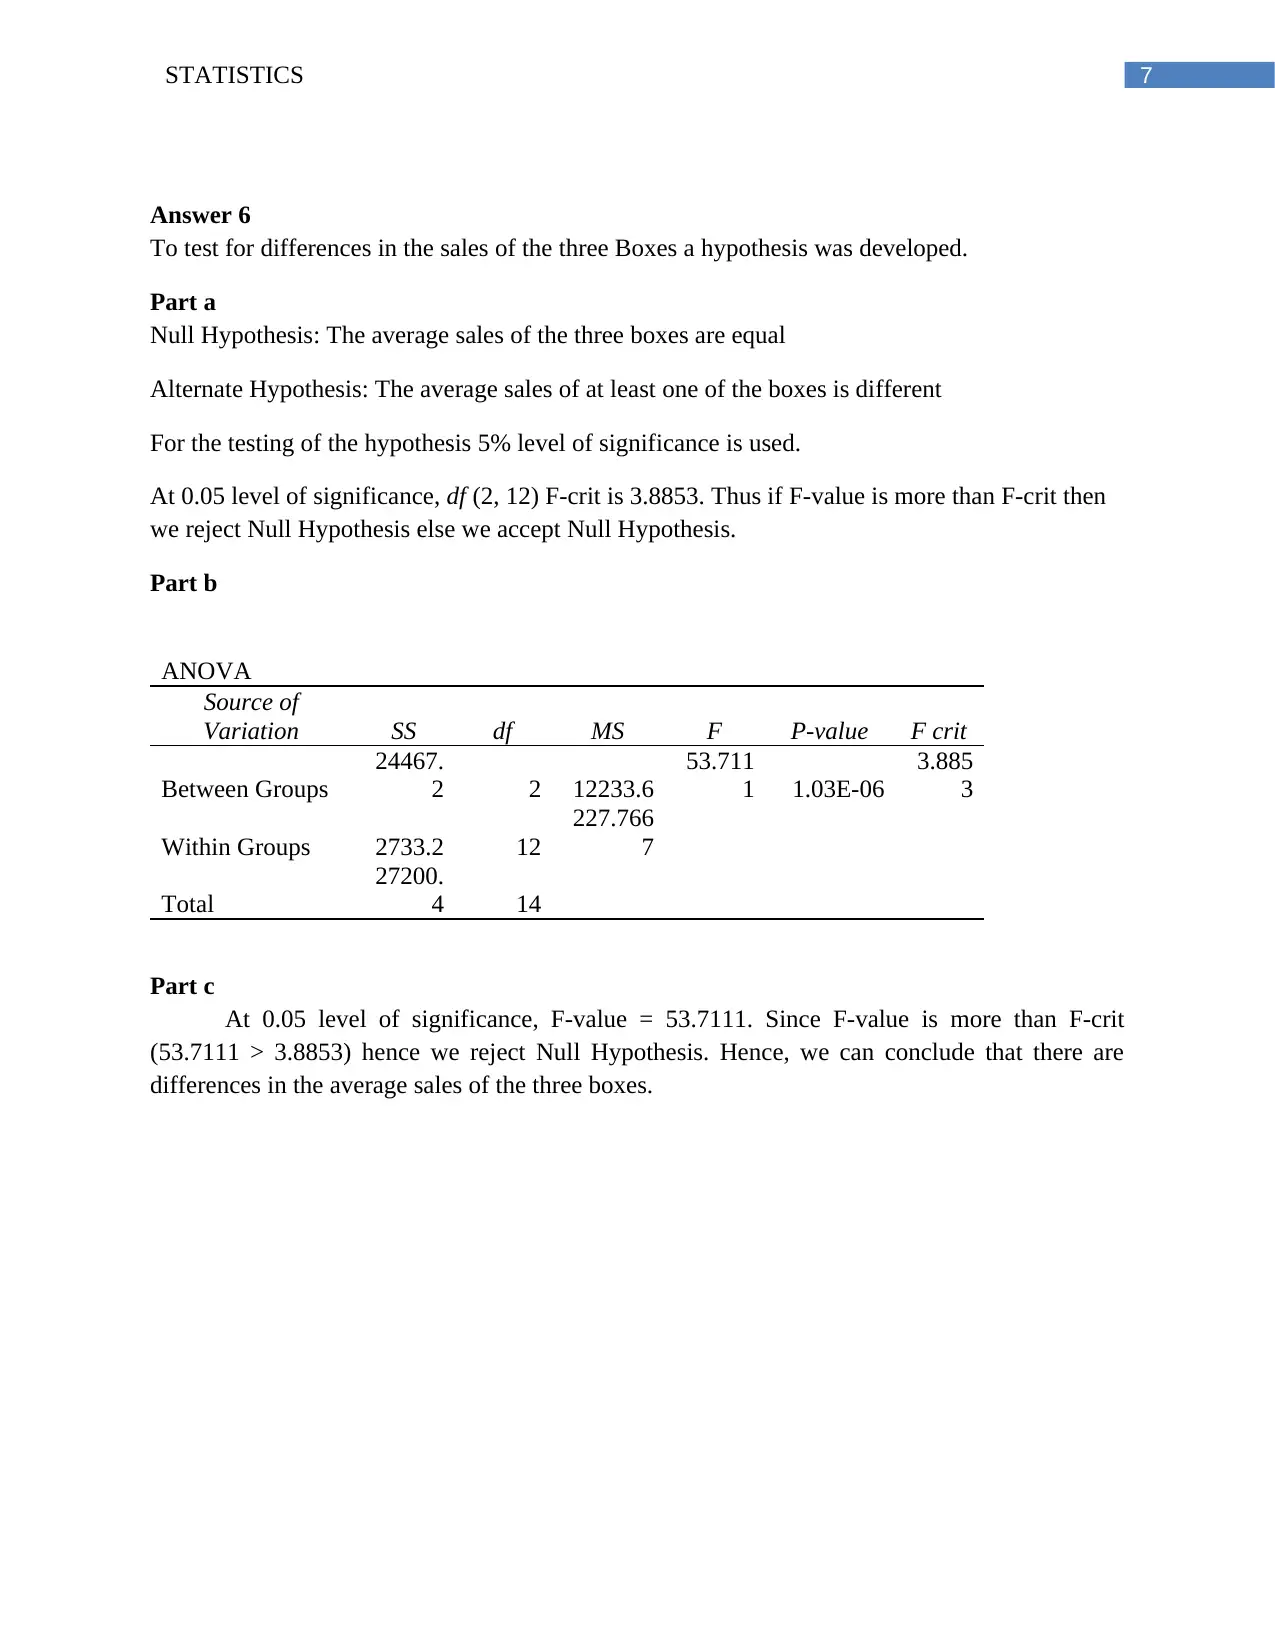
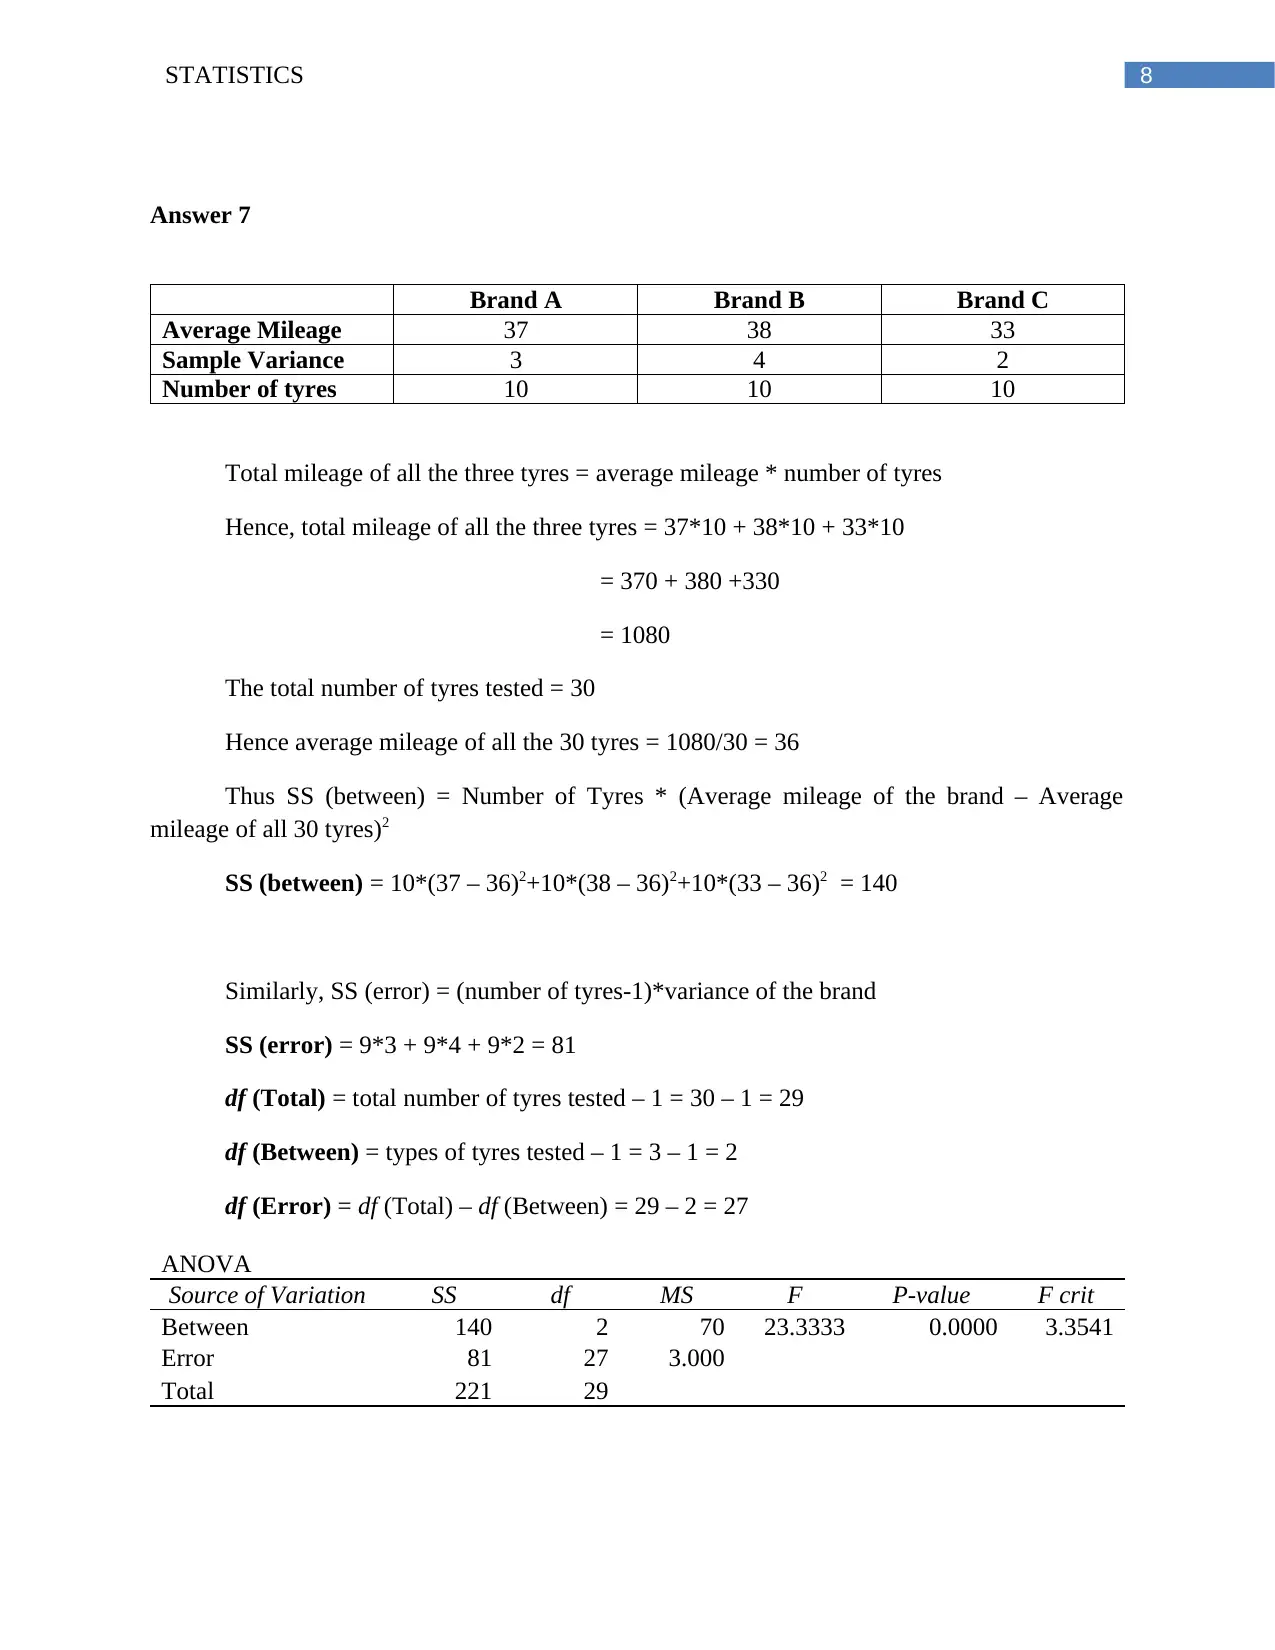
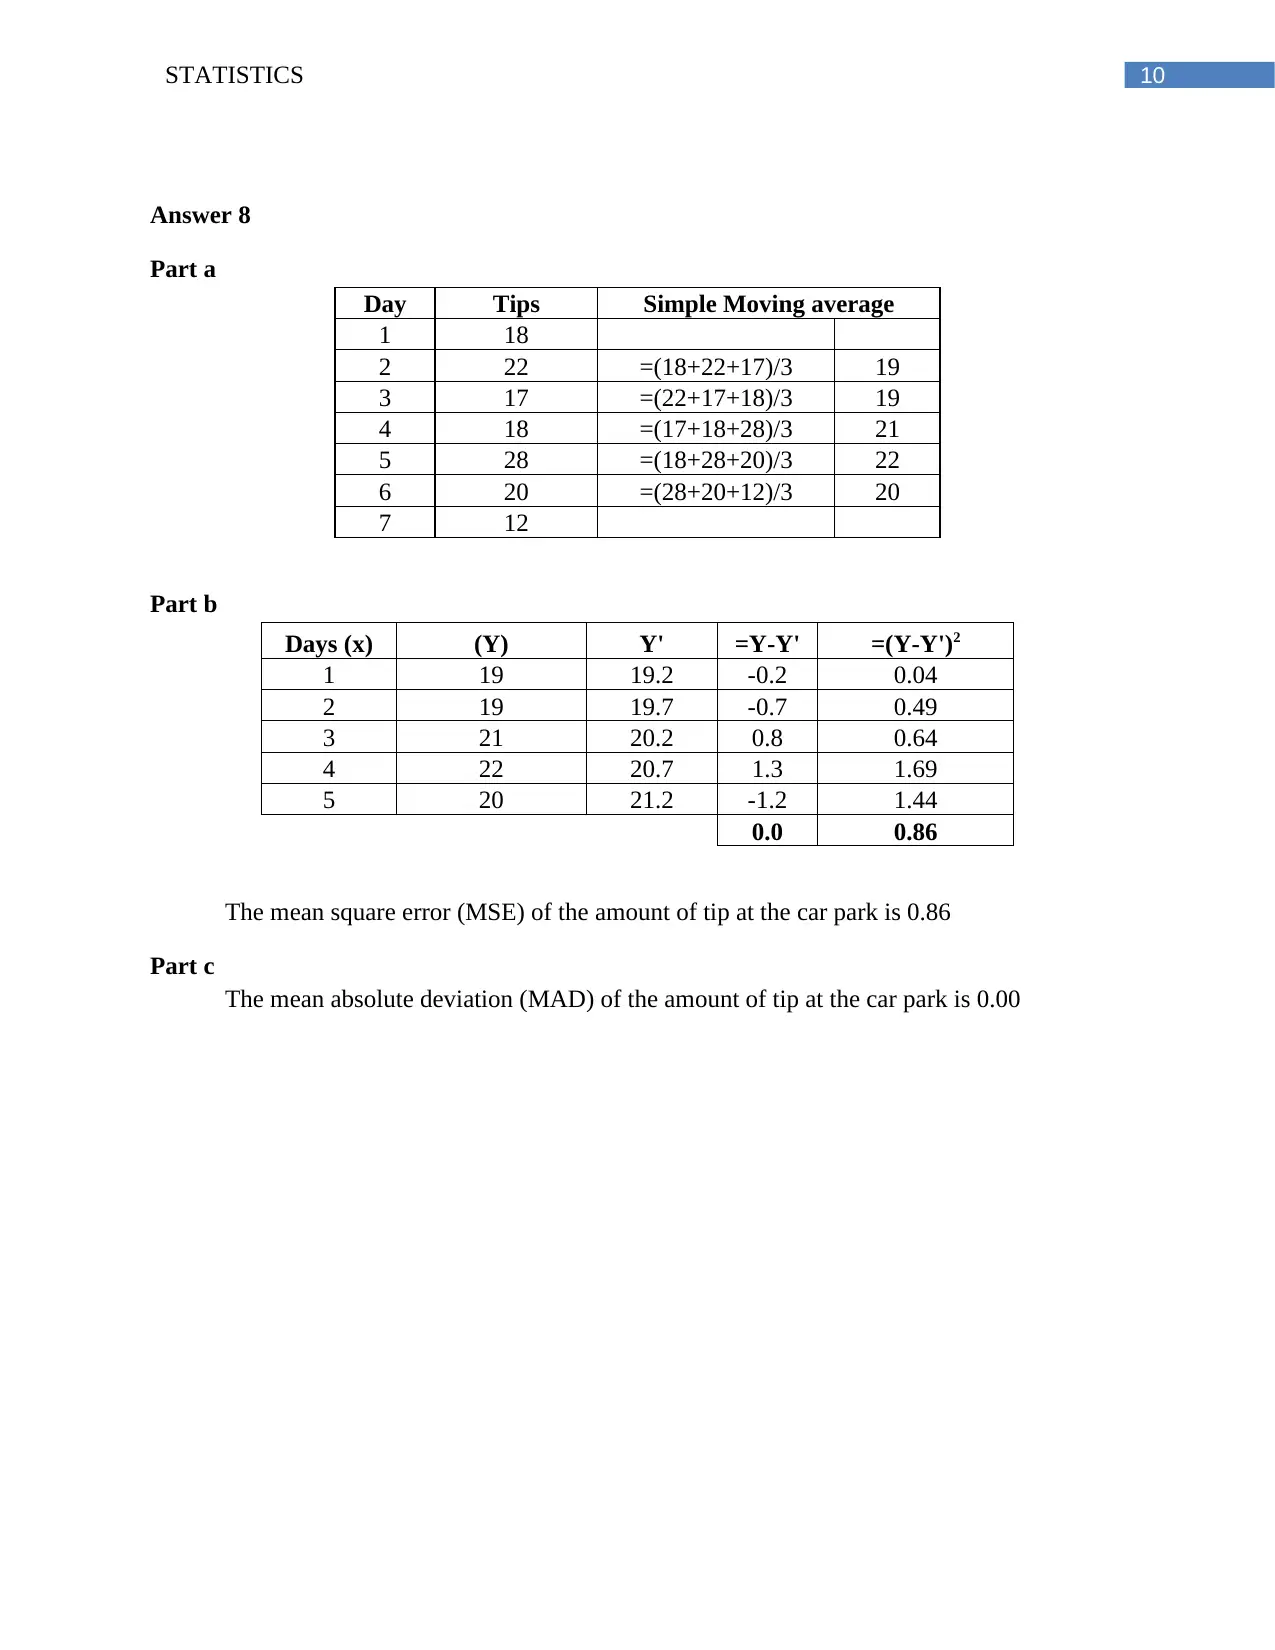
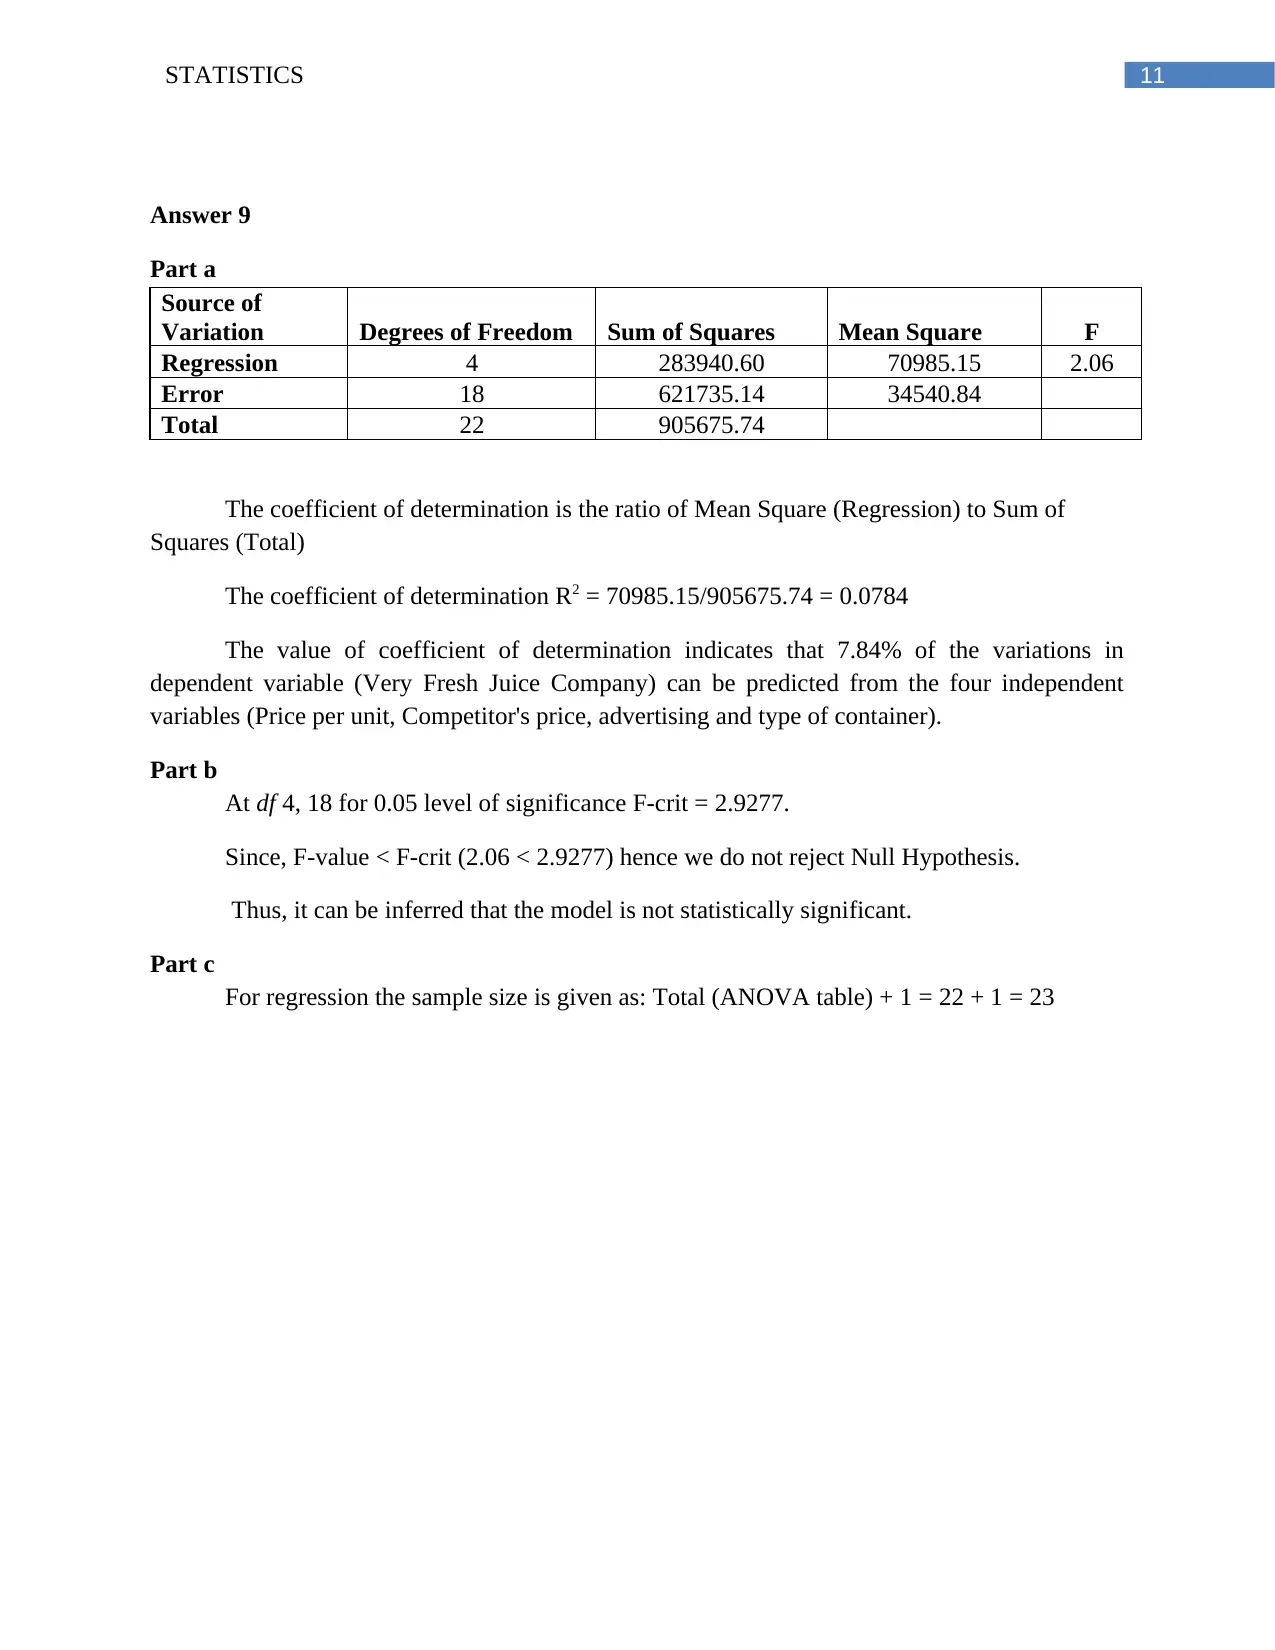
This statistics assignment presents solutions to a series of problems involving statistical analysis. The assignment covers various statistical methods, including ANOVA (Analysis of Variance), regression analysis, and hypothesis testing. The solutions detail the application of these methods to different datasets, providing calculations of F-values, p-values, and coefficients of determination. The assignment explores concepts such as the significance of relationships between variables, prediction of sales trends, and the comparison of means across different groups. Specific examples include analyzing sales data for stores and boxes, comparing mileage of tires, and predicting stock prices. Each solution includes step-by-step calculations, interpretations of results, and conclusions based on the statistical findings.

Running head: STATISTICS
Statistics
Name of the student
Name of the university
Author’s note
Statistics
Name of the student
Name of the university
Author’s note
Paraphrase This Document
Need a fresh take? Get an instant paraphrase of this document with our AI Paraphraser

1STATISTICS
Table of Contents
Answer 1.........................................................................................................................................2
Part a...........................................................................................................................................2
Part b...........................................................................................................................................2
Part c...........................................................................................................................................2
Answer 2.........................................................................................................................................3
Answer 3.........................................................................................................................................4
Part a...........................................................................................................................................4
Part b...........................................................................................................................................4
Answer 4.........................................................................................................................................5
Answer 5.........................................................................................................................................6
Answer 6.........................................................................................................................................7
Part a...........................................................................................................................................7
Part b...........................................................................................................................................7
Part c...........................................................................................................................................7
Answer 7.........................................................................................................................................8
Answer 8.......................................................................................................................................10
Part a.........................................................................................................................................10
Part b.........................................................................................................................................10
Part c.........................................................................................................................................10
Answer 9.......................................................................................................................................11
Part a.........................................................................................................................................11
Part b.........................................................................................................................................11
Part c.........................................................................................................................................11
Answer 10.....................................................................................................................................12
Part a.........................................................................................................................................12
Part b.........................................................................................................................................12
Part c.........................................................................................................................................12
Part d.........................................................................................................................................12

2STATISTICS
Answer 1
Source DF SS MS F
Factor m-1 SS (Between) MSB =
SS(Between)/(m-1)
MSB/MSE
Error n-m SS (Error) MSE = SS(Error)/(n-m)
Total n-1 SS (Total)
Part a
Table 1: ANOVA table
Source of Variation Sum of Squares Degrees of Freedom Mean Square F
Between Treatments 90 3 30 5
Within Treatments (Error) 120 20 6
Total 210 23
From excel we find that p-value for F= 5 at 3,20 df is 0.0095. Since, p-value < -value
hence reject Null Hypothesis.
Part b
df for number of groups:
m-1 = 3
m = 3 + 1 = 4
Hence, number of groups = 4
Part c
Total number of observations
n – 1 = 20
n = 21
Hence, number of observations = 21
⊘ This is a preview!⊘
Do you want full access?
Subscribe today to unlock all pages.

Trusted by 1+ million students worldwide

3STATISTICS
Answer 2
Table 2: Coefficients of Regression Equation
Coefficien
ts
Standa
rd
Error t Stat
P-
value
Interce
pt 136.0000
13.763
1 9.8815 0.0000
Year
(t) 39.1818 2.2181
17.664
3 0.0000
The linear trend equation
Number of Units sold (000s) = 136.00 + 39.1818*Year (t)
The number of cars sold for t = 11
Number of Units sold (000s) = 136.00 + 39.1818*Year (t)
Number of Units sold (000s) = 136.00 + 39.1818*11
Number of Units sold (000s) = 136.00 + 430.9998
Number of Units sold (000s) = 566.9998 ≈ 567
From the sales trend it is seen that the sales in the 11th year would be 567 (000s)
Paraphrase This Document
Need a fresh take? Get an instant paraphrase of this document with our AI Paraphraser

4STATISTICS
Answer 3
Part a
ANOVA
df SS MS F
Significanc
e F
Regression 1 59.89 59.89 29.6241 0.0028
Residual 5 10.11 2.02
Total 6 70
At 0.01 level of significance the value of F = 29.6241 for df 1,5. From F-table it is seen that the
F-crit value for 1,5 df at
= 0.01 is 16.26. Since F-value is more than F-crit (29.6241 > 16.26)
hence we reject the Null Hypothesis.
Thus, we find that there is a statistically significant relationship between price and number of
flash drives.
Part b
ANOVA
df SS MS F
Significanc
e F
Regression 1 59.89 59.89
29.624
1 0.0028
Residual 5 10.11 2.02
Total 6 70
At 0.01 level of significance the value of F = 29.6241 for df 1,5. The corresponding p-value is
0.0028. Since p-value is less than the level of significance hence we reject the Null Hypothesis.
Thus, we find that there is a statistically significant relationship between price and number of
flash drives.

5STATISTICS
Answer 4
Source of
Variation Sum of Squares
Degrees of
Freedom Mean Square F
Between
Treatmen
ts = 4*800 = 3200
= 5 -1
= 4 800
=
800/569.
23 = 1.4054
Within
Treatmen
ts (Error)
=10600 - 3200
= 7400
= 14 - 1
= 13
=
7400
/13
=
569.23
08
Total 10600 17
Answer 4
Source of
Variation Sum of Squares
Degrees of
Freedom Mean Square F
Between
Treatmen
ts = 4*800 = 3200
= 5 -1
= 4 800
=
800/569.
23 = 1.4054
Within
Treatmen
ts (Error)
=10600 - 3200
= 7400
= 14 - 1
= 13
=
7400
/13
=
569.23
08
Total 10600 17
⊘ This is a preview!⊘
Do you want full access?
Subscribe today to unlock all pages.

Trusted by 1+ million students worldwide

6STATISTICS
Answer 5
To test for differences in the sales of the three stores a hypothesis was developed.
Null Hypothesis: The average sales of the three stores are equal
Alternate Hypothesis: The average sales of at least one of the stores is different
For the testing of the hypothesis 5% level of significance is used.
At 0.05 level of significance, df (2,9) F-crit is 4.256. Thus if F-value is more than F-crit then we
reject Null Hypothesis else we accept Null Hypothesis.
ANOVA
Source of
Variation SS df MS F P-value F crit
Between Groups 324 2 162 40.5 3.16E-05 4.256
Within Groups 36 9 4
Total 360 11
At 0.05 level of significance, F-value = 40.5. Since F-value is more than F-crit (40.5 >
4.256) hence we reject Null Hypothesis. Hence, we can conclude that there are differences in the
average sales of the stores.
Paraphrase This Document
Need a fresh take? Get an instant paraphrase of this document with our AI Paraphraser

7STATISTICS
Answer 6
To test for differences in the sales of the three Boxes a hypothesis was developed.
Part a
Null Hypothesis: The average sales of the three boxes are equal
Alternate Hypothesis: The average sales of at least one of the boxes is different
For the testing of the hypothesis 5% level of significance is used.
At 0.05 level of significance, df (2, 12) F-crit is 3.8853. Thus if F-value is more than F-crit then
we reject Null Hypothesis else we accept Null Hypothesis.
Part b
ANOVA
Source of
Variation SS df MS F P-value F crit
Between Groups
24467.
2 2 12233.6
53.711
1 1.03E-06
3.885
3
Within Groups 2733.2 12
227.766
7
Total
27200.
4 14
Part c
At 0.05 level of significance, F-value = 53.7111. Since F-value is more than F-crit
(53.7111 > 3.8853) hence we reject Null Hypothesis. Hence, we can conclude that there are
differences in the average sales of the three boxes.

8STATISTICS
Answer 7
Brand A Brand B Brand C
Average Mileage 37 38 33
Sample Variance 3 4 2
Number of tyres 10 10 10
Total mileage of all the three tyres = average mileage * number of tyres
Hence, total mileage of all the three tyres = 37*10 + 38*10 + 33*10
= 370 + 380 +330
= 1080
The total number of tyres tested = 30
Hence average mileage of all the 30 tyres = 1080/30 = 36
Thus SS (between) = Number of Tyres * (Average mileage of the brand – Average
mileage of all 30 tyres)2
SS (between) = 10*(37 – 36)2+10*(38 – 36)2+10*(33 – 36)2 = 140
Similarly, SS (error) = (number of tyres-1)*variance of the brand
SS (error) = 9*3 + 9*4 + 9*2 = 81
df (Total) = total number of tyres tested – 1 = 30 – 1 = 29
df (Between) = types of tyres tested – 1 = 3 – 1 = 2
df (Error) = df (Total) – df (Between) = 29 – 2 = 27
ANOVA
Source of Variation SS df MS F P-value F crit
Between 140 2 70 23.3333 0.0000 3.3541
Error 81 27 3.000
Total 221 29
⊘ This is a preview!⊘
Do you want full access?
Subscribe today to unlock all pages.

Trusted by 1+ million students worldwide

9STATISTICS
F-value for df 2, 27 is 23.333. F-crit for df 2, 27 at 0.05 level of significance is 3.3541.
Since F-value is more than F-crit (23.333 > 3.3541) hence Null Hypothesis is rejected.
Thus, we find that there is a statistically significant differences in the mileage of the
tyres.
F-value for df 2, 27 is 23.333. F-crit for df 2, 27 at 0.05 level of significance is 3.3541.
Since F-value is more than F-crit (23.333 > 3.3541) hence Null Hypothesis is rejected.
Thus, we find that there is a statistically significant differences in the mileage of the
tyres.
Paraphrase This Document
Need a fresh take? Get an instant paraphrase of this document with our AI Paraphraser

10STATISTICS
Answer 8
Part a
Day Tips Simple Moving average
1 18
2 22 =(18+22+17)/3 19
3 17 =(22+17+18)/3 19
4 18 =(17+18+28)/3 21
5 28 =(18+28+20)/3 22
6 20 =(28+20+12)/3 20
7 12
Part b
Days (x) (Y) Y' =Y-Y' =(Y-Y')2
1 19 19.2 -0.2 0.04
2 19 19.7 -0.7 0.49
3 21 20.2 0.8 0.64
4 22 20.7 1.3 1.69
5 20 21.2 -1.2 1.44
0.0 0.86
The mean square error (MSE) of the amount of tip at the car park is 0.86
Part c
The mean absolute deviation (MAD) of the amount of tip at the car park is 0.00

11STATISTICS
Answer 9
Part a
Source of
Variation Degrees of Freedom Sum of Squares Mean Square F
Regression 4 283940.60 70985.15 2.06
Error 18 621735.14 34540.84
Total 22 905675.74
The coefficient of determination is the ratio of Mean Square (Regression) to Sum of
Squares (Total)
The coefficient of determination R2 = 70985.15/905675.74 = 0.0784
The value of coefficient of determination indicates that 7.84% of the variations in
dependent variable (Very Fresh Juice Company) can be predicted from the four independent
variables (Price per unit, Competitor's price, advertising and type of container).
Part b
At df 4, 18 for 0.05 level of significance F-crit = 2.9277.
Since, F-value < F-crit (2.06 < 2.9277) hence we do not reject Null Hypothesis.
Thus, it can be inferred that the model is not statistically significant.
Part c
For regression the sample size is given as: Total (ANOVA table) + 1 = 22 + 1 = 23
⊘ This is a preview!⊘
Do you want full access?
Subscribe today to unlock all pages.

Trusted by 1+ million students worldwide
1 out of 14
Related Documents

Your All-in-One AI-Powered Toolkit for Academic Success.
+13062052269
info@desklib.com
Available 24*7 on WhatsApp / Email
Unlock your academic potential
Copyright © 2020–2025 A2Z Services. All Rights Reserved. Developed and managed by ZUCOL.