Statistics Assignment: Hypothesis Testing (Chapter 10 & 11)

Verified

Added on  2022/10/18

|4
|775
|11
Homework Assignment
AI Summary
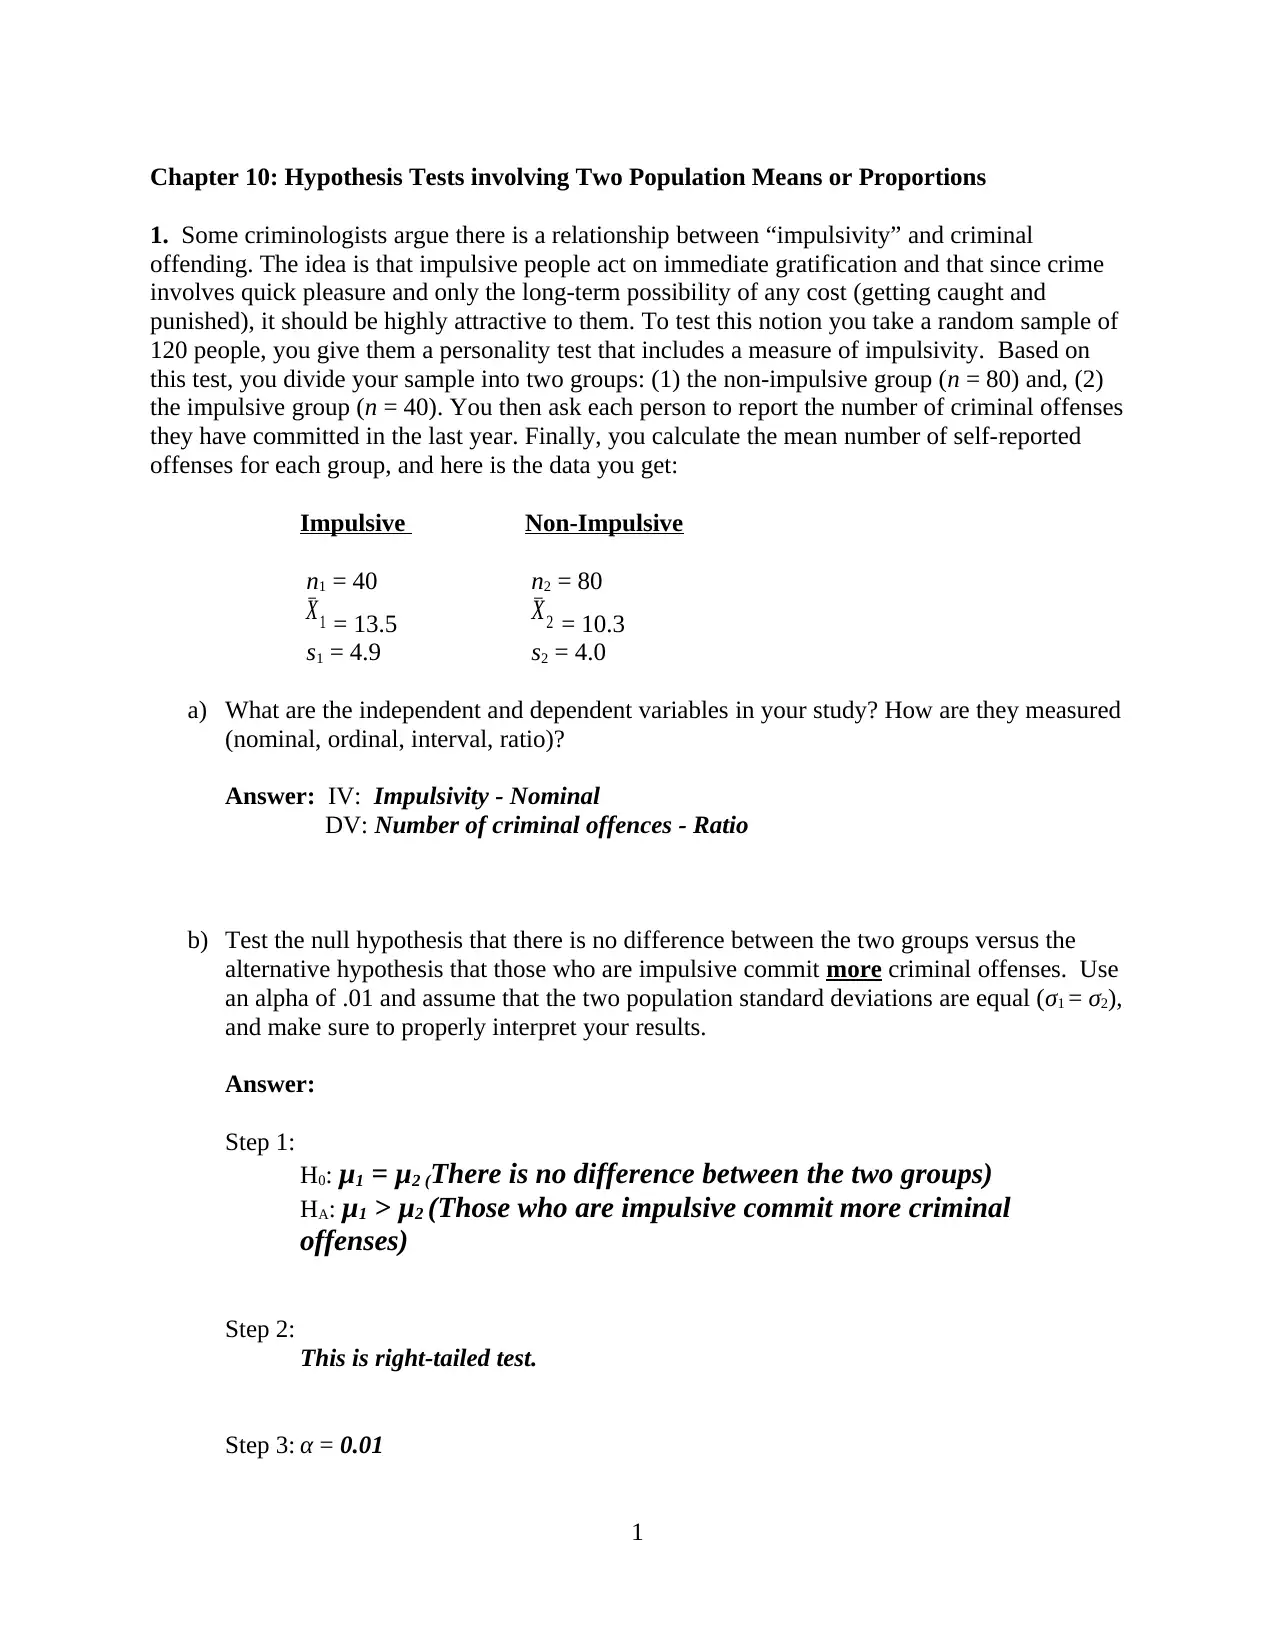
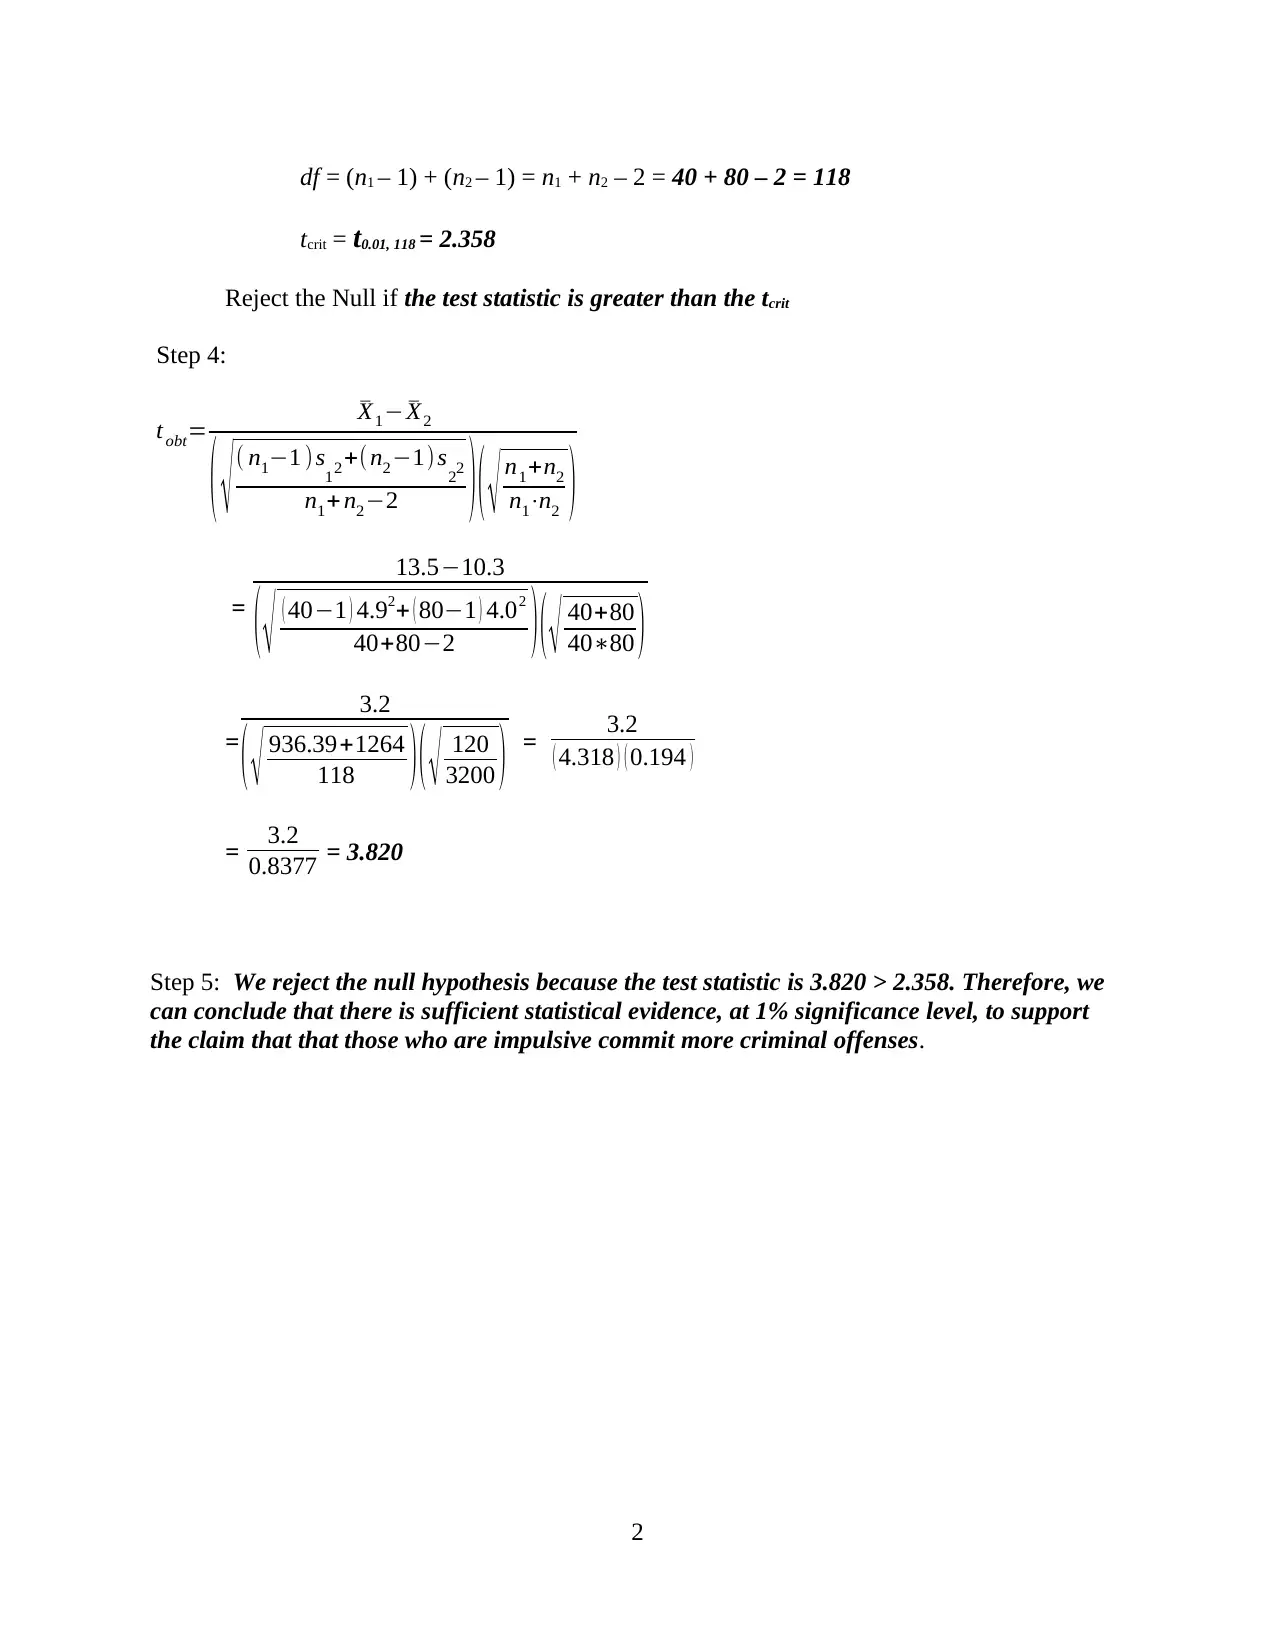
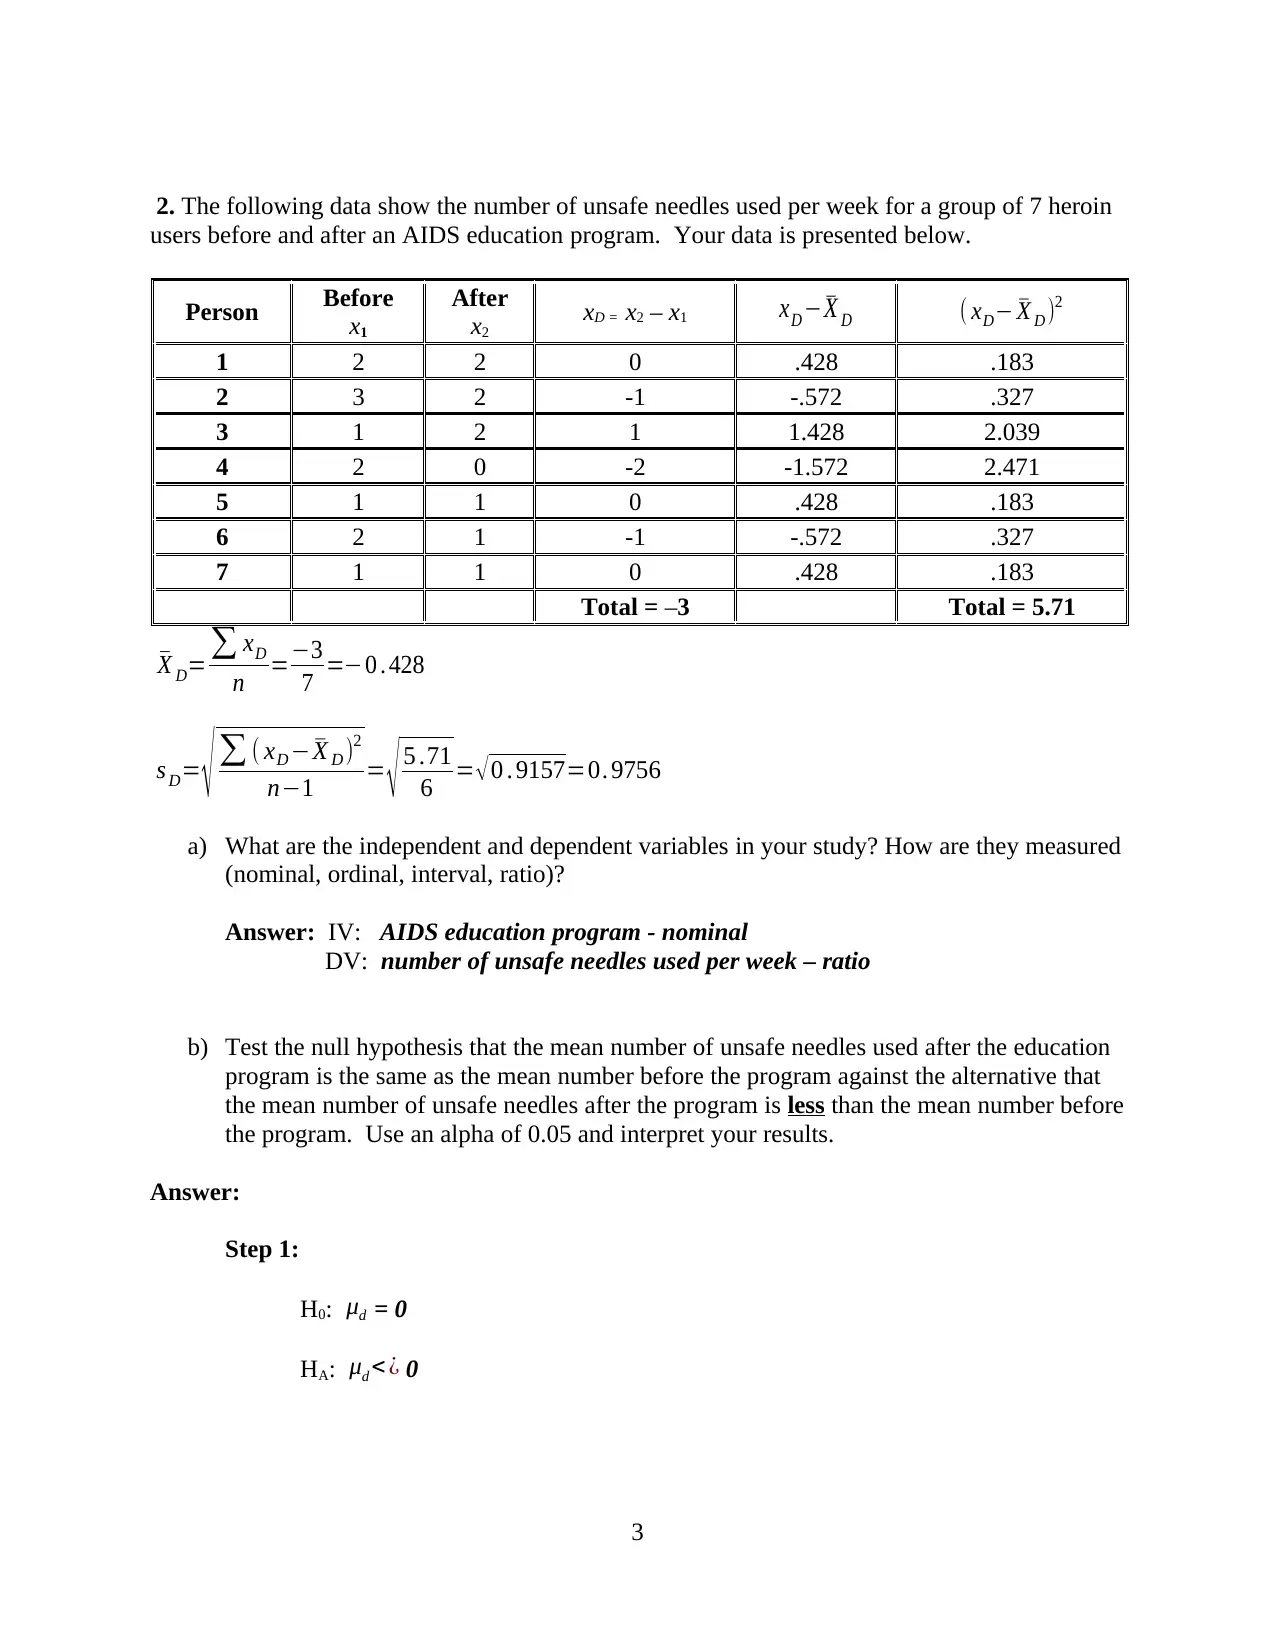
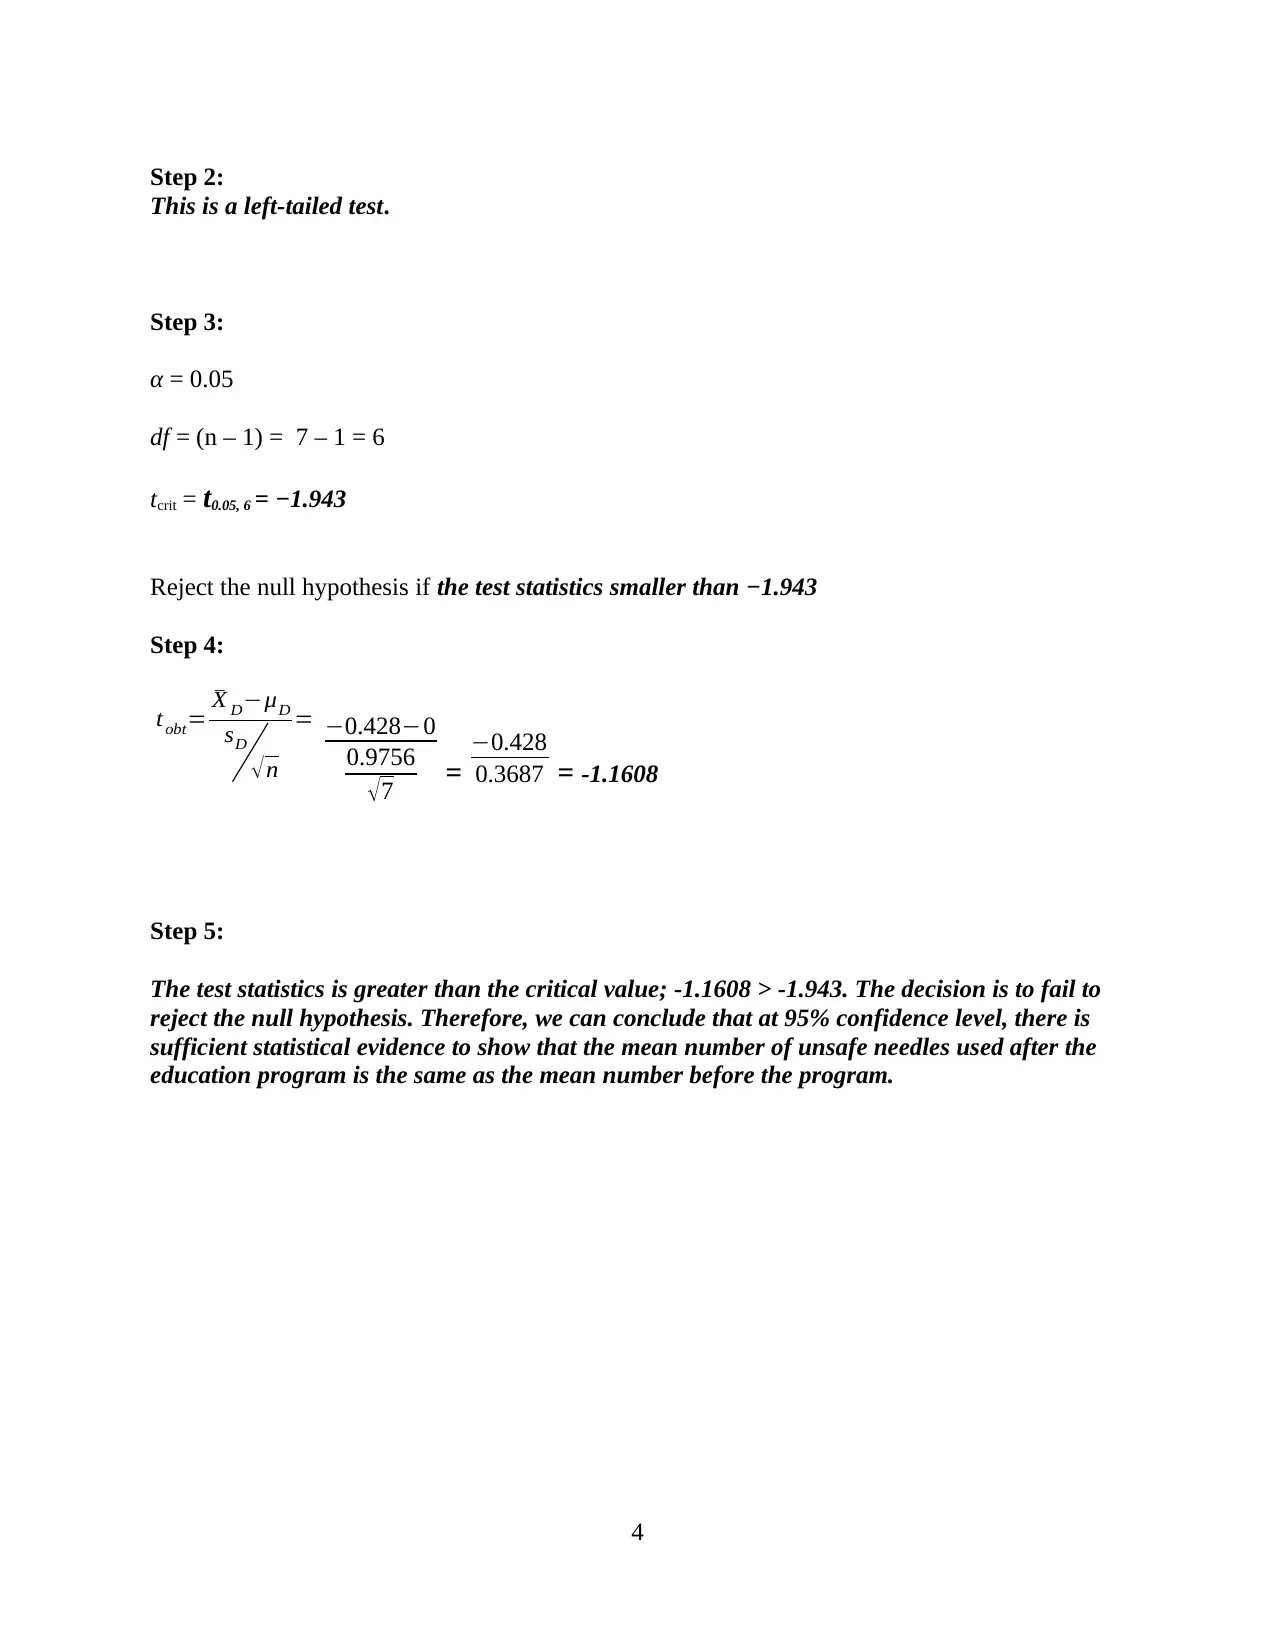
This assignment provides a comprehensive solution to a statistics homework problem, focusing on hypothesis testing involving two population means or proportions. The solution includes step-by-step explanations, calculations, and interpretations of the results. The assignment covers various scenarios, including a criminological study on impulsivity and criminal offenses, and an analysis of an AIDS education program's impact on unsafe needle usage. The solution also addresses hypothesis tests involving three or more population means and bivariate correlation and regression. The document includes detailed answers to questions regarding independent and dependent variables, their measurement scales, and the interpretation of statistical outputs, such as Pearson's r correlation coefficient and regression equations. The assignment emphasizes the importance of understanding null and alternative hypotheses, significance levels, and critical values in drawing valid conclusions from statistical analyses. The assignment covers different statistical tests like t-tests and ANOVA, providing a complete learning resource for students in statistics.
Document Page
Chapter 10: Hypothesis Tests involving Two Population Means or Proportions
1. Some criminologists argue there is a relationship between “impulsivity” and criminal
offending. The idea is that impulsive people act on immediate gratification and that since crime
involves quick pleasure and only the long-term possibility of any cost (getting caught and
punished), it should be highly attractive to them. To test this notion you take a random sample of
120 people, you give them a personality test that includes a measure of impulsivity. Based on
this test, you divide your sample into two groups: (1) the non-impulsive group (n = 80) and, (2)
the impulsive group (n = 40). You then ask each person to report the number of criminal offenses
they have committed in the last year. Finally, you calculate the mean number of self-reported
offenses for each group, and here is the data you get:
Impulsive Non-Impulsive
n1 = 40 n2 = 80
¯X1 = 13.5 ¯X2 = 10.3
s1 = 4.9 s2 = 4.0
a) What are the independent and dependent variables in your study? How are they measured
(nominal, ordinal, interval, ratio)?
Answer: IV: Impulsivity - Nominal
DV: Number of criminal offences - Ratio
b) Test the null hypothesis that there is no difference between the two groups versus the
alternative hypothesis that those who are impulsive commit more criminal offenses. Use
an alpha of .01 and assume that the two population standard deviations are equal (σ1 = σ2),
and make sure to properly interpret your results.
Answer:
Step 1:
H0: μ1 = μ2 (There is no difference between the two groups)
HA: μ1 > μ2 (Those who are impulsive commit more criminal
offenses)
Step 2:
This is right-tailed test.
Step 3: α = 0.01
1
tabler-icon-diamond-filled.svg

Paraphrase This Document

Need a fresh take? Get an instant paraphrase of this document with our AI Paraphraser
Document Page
df = (n1 – 1) + (n2 – 1) = n1 + n2 – 2 = 40 + 80 – 2 = 118
tcrit = t0.01, 118 = 2.358
Reject the Null if the test statistic is greater than the tcrit
Step 4:
tobt= ¯X1 ¯X2
( ( n11 ) s12+( n21)s22
n1+ n22 ) ( n1+n2
n1n2 )
=
13.510.3
( ( 401 ) 4.92+ ( 801 ) 4.02
40+802 ) ( 40+80
4080 )
=
3.2
( 936.39+1264
118 )( 120
3200 ) = 3.2
( 4.318 ) ( 0.194 )
= 3.2
0.8377 = 3.820
Step 5: We reject the null hypothesis because the test statistic is 3.820 > 2.358. Therefore, we
can conclude that there is sufficient statistical evidence, at 1% significance level, to support
the claim that that those who are impulsive commit more criminal offenses.
2
Document Page
2. The following data show the number of unsafe needles used per week for a group of 7 heroin
users before and after an AIDS education program. Your data is presented below.
Person Before
x1
After
x2
xD = x2 x1 xD ¯X D ( xD ¯X D )2
1 2 2 0 .428 .183
2 3 2 -1 -.572 .327
3 1 2 1 1.428 2.039
4 2 0 -2 -1.572 2.471
5 1 1 0 .428 .183
6 2 1 -1 -.572 .327
7 1 1 0 .428 .183
Total = 3 Total = 5.71
¯X D= xD
n =3
7 =0 . 428
s D= ( xD ¯X D )2
n1 = 5 .71
6 = 0 . 9157=0. 9756
a) What are the independent and dependent variables in your study? How are they measured
(nominal, ordinal, interval, ratio)?
Answer: IV: AIDS education program - nominal
DV: number of unsafe needles used per week – ratio
b) Test the null hypothesis that the mean number of unsafe needles used after the education
program is the same as the mean number before the program against the alternative that
the mean number of unsafe needles after the program is less than the mean number before
the program. Use an alpha of 0.05 and interpret your results.
Answer:
Step 1:
H0: μd = 0
HA: μd < ¿ 0
3
Document Page
Step 2:
This is a left-tailed test.
Step 3:
α = 0.05
df = (n – 1) = 7 – 1 = 6
tcrit = t0.05, 6 = −1.943
Reject the null hypothesis if the test statistics smaller than −1.943
Step 4:
tobt= ¯X DμD
sD
n
= 0.4280
0.9756
7 =
0.428
0.3687 = -1.1608
Step 5:
The test statistics is greater than the critical value; -1.1608 > -1.943. The decision is to fail to
reject the null hypothesis. Therefore, we can conclude that at 95% confidence level, there is
sufficient statistical evidence to show that the mean number of unsafe needles used after the
education program is the same as the mean number before the program.
4
chevron_up_icon
1 out of 4
circle_padding
hide_on_mobile
zoom_out_icon
[object Object]