Statistics Home Exercise: Hypothesis Testing and T-tests

Verified

Added on  2022/08/15

|6
|401
|19
Homework Assignment
AI Summary
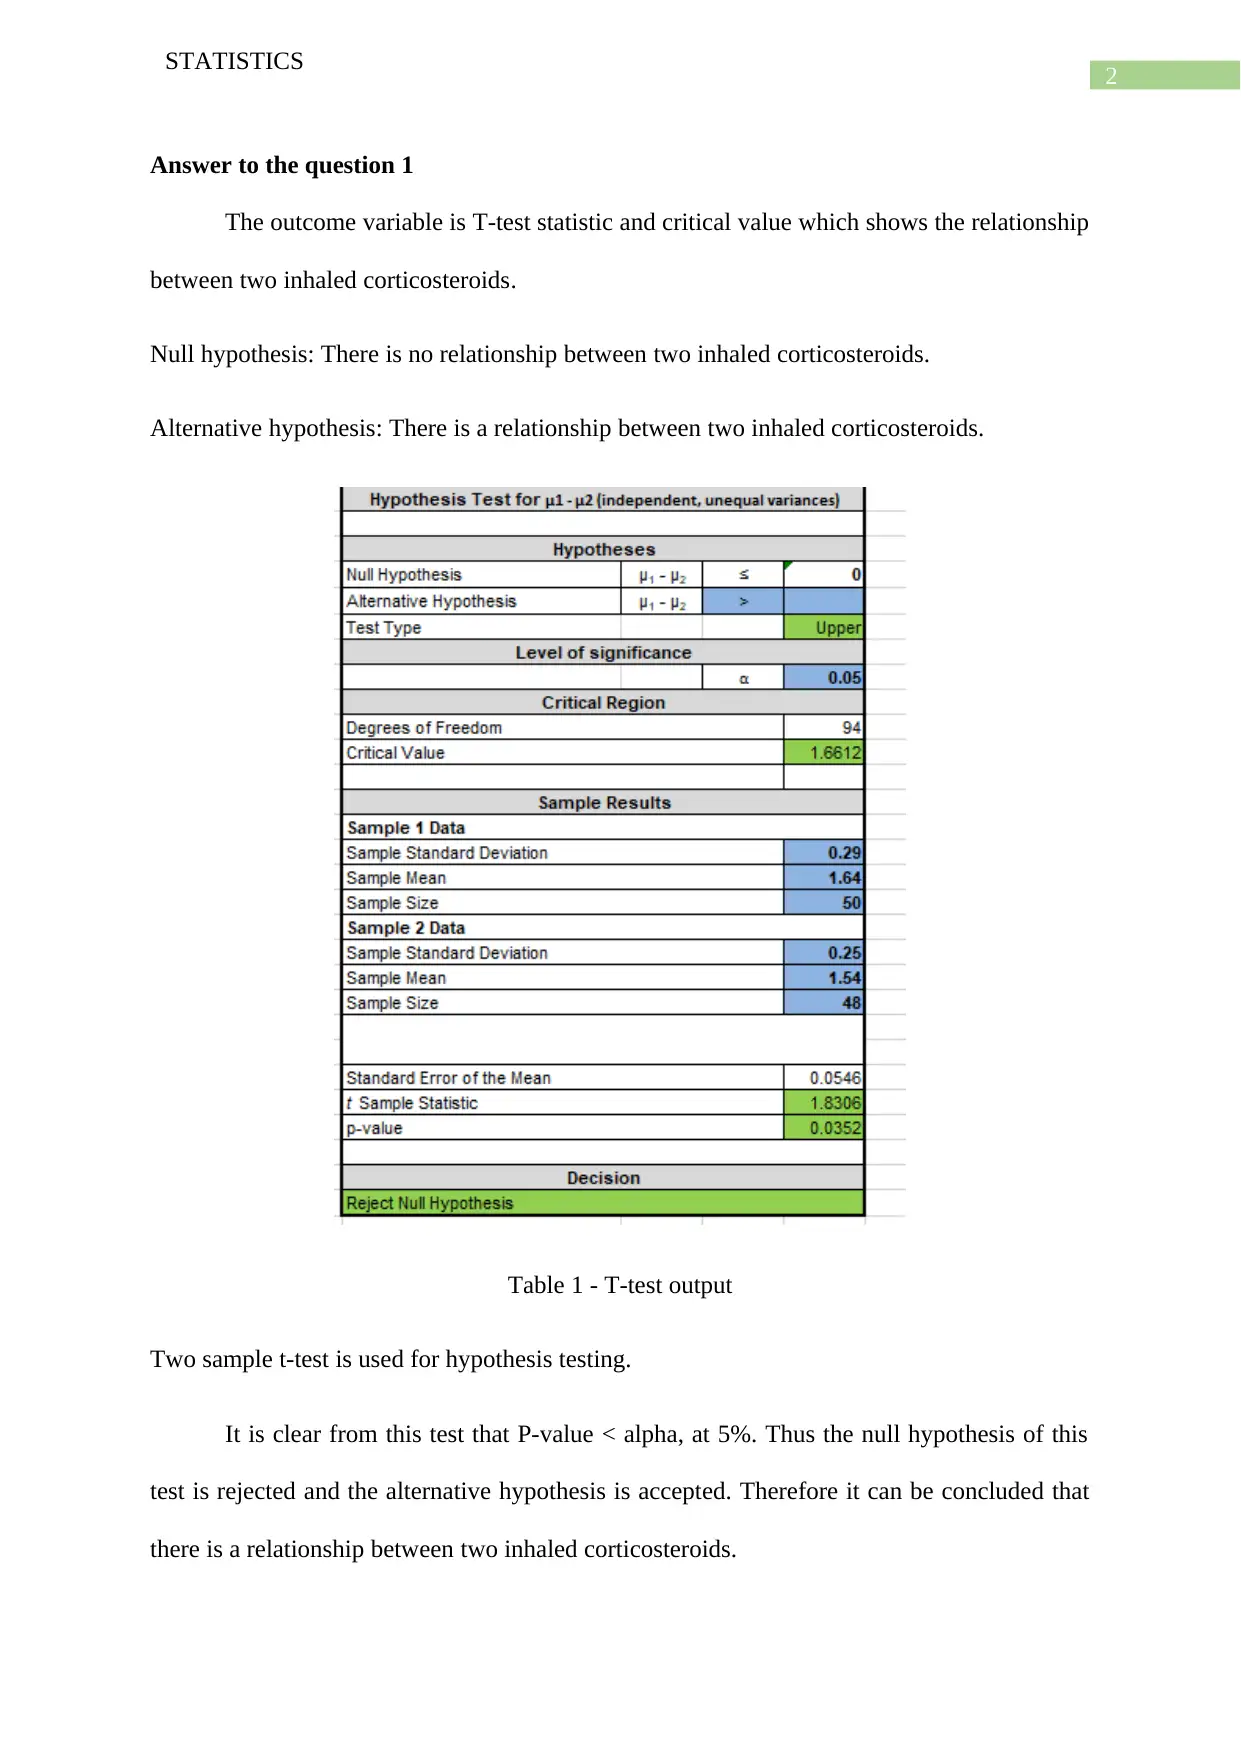
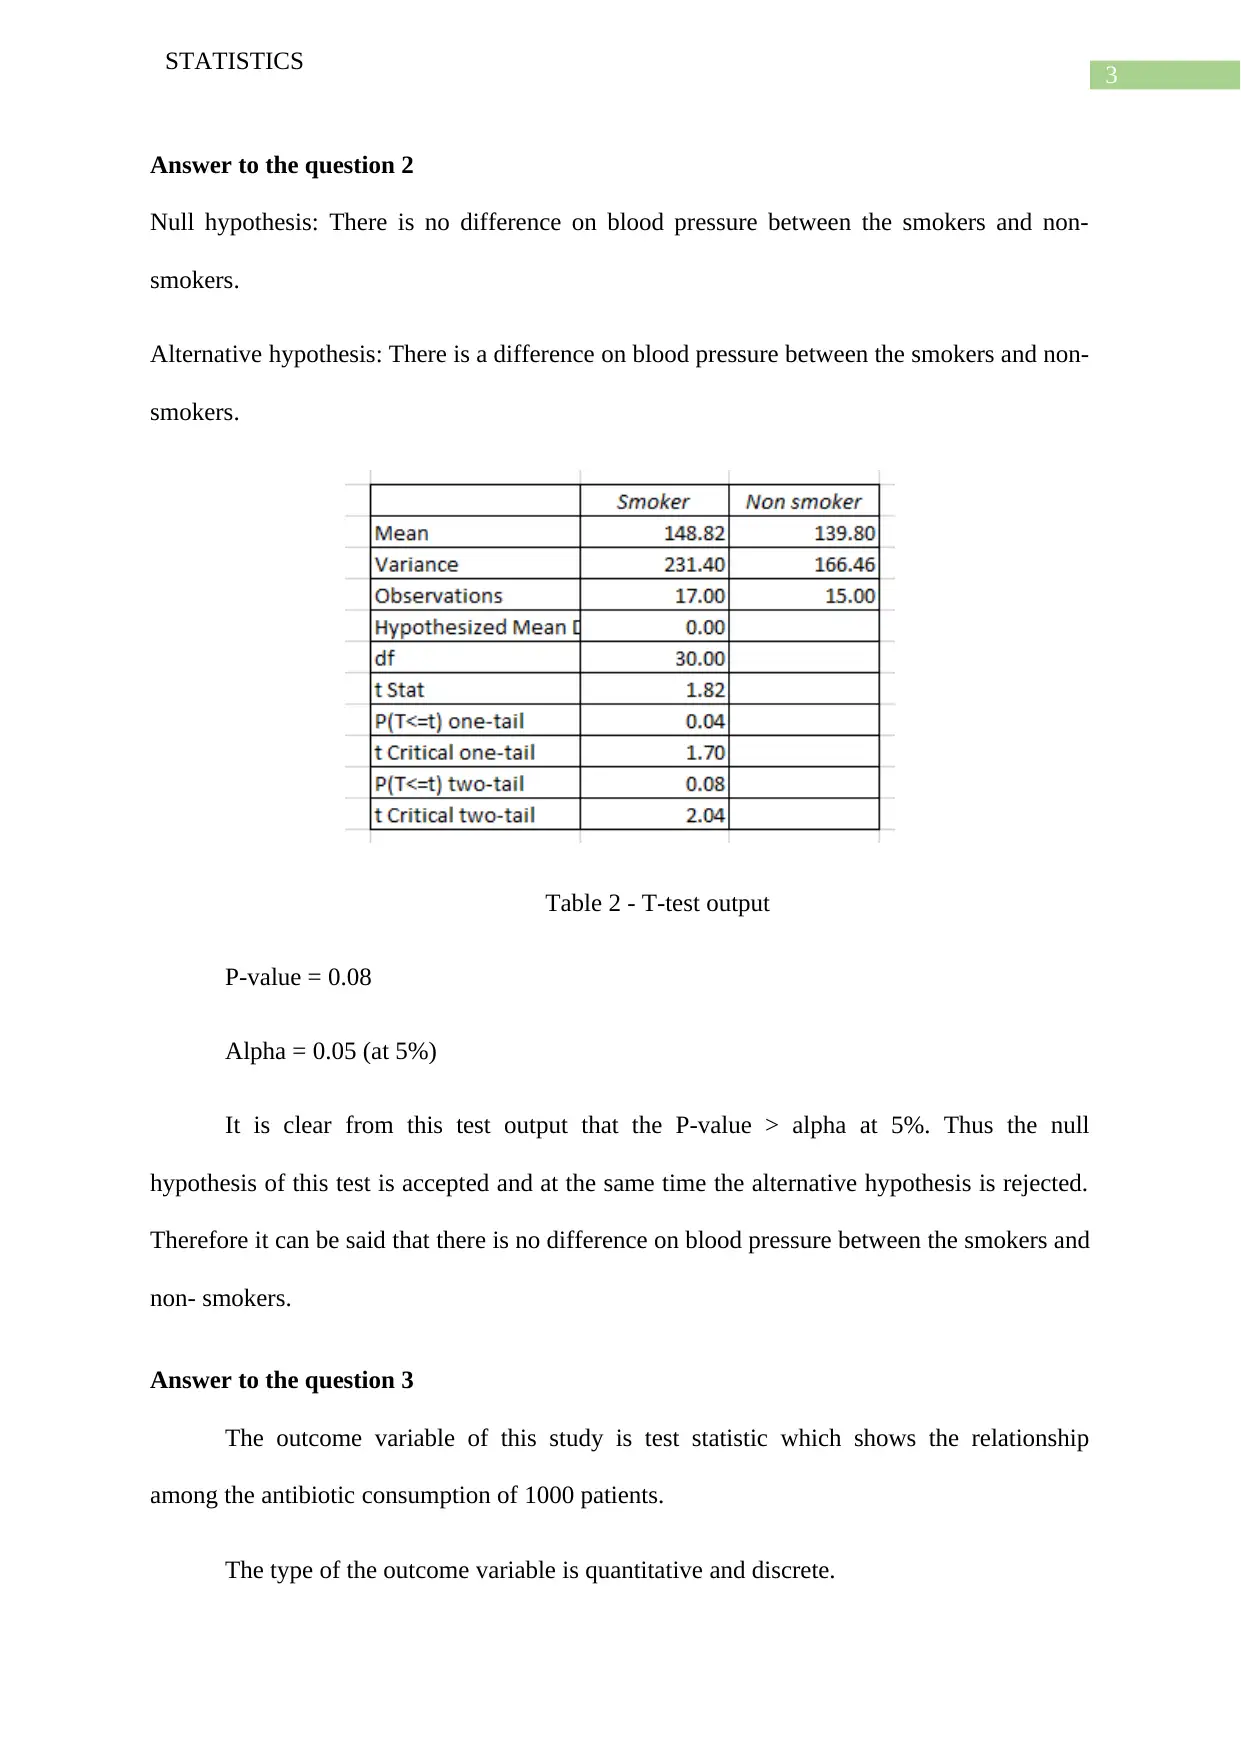
This document presents a solved homework assignment on statistics, addressing key concepts such as hypothesis testing, t-tests, and ANOVA. The assignment analyzes data from two exercises. The first exercise compares the effects of two inhaled corticosteroids using a t-test, outlining the null and alternative hypotheses and concluding that there is a relationship between the corticosteroids. The second exercise examines blood pressure differences between smokers and non-smokers using a t-test, concluding that there is no significant difference. The third question uses ANOVA to determine the relationship between covariates like hospital type (public/private) and antibiotic consumption. The assignment includes the test outputs and the conclusion based on the p-values and alpha levels, providing a clear understanding of statistical analysis and its application in different scenarios. The assignment is a great example of how to analyze data and draw conclusions using statistical methods.
Document Page
Running head: STATISTICS
Statistics
Name of the Student:
Name of the University:
Author note:
tabler-icon-diamond-filled.svg

Paraphrase This Document

Need a fresh take? Get an instant paraphrase of this document with our AI Paraphraser
Document Page
1
STATISTICS
Table of Contents
Answer to the question 1............................................................................................................2
Answer to the question 2............................................................................................................3
Answer to the question 3............................................................................................................4
Bibliography...............................................................................................................................5
Document Page
2
STATISTICS
Answer to the question 1
The outcome variable is T-test statistic and critical value which shows the relationship
between two inhaled corticosteroids.
Null hypothesis: There is no relationship between two inhaled corticosteroids.
Alternative hypothesis: There is a relationship between two inhaled corticosteroids.
Table 1 - T-test output
Two sample t-test is used for hypothesis testing.
It is clear from this test that P-value < alpha, at 5%. Thus the null hypothesis of this
test is rejected and the alternative hypothesis is accepted. Therefore it can be concluded that
there is a relationship between two inhaled corticosteroids.
Document Page
3
STATISTICS
Answer to the question 2
Null hypothesis: There is no difference on blood pressure between the smokers and non-
smokers.
Alternative hypothesis: There is a difference on blood pressure between the smokers and non-
smokers.
Table 2 - T-test output
P-value = 0.08
Alpha = 0.05 (at 5%)
It is clear from this test output that the P-value > alpha at 5%. Thus the null
hypothesis of this test is accepted and at the same time the alternative hypothesis is rejected.
Therefore it can be said that there is no difference on blood pressure between the smokers and
non- smokers.
Answer to the question 3
The outcome variable of this study is test statistic which shows the relationship
among the antibiotic consumption of 1000 patients.
The type of the outcome variable is quantitative and discrete.
tabler-icon-diamond-filled.svg

Paraphrase This Document

Need a fresh take? Get an instant paraphrase of this document with our AI Paraphraser
Document Page
4
STATISTICS
The covariates are public non-teaching and private hospitals. The type of the
covariates is categorical and quantitative.
To show the relationship between covariates and antibiotic consumption the ANOVA
test has been applied.
Document Page
5
STATISTICS
Bibliography
De Winter, J.C., 2013. Using the Student's t-test with extremely small sample sizes. Practical
Assessment, Research, and Evaluation, 18(1), p.10.
Gelbach, J.B., 2016. When do covariates matter? And which ones, and how much?. Journal
of Labor Economics, 34(2), pp.509-543.
chevron_up_icon
1 out of 6
circle_padding
hide_on_mobile
zoom_out_icon
[object Object]