BTM-8107 Statistics II: Reflection & MANOVA on Cholesterol Drugs
VerifiedAdded on 2023/06/15
|10
|1729
|105
Practical Assignment
AI Summary
This assignment focuses on applying MANOVA to analyze the effectiveness of different drugs in controlling cholesterol levels, specifically low-density lipoprotein (LDL) and high-density lipoprotein (HDL). The study involves a control group and three treatment groups receiving different drugs (A, B, and C). Exploratory data analysis reveals the average LDL and HDL levels among participants. The MANOVA results indicate a significant effect of drug type on cholesterol levels, with post-hoc tests highlighting differences in the performance of Drug B compared to Drugs A and C. The reflection section discusses the importance of correlation, regression, ANOVA, t-tests, and non-parametric tests covered in the course and emphasizes the need for case studies to improve problem identification skills in real-world applications. Desklib provides a platform to explore similar assignments and resources for students.

Running Head: APPLICATION OF MANOVA AND REFLECTION STUDY
Application of Manova and Reflection Study
Name of the Student
Name of the University
Author Note
Application of Manova and Reflection Study
Name of the Student
Name of the University
Author Note
Paraphrase This Document
Need a fresh take? Get an instant paraphrase of this document with our AI Paraphraser
1APPLICATION OF MANOVA AND REFLECTION STUDY
Table of Contents
Part A...............................................................................................................................................2
Exploratory Data Analysis...........................................................................................................2
MANOVA Analysis....................................................................................................................4
Part B: Reflection............................................................................................................................6
References........................................................................................................................................9
2APPLICATION OF MANOVA AND REFLECTION STUDY
Part A
The aim of this research is to examine which drug is better to improve the cholesterol
levels. The data contains low-density lipoprotein (LDL) and high-density lipoprotein (HDL) for
a control group and three other groups who have been treated with three different types of drugs,
Drugs A, B and C. To test the version of the drug that shows the most promise in controlling
cholesterol, MANOVA test has to be conducted (Meyers, Gamst & Guarino, 2016).
Exploratory Data Analysis
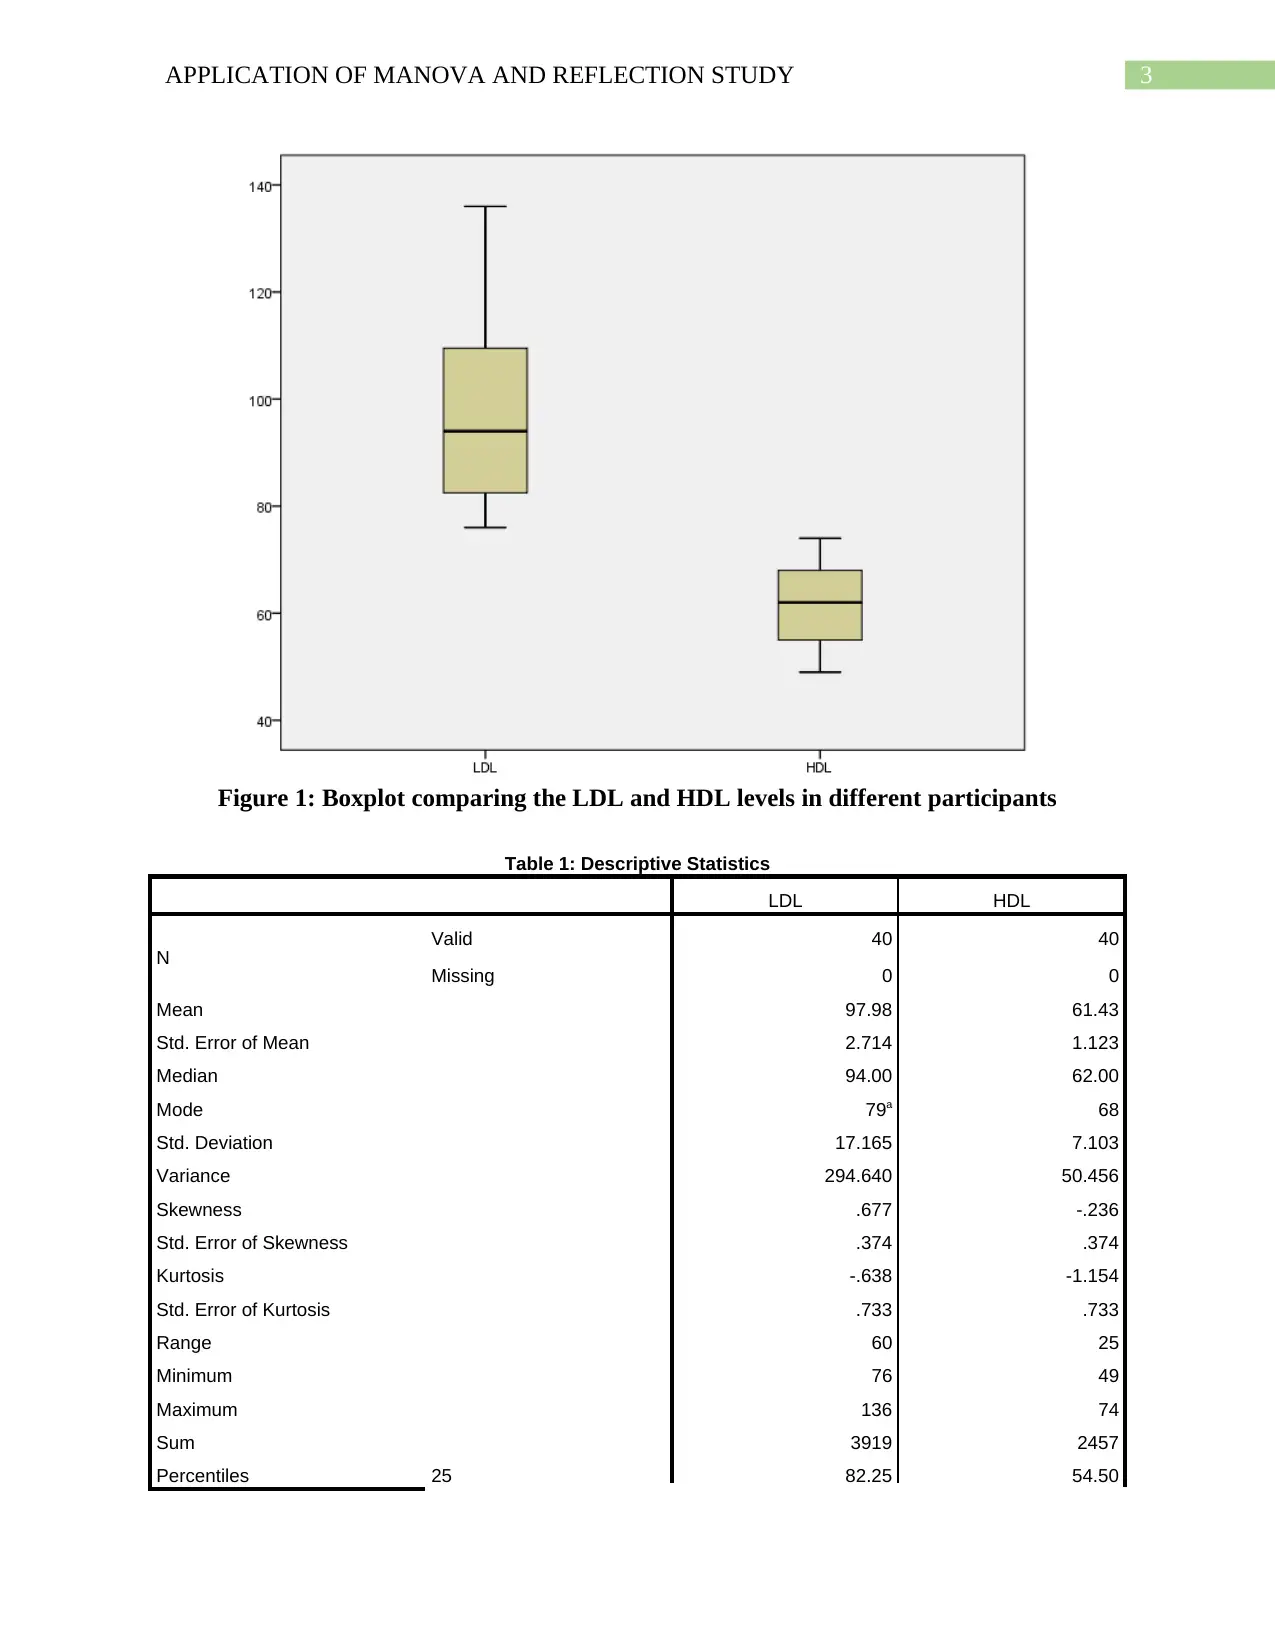
From the exploratory analysis of the data, it can be seen that the average level of the bad
cholesterol (LDL) is 97.98 which is less than the level of 100 with a standard deviation of 17.165
which is quite less. Thus, the bad cholesterol level is close to the mean level for most of the
individuals. Thus, it is at a better stage. The average level of good cholesterol is 61.43 with a
standard deviation of 7.103 which is also very less. Thus, most people have a good cholesterol
level close to the mean level which is higher than 60. Thus, the cholesterol levels are under
control for most of the participants of the study (Holcomb, 2016).
Part A
The aim of this research is to examine which drug is better to improve the cholesterol
levels. The data contains low-density lipoprotein (LDL) and high-density lipoprotein (HDL) for
a control group and three other groups who have been treated with three different types of drugs,
Drugs A, B and C. To test the version of the drug that shows the most promise in controlling
cholesterol, MANOVA test has to be conducted (Meyers, Gamst & Guarino, 2016).
Exploratory Data Analysis
From the exploratory analysis of the data, it can be seen that the average level of the bad
cholesterol (LDL) is 97.98 which is less than the level of 100 with a standard deviation of 17.165
which is quite less. Thus, the bad cholesterol level is close to the mean level for most of the
individuals. Thus, it is at a better stage. The average level of good cholesterol is 61.43 with a
standard deviation of 7.103 which is also very less. Thus, most people have a good cholesterol
level close to the mean level which is higher than 60. Thus, the cholesterol levels are under
control for most of the participants of the study (Holcomb, 2016).
⊘ This is a preview!⊘
Do you want full access?
Subscribe today to unlock all pages.
Trusted by 1+ million students worldwide
3APPLICATION OF MANOVA AND REFLECTION STUDY
Figure 1: Boxplot comparing the LDL and HDL levels in different participants
Table 1: Descriptive Statistics
LDL HDL
N Valid 40 40
Missing 0 0
Mean 97.98 61.43
Std. Error of Mean 2.714 1.123
Median 94.00 62.00
Mode 79a 68
Std. Deviation 17.165 7.103
Variance 294.640 50.456
Skewness .677 -.236
Std. Error of Skewness .374 .374
Kurtosis -.638 -1.154
Std. Error of Kurtosis .733 .733
Range 60 25
Minimum 76 49
Maximum 136 74
Sum 3919 2457
Percentiles 25 82.25 54.50
Paraphrase This Document
Need a fresh take? Get an instant paraphrase of this document with our AI Paraphraser
4APPLICATION OF MANOVA AND REFLECTION STUDY
50 94.00 62.00
75 109.75 68.00
a. Multiple modes exist. The smallest value is shown
MANOVA Analysis
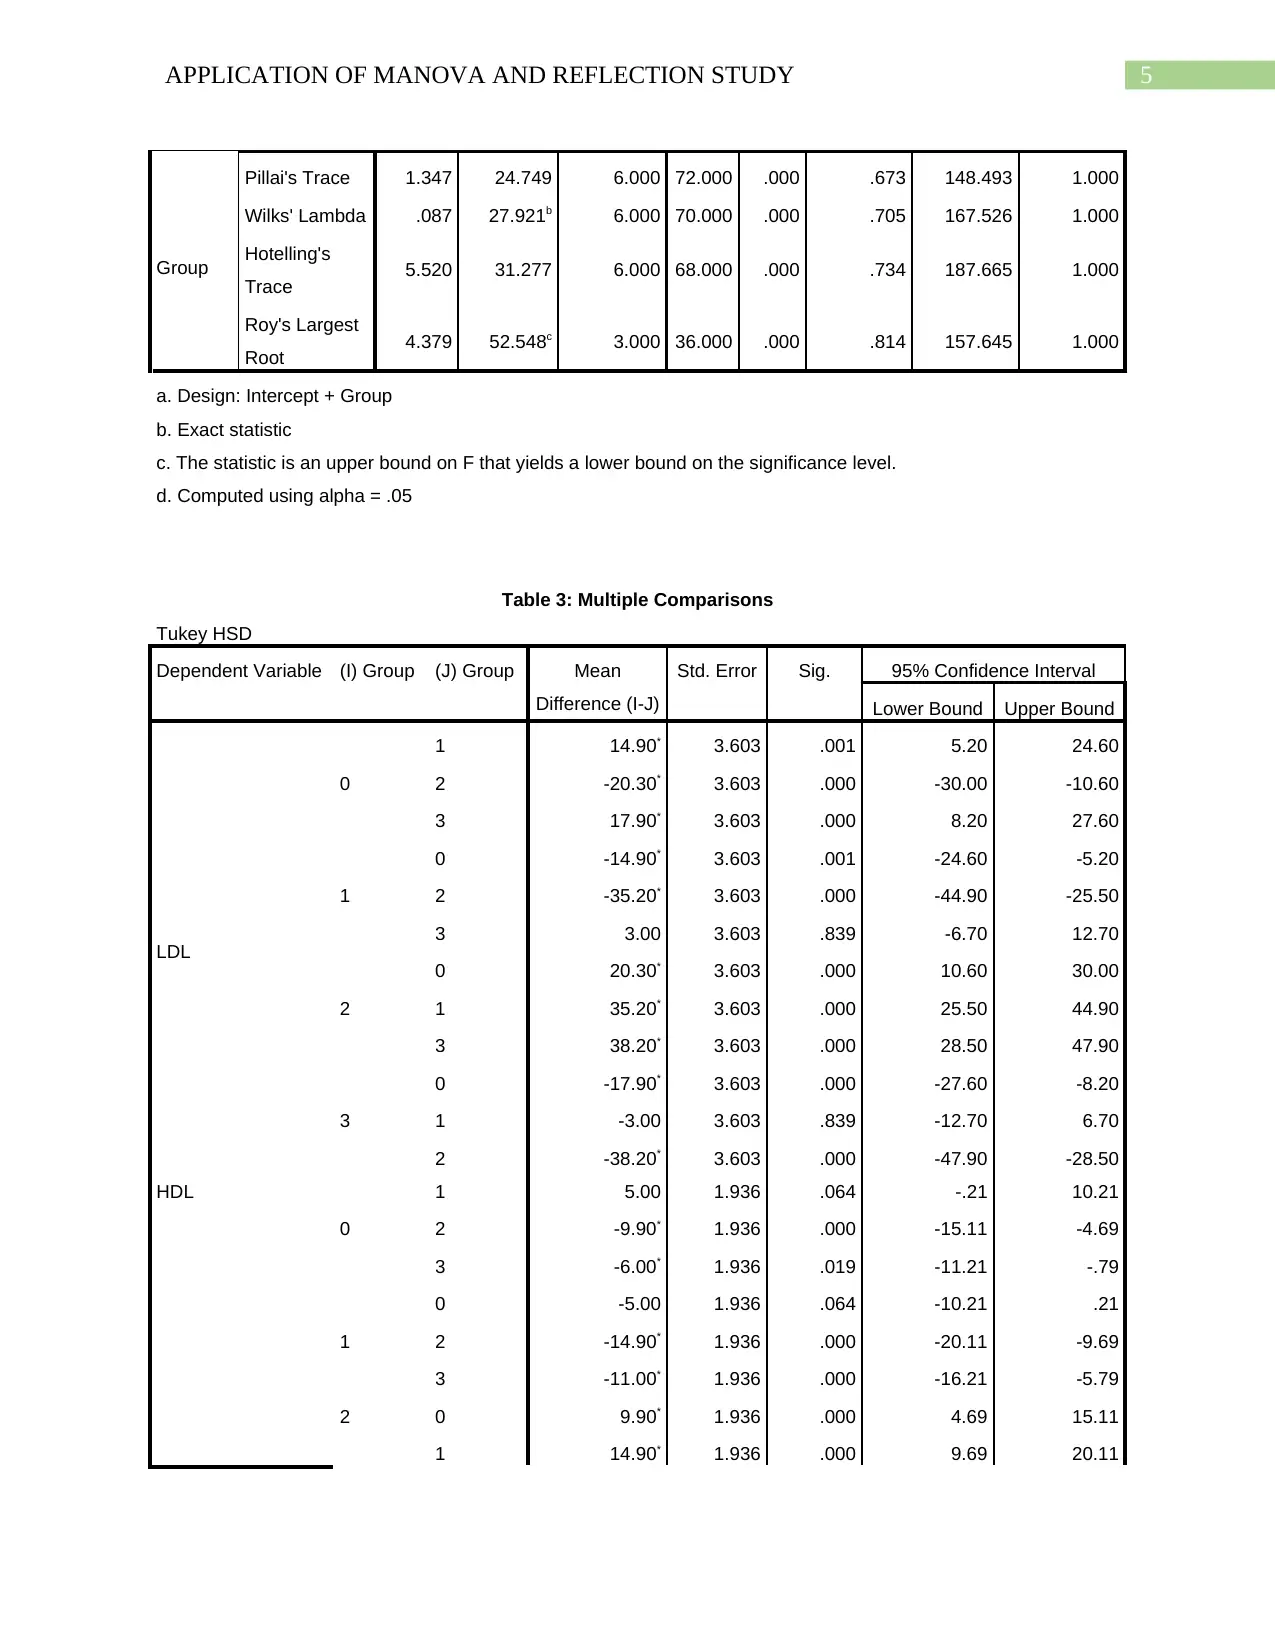
The results obtained as a result of the MANOVA analysis is presented in table 2. It can
be seen that the significance value of the Wilks’ Lambda for groups is 0.000, which is less than
0.05 (p-value for 95 percent level of significance). Thus, it can be said that the MANOVA
analysis is significant. Hence, it can be concluded that the type of drugs has an effect on
controlling the cholesterol levels, that is in controlling the LDL and HDL in an individual.
Further it can be said that there are statistically significant differences between the performance
of the drugs.
In table 3, the effects of different drugs in controlling the cholesterol levels are illustrated.
Post hoc test in MANOVA has been conducted to test the effects. From the significance values
obtained from the results of the post hoc test, it can be said that there is no significant difference
in the performances of drug A and drug C (p-value = 839 > 0.05, level of significance) but
significant difference has been observed between the performances of drug B and drug C (p-
value = 0.000 < 0.05) and also between drug A and drug B (p-value = 0.000 < 0.05).
Table 2: Multivariate Testsa
Effect Value F Hypothesis
df
Error
df
Sig. Partial Eta
Squared
Noncent.
Parameter
Observed
Powerd
Intercept
Pillai's Trace .997 6049.563b 2.000 35.000 .000 .997 12099.125 1.000
Wilks' Lambda .003 6049.563b 2.000 35.000 .000 .997 12099.125 1.000
Hotelling's
Trace 345.689 6049.563b 2.000 35.000 .000 .997 12099.125 1.000
Roy's Largest
Root 345.689 6049.563b 2.000 35.000 .000 .997 12099.125 1.000
50 94.00 62.00
75 109.75 68.00
a. Multiple modes exist. The smallest value is shown
MANOVA Analysis
The results obtained as a result of the MANOVA analysis is presented in table 2. It can
be seen that the significance value of the Wilks’ Lambda for groups is 0.000, which is less than
0.05 (p-value for 95 percent level of significance). Thus, it can be said that the MANOVA
analysis is significant. Hence, it can be concluded that the type of drugs has an effect on
controlling the cholesterol levels, that is in controlling the LDL and HDL in an individual.
Further it can be said that there are statistically significant differences between the performance
of the drugs.
In table 3, the effects of different drugs in controlling the cholesterol levels are illustrated.
Post hoc test in MANOVA has been conducted to test the effects. From the significance values
obtained from the results of the post hoc test, it can be said that there is no significant difference
in the performances of drug A and drug C (p-value = 839 > 0.05, level of significance) but
significant difference has been observed between the performances of drug B and drug C (p-
value = 0.000 < 0.05) and also between drug A and drug B (p-value = 0.000 < 0.05).
Table 2: Multivariate Testsa
Effect Value F Hypothesis
df
Error
df
Sig. Partial Eta
Squared
Noncent.
Parameter
Observed
Powerd
Intercept
Pillai's Trace .997 6049.563b 2.000 35.000 .000 .997 12099.125 1.000
Wilks' Lambda .003 6049.563b 2.000 35.000 .000 .997 12099.125 1.000
Hotelling's
Trace 345.689 6049.563b 2.000 35.000 .000 .997 12099.125 1.000
Roy's Largest
Root 345.689 6049.563b 2.000 35.000 .000 .997 12099.125 1.000
5APPLICATION OF MANOVA AND REFLECTION STUDY
Group
Pillai's Trace 1.347 24.749 6.000 72.000 .000 .673 148.493 1.000
Wilks' Lambda .087 27.921b 6.000 70.000 .000 .705 167.526 1.000
Hotelling's
Trace 5.520 31.277 6.000 68.000 .000 .734 187.665 1.000
Roy's Largest
Root 4.379 52.548c 3.000 36.000 .000 .814 157.645 1.000
a. Design: Intercept + Group
b. Exact statistic
c. The statistic is an upper bound on F that yields a lower bound on the significance level.
d. Computed using alpha = .05
Table 3: Multiple Comparisons
Tukey HSD
Dependent Variable (I) Group (J) Group Mean
Difference (I-J)
Std. Error Sig. 95% Confidence Interval
Lower Bound Upper Bound
LDL
0
1 14.90* 3.603 .001 5.20 24.60
2 -20.30* 3.603 .000 -30.00 -10.60
3 17.90* 3.603 .000 8.20 27.60
1
0 -14.90* 3.603 .001 -24.60 -5.20
2 -35.20* 3.603 .000 -44.90 -25.50
3 3.00 3.603 .839 -6.70 12.70
2
0 20.30* 3.603 .000 10.60 30.00
1 35.20* 3.603 .000 25.50 44.90
3 38.20* 3.603 .000 28.50 47.90
3
0 -17.90* 3.603 .000 -27.60 -8.20
1 -3.00 3.603 .839 -12.70 6.70
2 -38.20* 3.603 .000 -47.90 -28.50
HDL
0
1 5.00 1.936 .064 -.21 10.21
2 -9.90* 1.936 .000 -15.11 -4.69
3 -6.00* 1.936 .019 -11.21 -.79
1
0 -5.00 1.936 .064 -10.21 .21
2 -14.90* 1.936 .000 -20.11 -9.69
3 -11.00* 1.936 .000 -16.21 -5.79
2 0 9.90* 1.936 .000 4.69 15.11
1 14.90* 1.936 .000 9.69 20.11
⊘ This is a preview!⊘
Do you want full access?
Subscribe today to unlock all pages.
Trusted by 1+ million students worldwide
6APPLICATION OF MANOVA AND REFLECTION STUDY
3 3.90 1.936 .202 -1.31 9.11
3
0 6.00* 1.936 .019 .79 11.21
1 11.00* 1.936 .000 5.79 16.21
2 -3.90 1.936 .202 -9.11 1.31
Based on observed means.
The error term is Mean Square(Error) = 18.742.
*. The mean difference is significant at the .05 level.
Part B: Reflection
A lot of topics have been covered in the last 8 weeks. The topics that have been covered
are:
Representation of data
Distribution of the variables
Correlation and Regression
ANOVA and t-test
ANCOVA and Factorial ANOVA
Repeated measures ANOVA
Non-Parametric tests
MANOVA
Among all these topics, the most important three topics according to me would be
correlation and regression, ANOVA and t-test and non-parametric tests. I would prefer to say
these three concepts as the most important concepts as these are the most basic concepts of
statistics that are implemented in real life to compare data. All the factors covered in the 8 weeks
are quite important, but these are the most basic and hence most important to understand. All the
other measures such as ANCOVA, factorial ANOVA, repeated measures ANOVA and
Paraphrase This Document
Need a fresh take? Get an instant paraphrase of this document with our AI Paraphraser
7APPLICATION OF MANOVA AND REFLECTION STUDY
MANOVA are just extensions of the ANOVA analysis based on the type of variable. Thus, these
will be easy to understand once I have a clear idea of the concept of ANOVA.
Correlation shows comparison of two different variables and regression establishes a
relationship between them (Draper & Smith, 2014). ANOVA and t-test examines the dependence
of one variable on the other (Pituch, Whittaker & Stevens, 2015). In case of ANOVA, there are a
lot of assumptions that are usually considered. In the real life problems, there will be situations
where the assumptions for ANOVA or t-test will not follow. There will be situations where the
data recorded will not follow any type of pattern or distribution and will be completely random.
In cases like this non parametric tests can be applied. Thus, while performing a data analysis for
my dissertation, it is evident that the type of analysis will be conducted by these techniques only
that we have studied in the last 8 weeks. The real challenge will be to apply the right technique in
the right situation.
In this coursework, what we have learned are the statistical techniques that we apply for
the analysis and how we interpret the results that we have obtained from the analysis. I feel that
this has been a great way to learn. During the whole coursework, it was always instructed in the
question which technique has to applied in the current situation given in the question. It is a great
method to learn but this will not be a good method to understand how much we have understood
the concepts and are able to apply them in practical. In real life, while dealing with any
problems, nobody is going to specify us that this is a situation where we have to test the equality
of means of more than two variables. Thus apply ANOVA to solve this problem. IT will there be
a challenge to identify the problem and apply the most appropriate technique to solve that. To
understand whether I am capable of understanding the situations correctly, I think we should be

8APPLICATION OF MANOVA AND REFLECTION STUDY
supplied with different case studies which will help us to learn how to identify a problem and
solve it by ourselves. This case study part should have been covered in the coursework.
supplied with different case studies which will help us to learn how to identify a problem and
solve it by ourselves. This case study part should have been covered in the coursework.
⊘ This is a preview!⊘
Do you want full access?
Subscribe today to unlock all pages.
Trusted by 1+ million students worldwide
9APPLICATION OF MANOVA AND REFLECTION STUDY
References
Holcomb, Z. C. (2016). Fundamentals of descriptive statistics. Routledge.
Meyers, L. S., Gamst, G., & Guarino, A. J. (2016). Applied multivariate research: Design and
interpretation. Sage publications.
Draper, N. R., & Smith, H. (2014). Applied regression analysis (Vol. 326). John Wiley & Sons.
Pituch, K. A., Whittaker, T. A., & Stevens, J. P. (2015). Intermediate statistics: A modern
approach. Routledge.
1 out of 10

Your All-in-One AI-Powered Toolkit for Academic Success.
+13062052269
info@desklib.com
Available 24*7 on WhatsApp / Email
![[object Object]](/_next/static/media/star-bottom.7253800d.svg)
Unlock your academic potential
Copyright © 2020–2026 A2Z Services. All Rights Reserved. Developed and managed by ZUCOL.