BTM-8107: T-Tests and ANOVA Analysis - Statistics II at NCU
VerifiedAdded on 2023/06/15
|11
|1311
|299
Homework Assignment
AI Summary
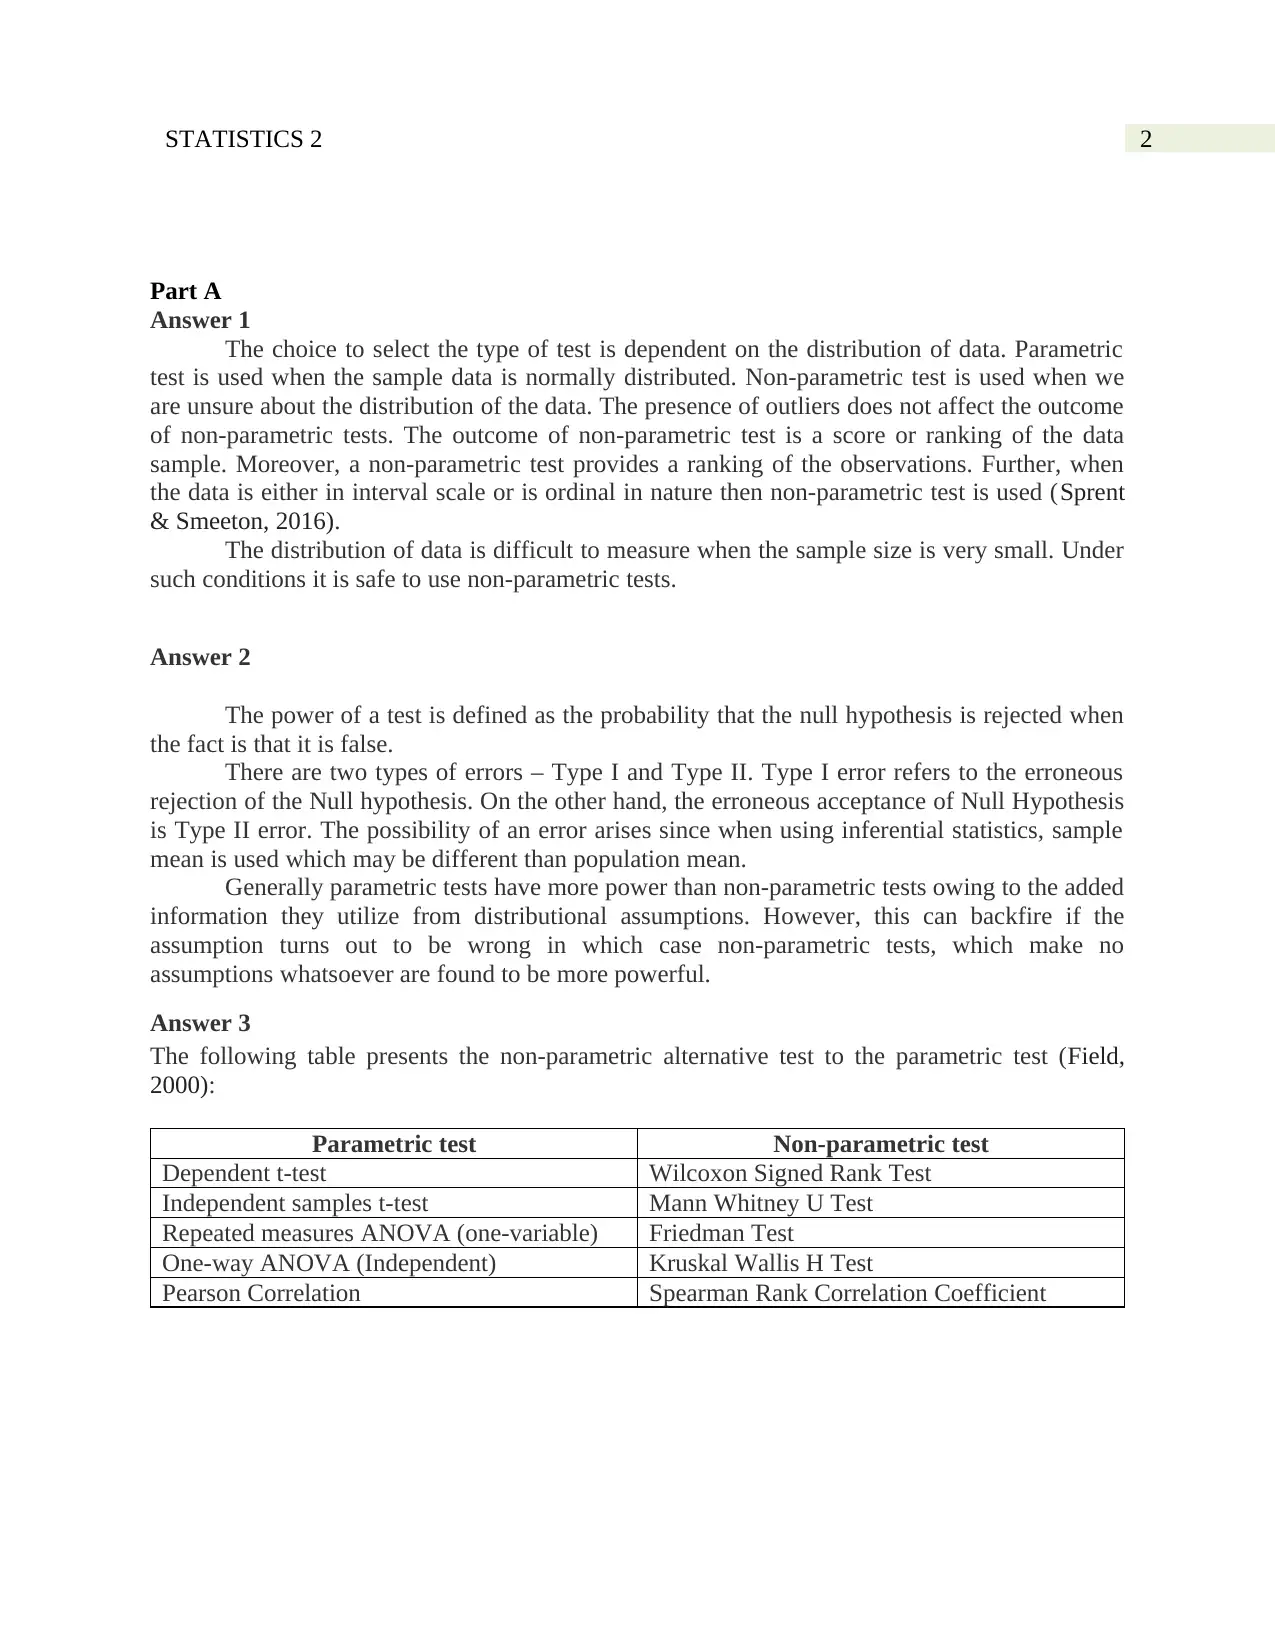
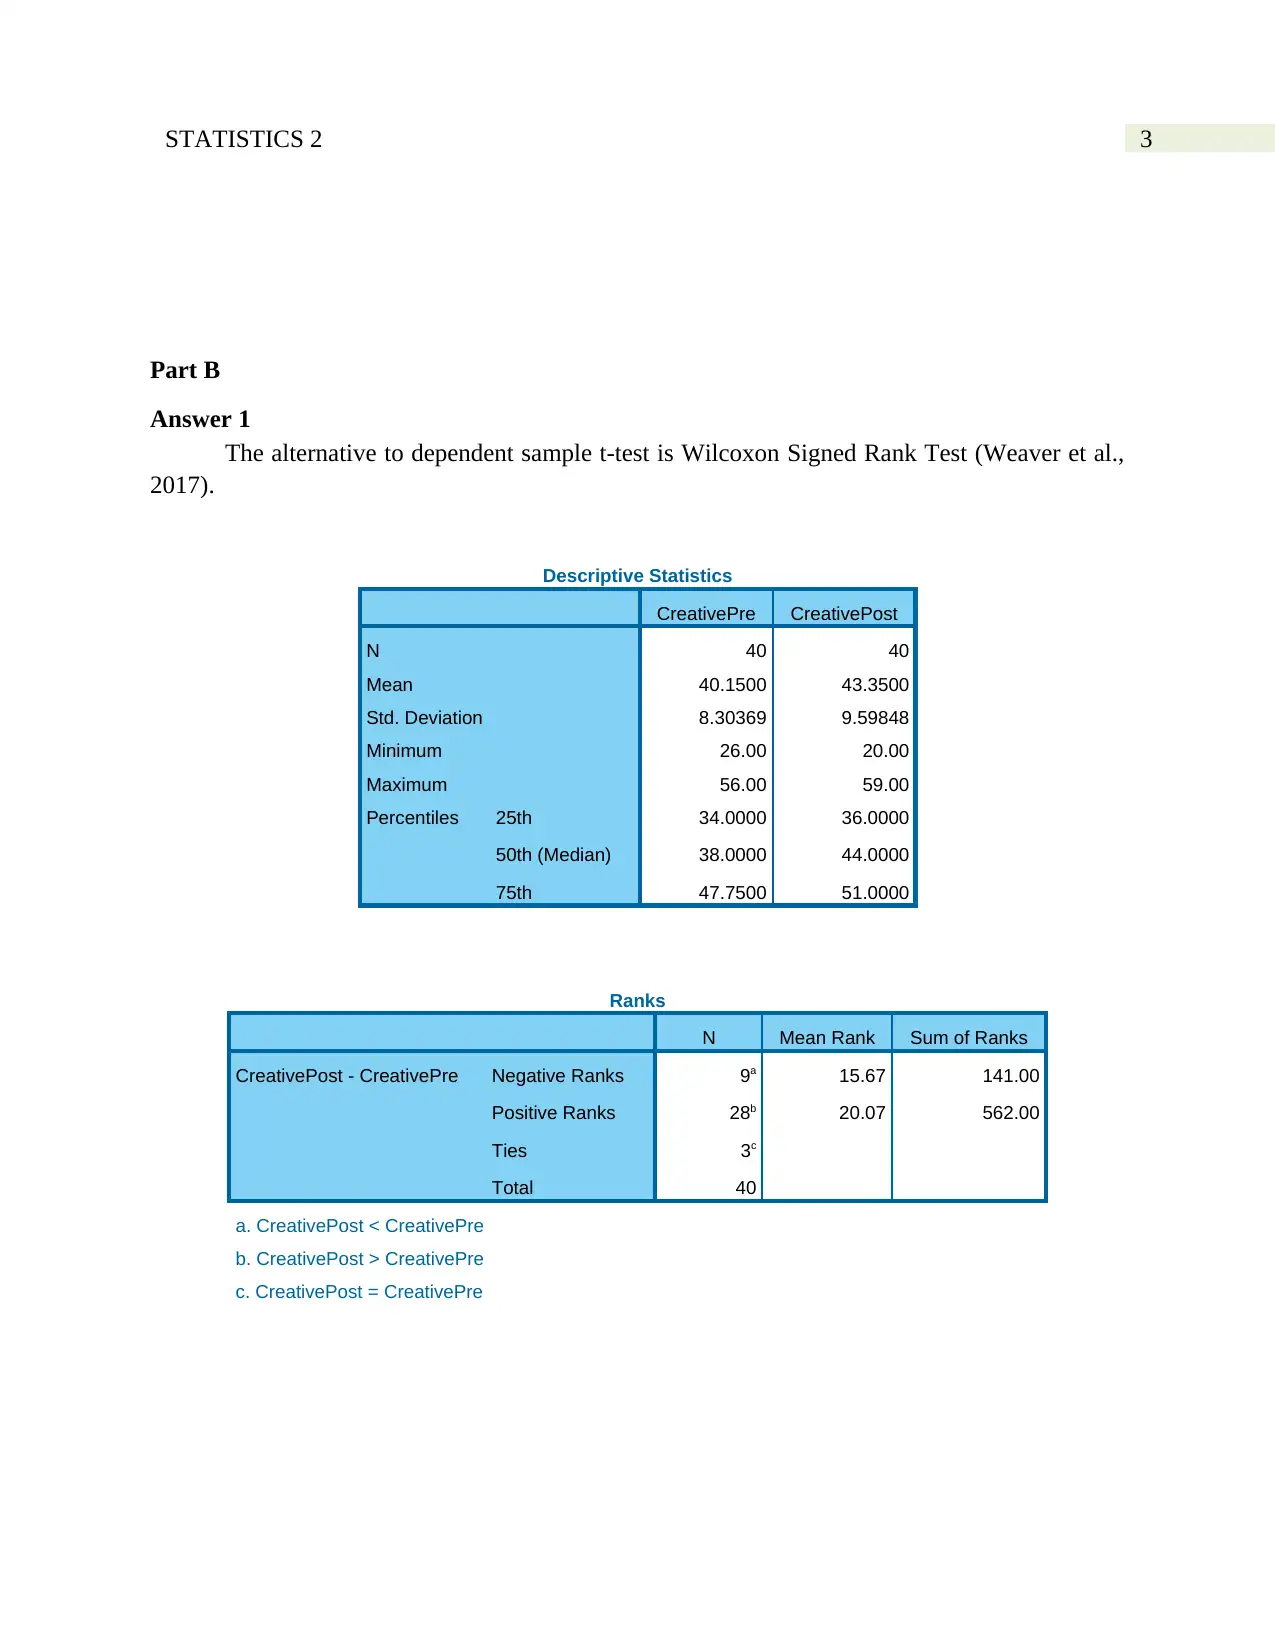
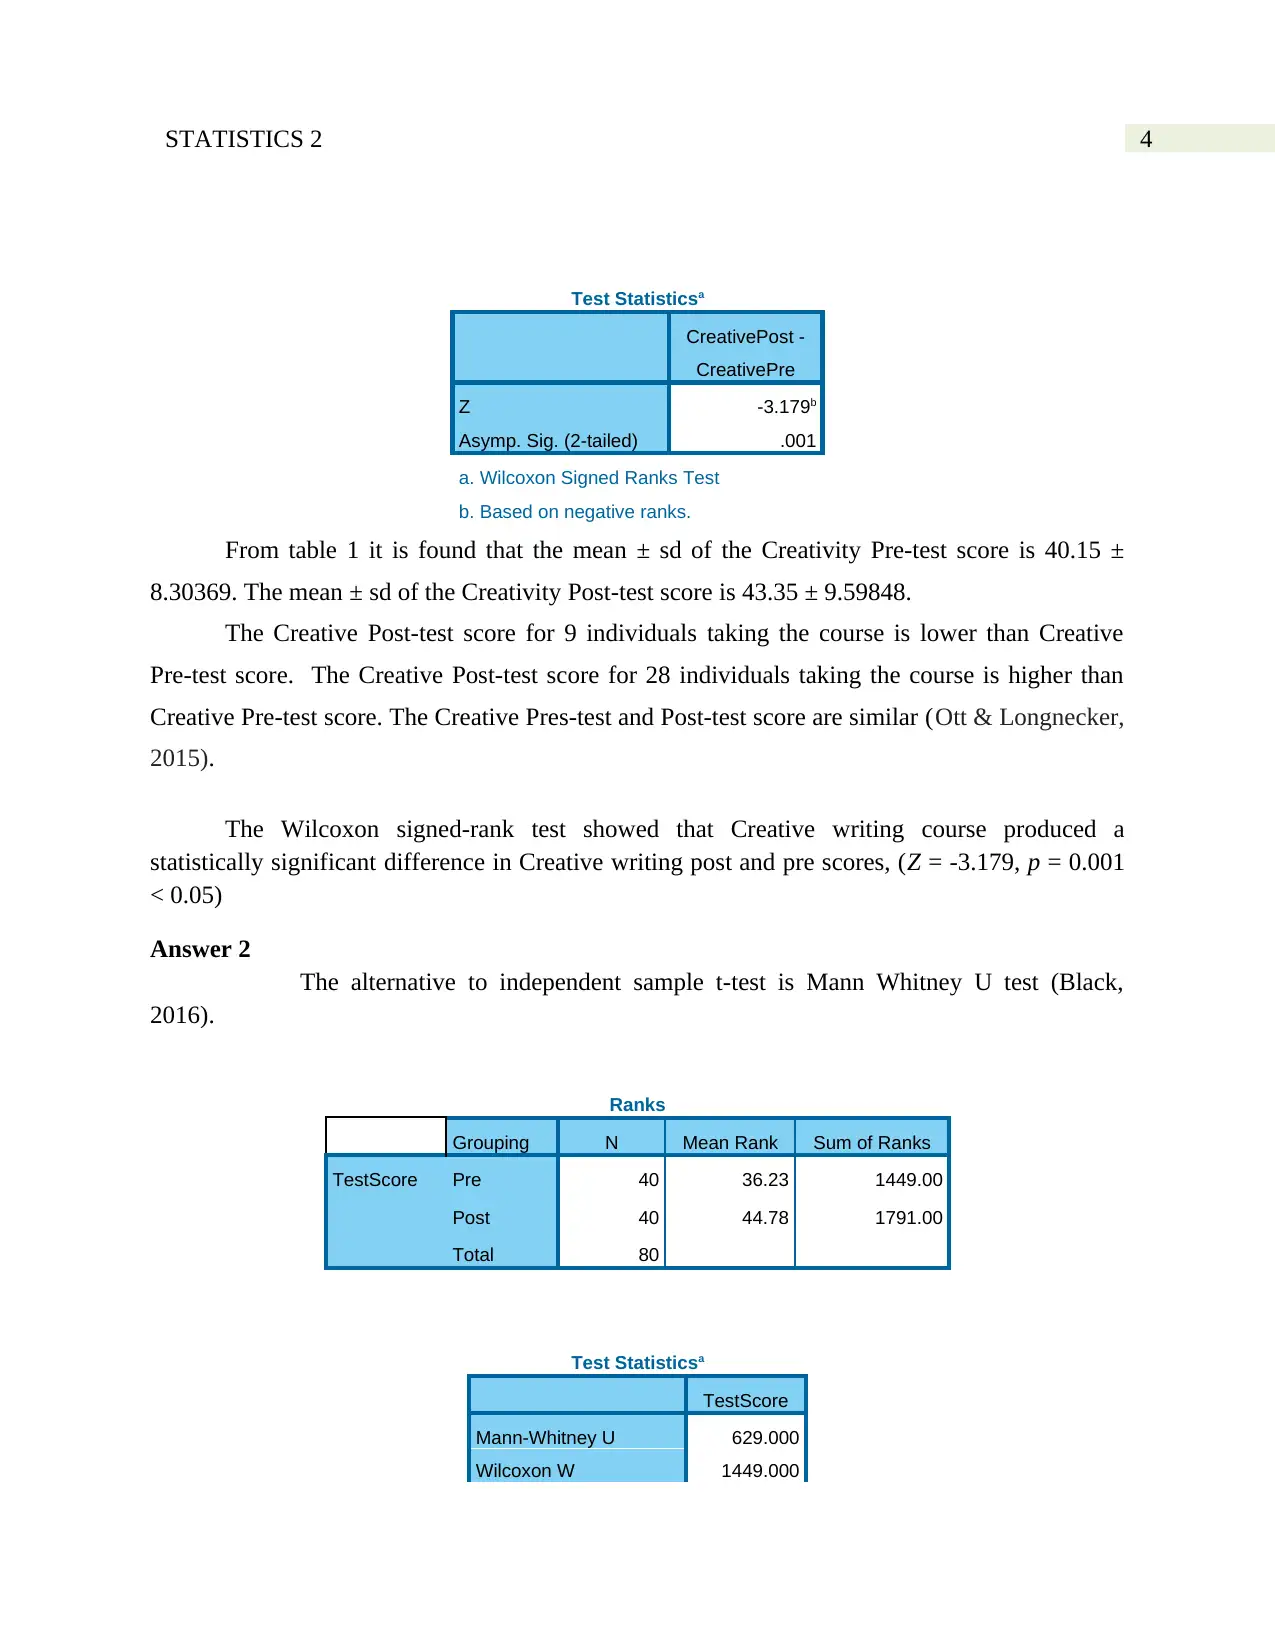
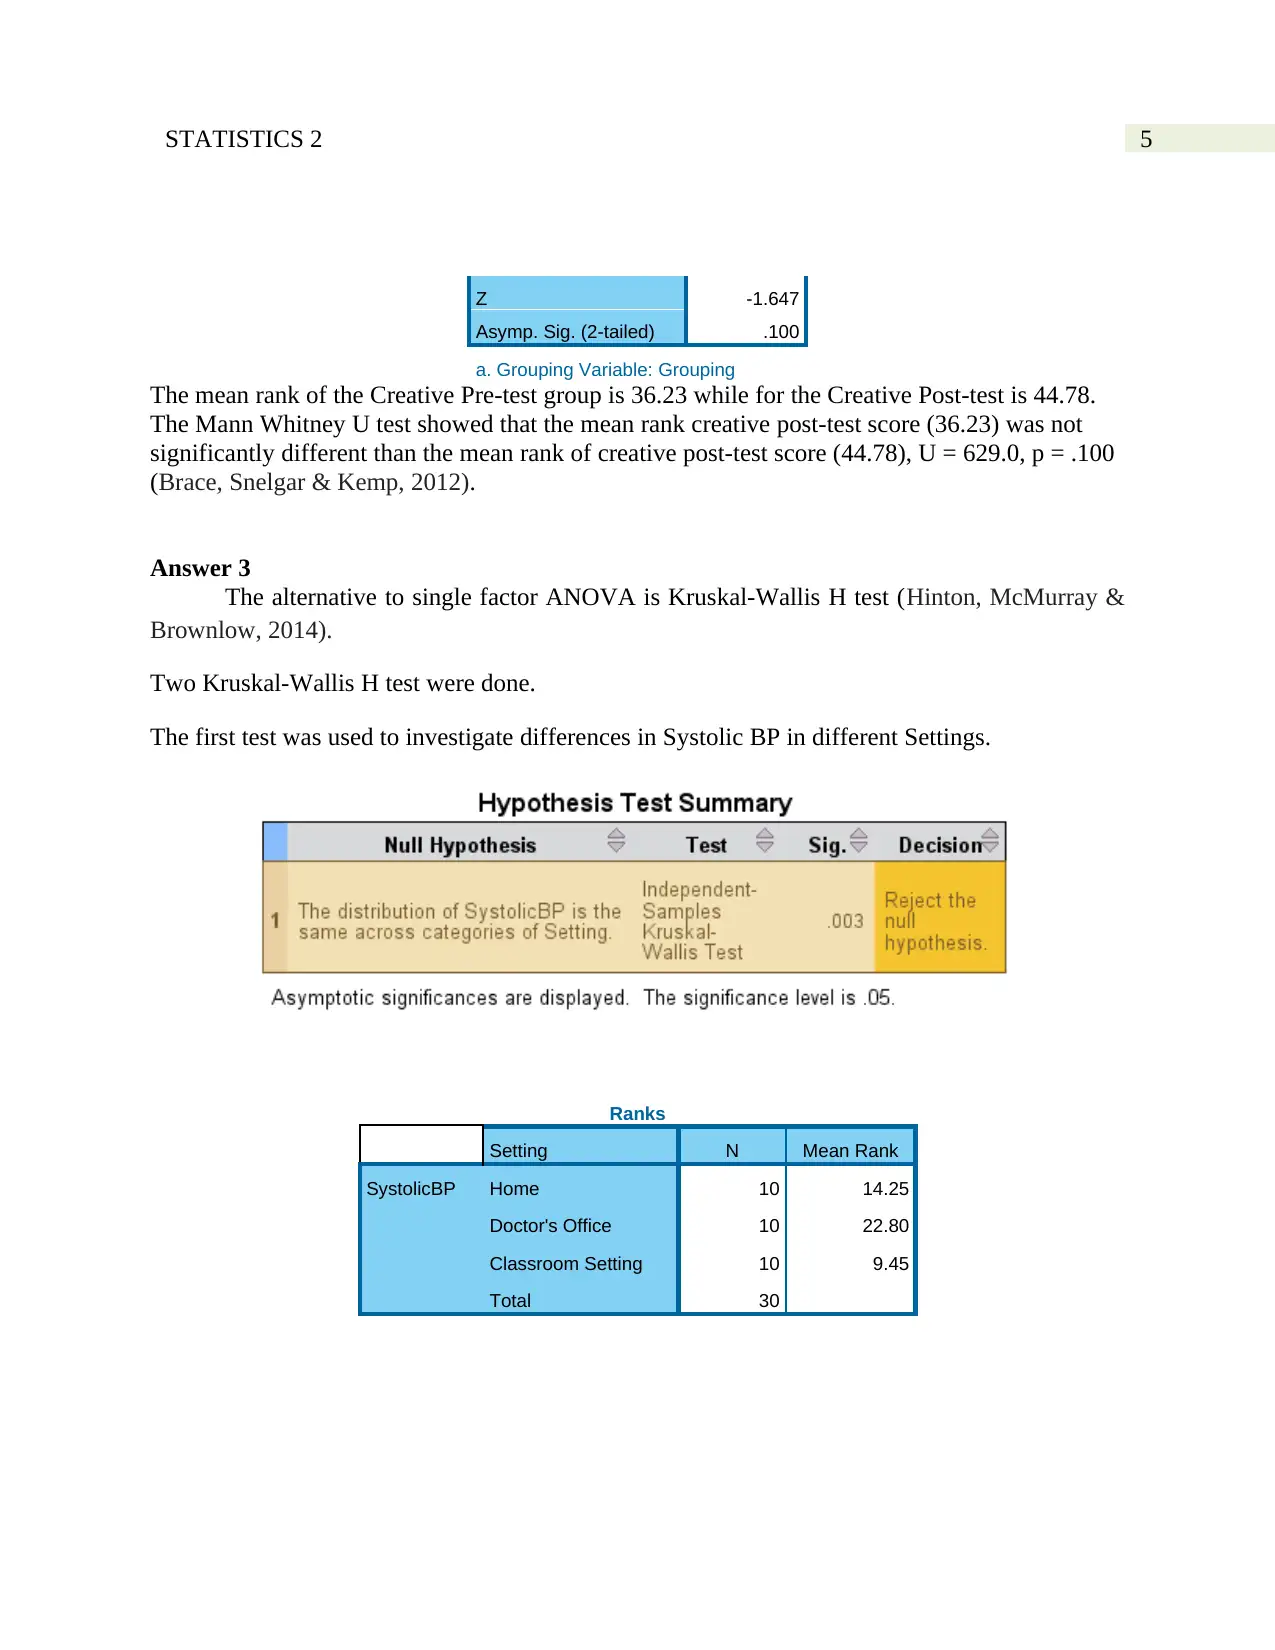
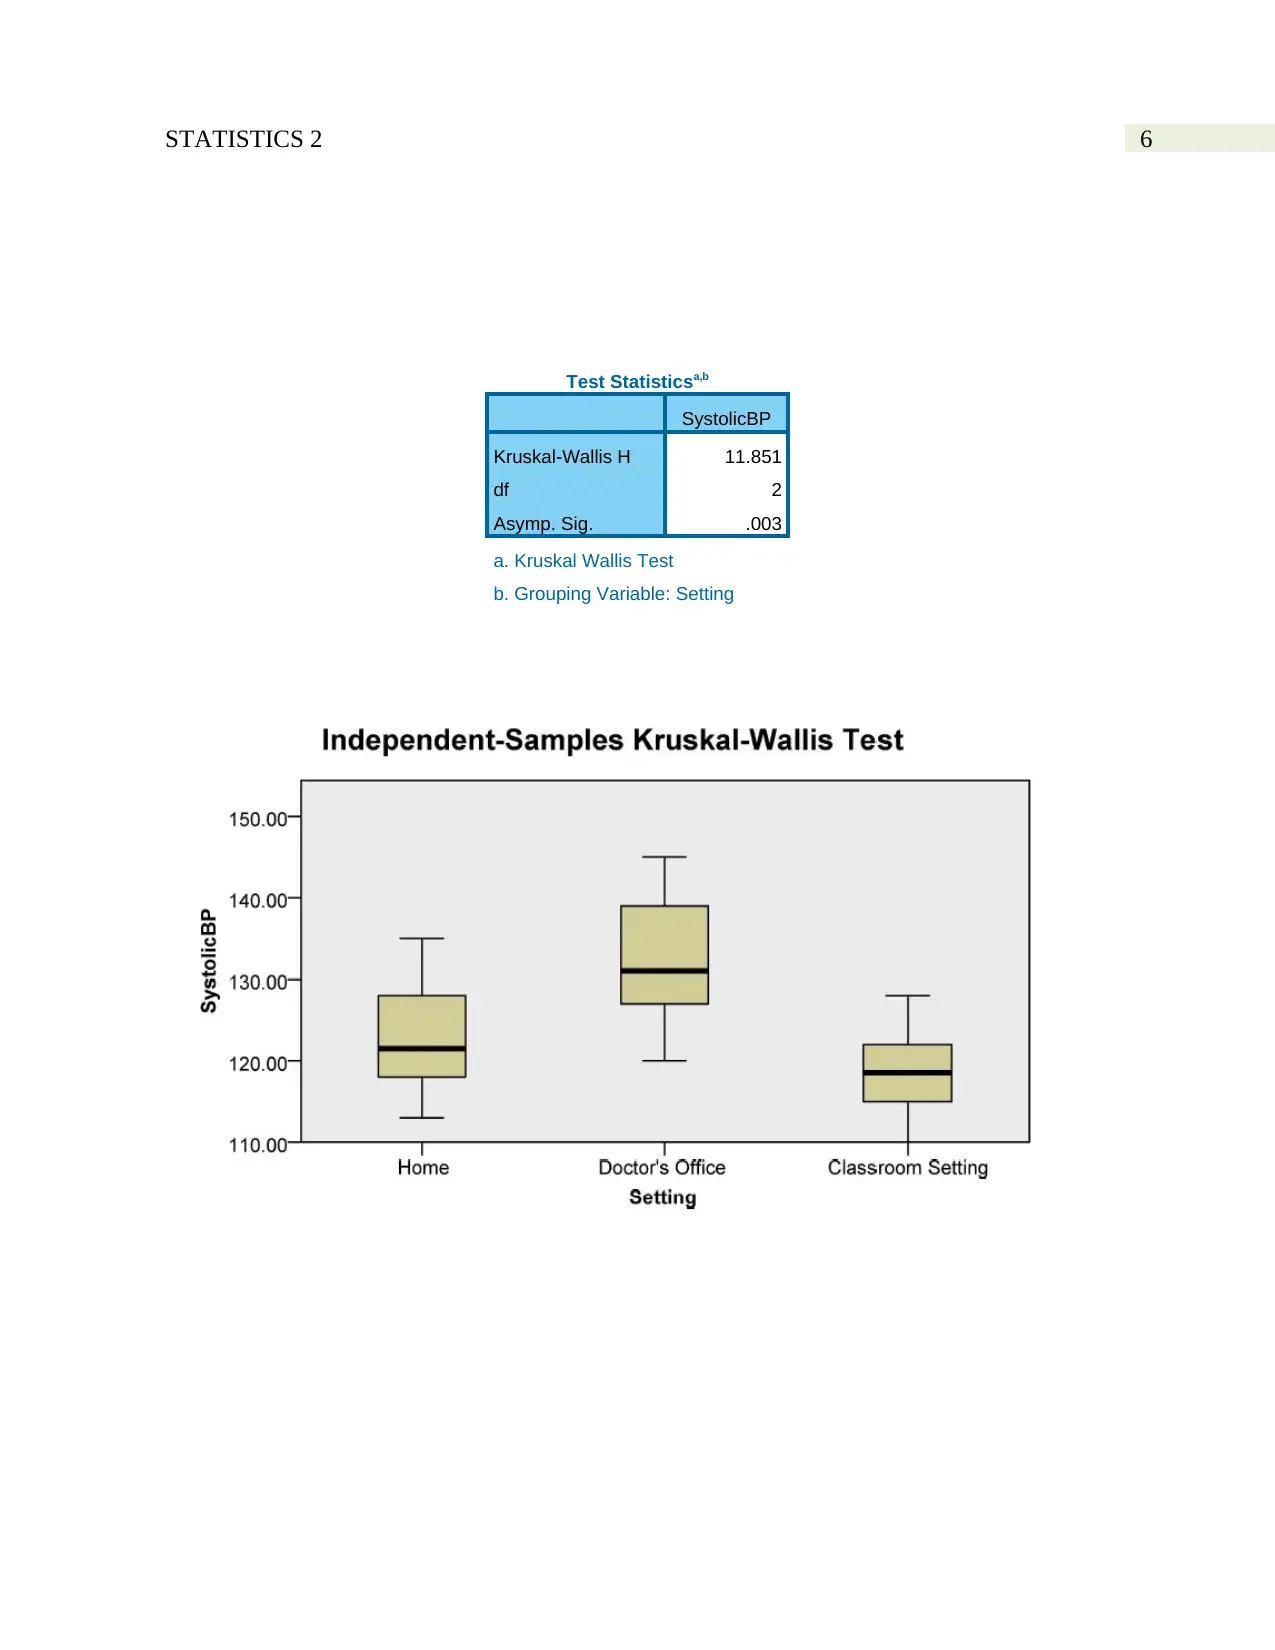
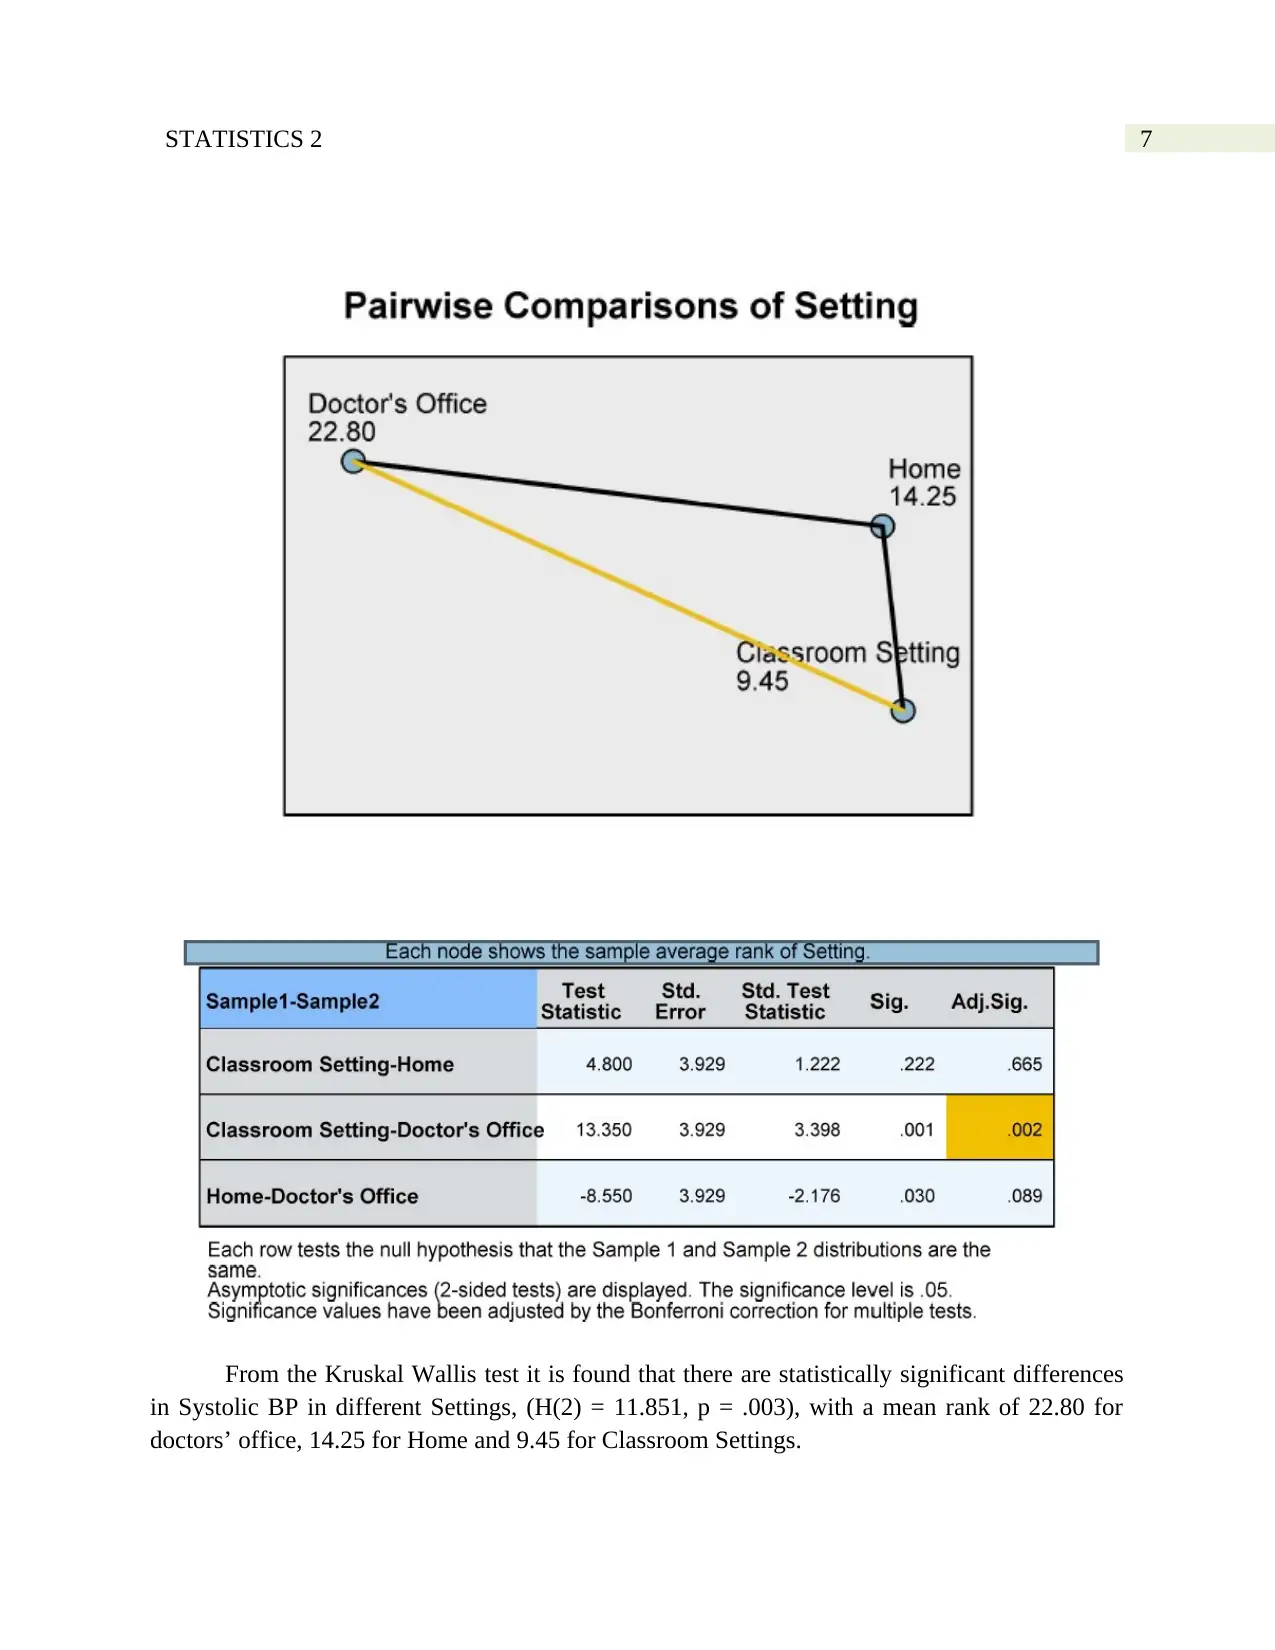
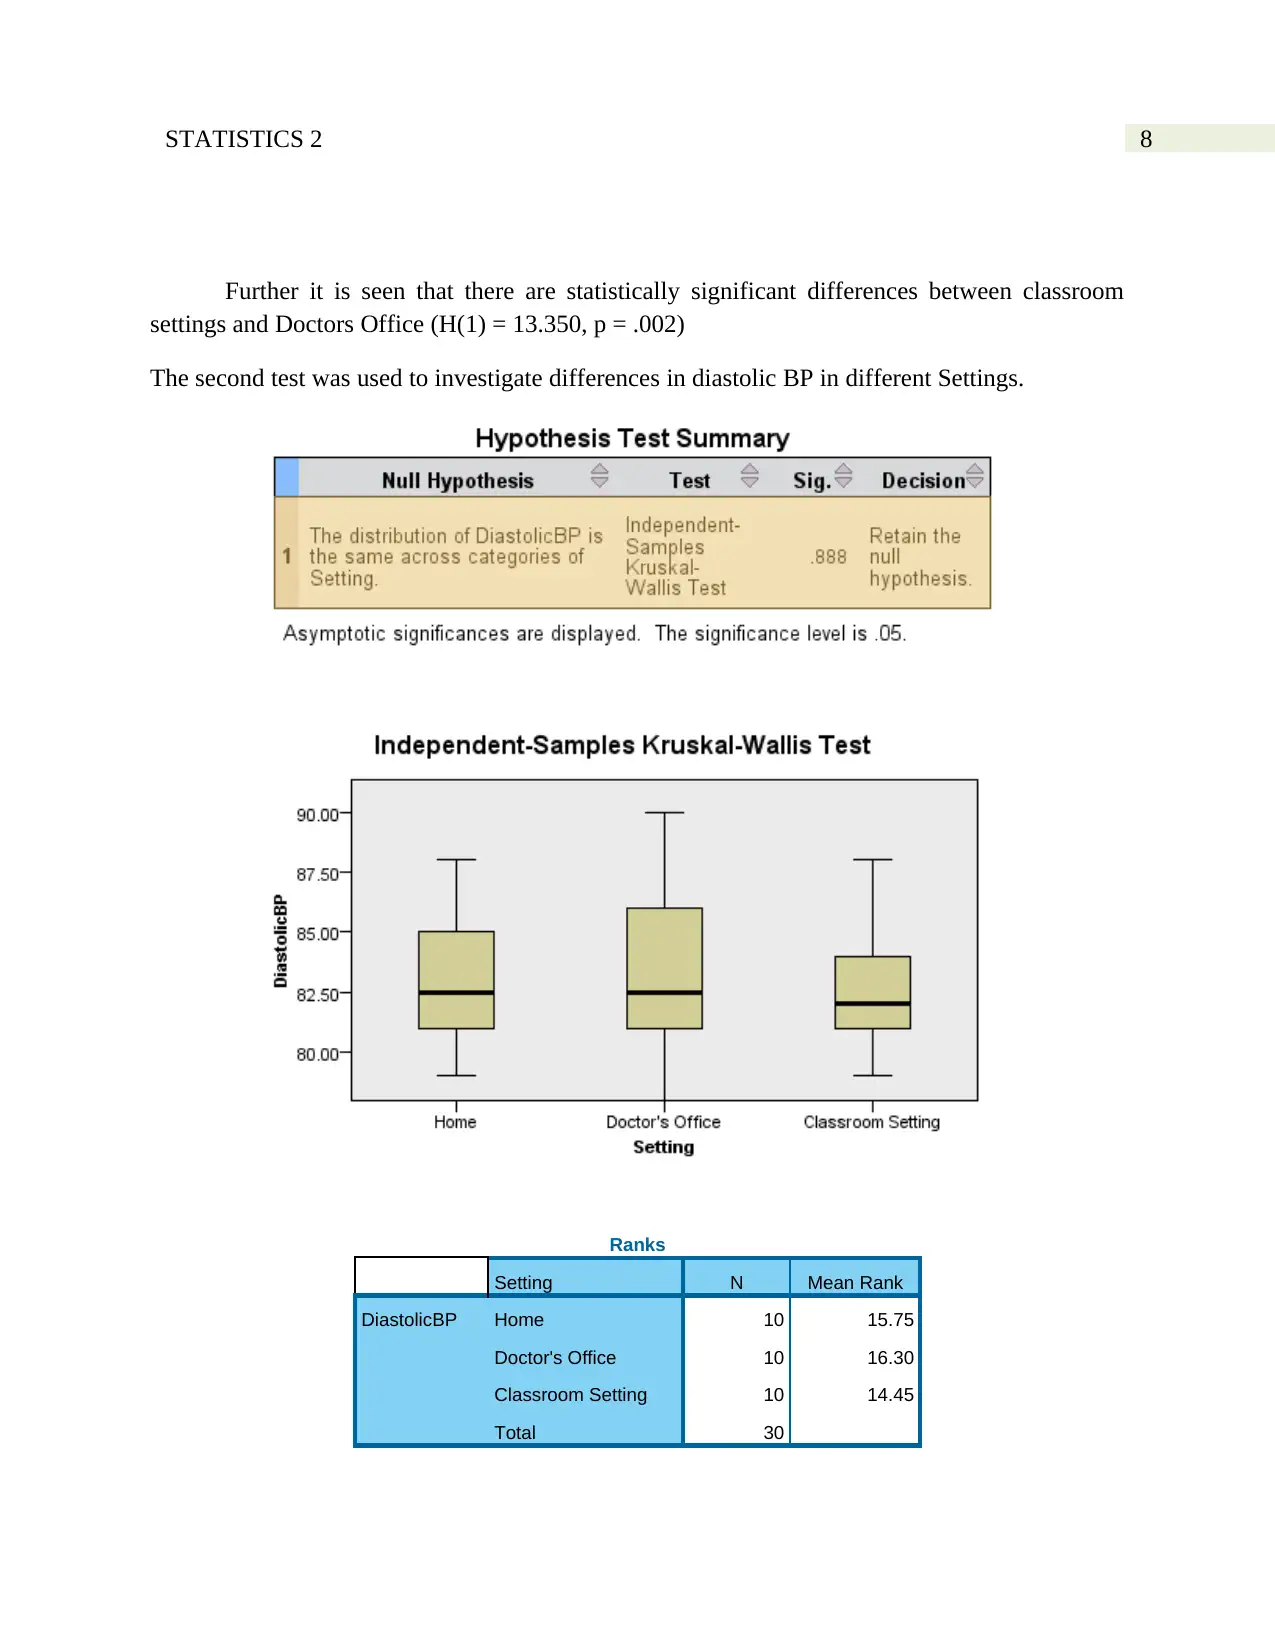
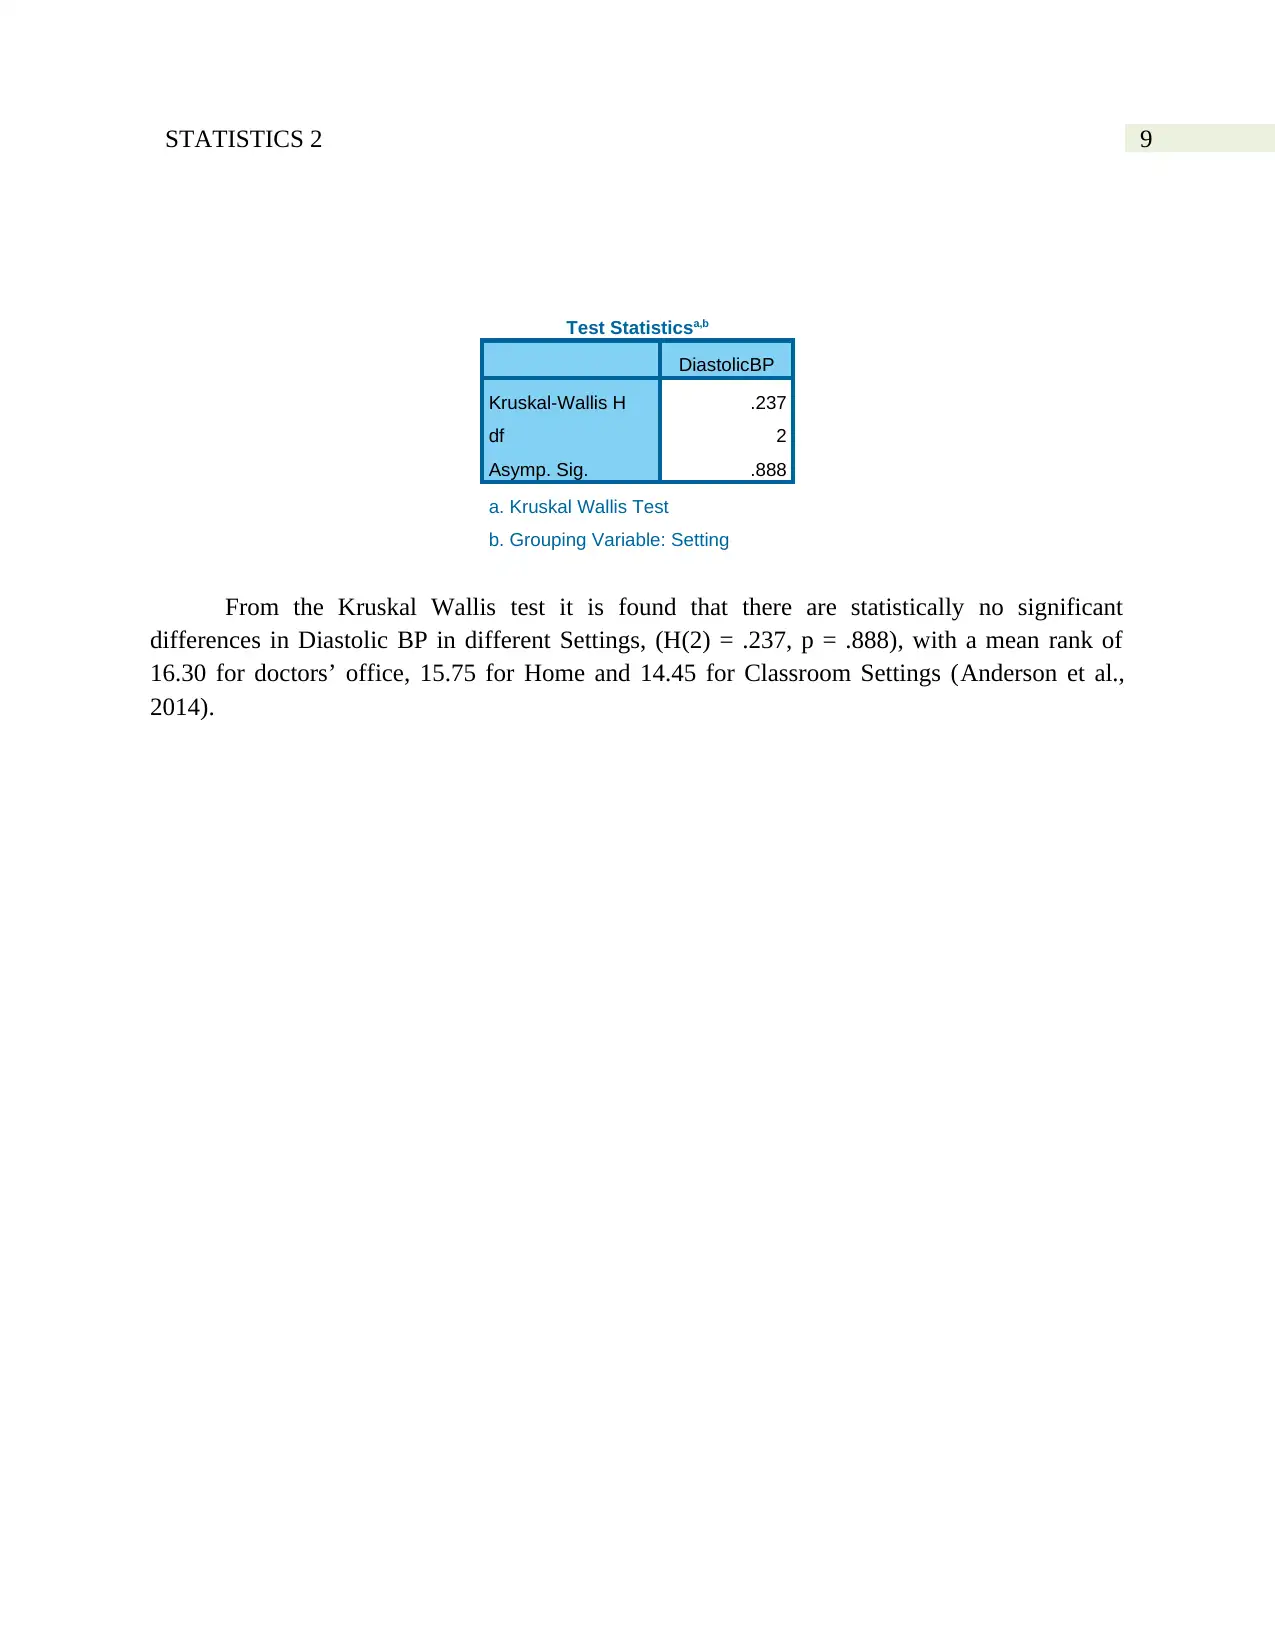
This assignment focuses on the application of t-tests and ANOVA in statistical analysis. Part A discusses the selection criteria for parametric and non-parametric tests, the concept of test power, and non-parametric alternatives to common parametric tests. Part B provides practical examples, including the Wilcoxon Signed Rank Test as an alternative to the dependent sample t-test, the Mann Whitney U test as an alternative to the independent sample t-test, and the Kruskal-Wallis H test as an alternative to single-factor ANOVA. The analysis includes descriptive statistics and interpretations of the test results, with detailed explanations of the findings in the context of creative writing scores and blood pressure measurements under different settings. This document is available on Desklib, a platform offering a range of study tools and solved assignments for students.

Running head: STATISTICS 2
Statistics 2
Name of the student
Name of the university
Author’s note
Statistics 2
Name of the student
Name of the university
Author’s note
Paraphrase This Document
Need a fresh take? Get an instant paraphrase of this document with our AI Paraphraser

1STATISTICS 2
Table of Contents
Part A...............................................................................................................................................2
Answer 1..........................................................................................................................................2
Answer 2..........................................................................................................................................2
Answer 3......................................................................................................................................2
Part B...............................................................................................................................................3
Answer 1......................................................................................................................................3
Answer 2......................................................................................................................................4
References :...................................................................................................................................10

2STATISTICS 2
Part A
Answer 1
The choice to select the type of test is dependent on the distribution of data. Parametric
test is used when the sample data is normally distributed. Non-parametric test is used when we
are unsure about the distribution of the data. The presence of outliers does not affect the outcome
of non-parametric tests. The outcome of non-parametric test is a score or ranking of the data
sample. Moreover, a non-parametric test provides a ranking of the observations. Further, when
the data is either in interval scale or is ordinal in nature then non-parametric test is used (Sprent
& Smeeton, 2016).
The distribution of data is difficult to measure when the sample size is very small. Under
such conditions it is safe to use non-parametric tests.
Answer 2
The power of a test is defined as the probability that the null hypothesis is rejected when
the fact is that it is false.
There are two types of errors – Type I and Type II. Type I error refers to the erroneous
rejection of the Null hypothesis. On the other hand, the erroneous acceptance of Null Hypothesis
is Type II error. The possibility of an error arises since when using inferential statistics, sample
mean is used which may be different than population mean.
Generally parametric tests have more power than non-parametric tests owing to the added
information they utilize from distributional assumptions. However, this can backfire if the
assumption turns out to be wrong in which case non-parametric tests, which make no
assumptions whatsoever are found to be more powerful.
Answer 3
The following table presents the non-parametric alternative test to the parametric test (Field,
2000):
Parametric test Non-parametric test
Dependent t-test Wilcoxon Signed Rank Test
Independent samples t-test Mann Whitney U Test
Repeated measures ANOVA (one-variable) Friedman Test
One-way ANOVA (Independent) Kruskal Wallis H Test
Pearson Correlation Spearman Rank Correlation Coefficient
⊘ This is a preview!⊘
Do you want full access?
Subscribe today to unlock all pages.

Trusted by 1+ million students worldwide

3STATISTICS 2
Part B
Answer 1
The alternative to dependent sample t-test is Wilcoxon Signed Rank Test (Weaver et al.,
2017).
Descriptive Statistics
CreativePre CreativePost
N 40 40
Mean 40.1500 43.3500
Std. Deviation 8.30369 9.59848
Minimum 26.00 20.00
Maximum 56.00 59.00
Percentiles 25th 34.0000 36.0000
50th (Median) 38.0000 44.0000
75th 47.7500 51.0000
Ranks
N Mean Rank Sum of Ranks
CreativePost - CreativePre Negative Ranks 9a 15.67 141.00
Positive Ranks 28b 20.07 562.00
Ties 3c
Total 40
a. CreativePost < CreativePre
b. CreativePost > CreativePre
c. CreativePost = CreativePre
Paraphrase This Document
Need a fresh take? Get an instant paraphrase of this document with our AI Paraphraser

4STATISTICS 2
Test Statisticsa
CreativePost -
CreativePre
Z -3.179b
Asymp. Sig. (2-tailed) .001
a. Wilcoxon Signed Ranks Test
b. Based on negative ranks.
From table 1 it is found that the mean ± sd of the Creativity Pre-test score is 40.15 ±
8.30369. The mean ± sd of the Creativity Post-test score is 43.35 ± 9.59848.
The Creative Post-test score for 9 individuals taking the course is lower than Creative
Pre-test score. The Creative Post-test score for 28 individuals taking the course is higher than
Creative Pre-test score. The Creative Pres-test and Post-test score are similar (Ott & Longnecker,
2015).
The Wilcoxon signed-rank test showed that Creative writing course produced a
statistically significant difference in Creative writing post and pre scores, (Z = -3.179, p = 0.001
< 0.05)
Answer 2
The alternative to independent sample t-test is Mann Whitney U test (Black,
2016).
Ranks
Grouping N Mean Rank Sum of Ranks
TestScore Pre 40 36.23 1449.00
Post 40 44.78 1791.00
Total 80
Test Statisticsa
TestScore
Mann-Whitney U 629.000
Wilcoxon W 1449.000
Test Statisticsa
CreativePost -
CreativePre
Z -3.179b
Asymp. Sig. (2-tailed) .001
a. Wilcoxon Signed Ranks Test
b. Based on negative ranks.
From table 1 it is found that the mean ± sd of the Creativity Pre-test score is 40.15 ±
8.30369. The mean ± sd of the Creativity Post-test score is 43.35 ± 9.59848.
The Creative Post-test score for 9 individuals taking the course is lower than Creative
Pre-test score. The Creative Post-test score for 28 individuals taking the course is higher than
Creative Pre-test score. The Creative Pres-test and Post-test score are similar (Ott & Longnecker,
2015).
The Wilcoxon signed-rank test showed that Creative writing course produced a
statistically significant difference in Creative writing post and pre scores, (Z = -3.179, p = 0.001
< 0.05)
Answer 2
The alternative to independent sample t-test is Mann Whitney U test (Black,
2016).
Ranks
Grouping N Mean Rank Sum of Ranks
TestScore Pre 40 36.23 1449.00
Post 40 44.78 1791.00
Total 80
Test Statisticsa
TestScore
Mann-Whitney U 629.000
Wilcoxon W 1449.000

5STATISTICS 2
Z -1.647
Asymp. Sig. (2-tailed) .100
a. Grouping Variable: Grouping
The mean rank of the Creative Pre-test group is 36.23 while for the Creative Post-test is 44.78.
The Mann Whitney U test showed that the mean rank creative post-test score (36.23) was not
significantly different than the mean rank of creative post-test score (44.78), U = 629.0, p = .100
(Brace, Snelgar & Kemp, 2012).
Answer 3
The alternative to single factor ANOVA is Kruskal-Wallis H test (Hinton, McMurray &
Brownlow, 2014).
Two Kruskal-Wallis H test were done.
The first test was used to investigate differences in Systolic BP in different Settings.
Ranks
Setting N Mean Rank
SystolicBP Home 10 14.25
Doctor's Office 10 22.80
Classroom Setting 10 9.45
Total 30
⊘ This is a preview!⊘
Do you want full access?
Subscribe today to unlock all pages.

Trusted by 1+ million students worldwide

6STATISTICS 2
Test Statisticsa,b
SystolicBP
Kruskal-Wallis H 11.851
df 2
Asymp. Sig. .003
a. Kruskal Wallis Test
b. Grouping Variable: Setting
Test Statisticsa,b
SystolicBP
Kruskal-Wallis H 11.851
df 2
Asymp. Sig. .003
a. Kruskal Wallis Test
b. Grouping Variable: Setting
Paraphrase This Document
Need a fresh take? Get an instant paraphrase of this document with our AI Paraphraser

7STATISTICS 2
From the Kruskal Wallis test it is found that there are statistically significant differences
in Systolic BP in different Settings, (H(2) = 11.851, p = .003), with a mean rank of 22.80 for
doctors’ office, 14.25 for Home and 9.45 for Classroom Settings.
From the Kruskal Wallis test it is found that there are statistically significant differences
in Systolic BP in different Settings, (H(2) = 11.851, p = .003), with a mean rank of 22.80 for
doctors’ office, 14.25 for Home and 9.45 for Classroom Settings.

8STATISTICS 2
Further it is seen that there are statistically significant differences between classroom
settings and Doctors Office (H(1) = 13.350, p = .002)
The second test was used to investigate differences in diastolic BP in different Settings.
Ranks
Setting N Mean Rank
DiastolicBP Home 10 15.75
Doctor's Office 10 16.30
Classroom Setting 10 14.45
Total 30
⊘ This is a preview!⊘
Do you want full access?
Subscribe today to unlock all pages.

Trusted by 1+ million students worldwide

9STATISTICS 2
Test Statisticsa,b
DiastolicBP
Kruskal-Wallis H .237
df 2
Asymp. Sig. .888
a. Kruskal Wallis Test
b. Grouping Variable: Setting
From the Kruskal Wallis test it is found that there are statistically no significant
differences in Diastolic BP in different Settings, (H(2) = .237, p = .888), with a mean rank of
16.30 for doctors’ office, 15.75 for Home and 14.45 for Classroom Settings (Anderson et al.,
2014).
Paraphrase This Document
Need a fresh take? Get an instant paraphrase of this document with our AI Paraphraser

10STATISTICS 2
References :
Anderson, D. R., Sweeney, D. J., Williams, T. A., Camm, J. D., & Cochran, J. J.
(2014). Essentials of statistics for business and economics. Cengage Learning.
Black, K. (2016). Business statistics: Contemporary decision making. John Wiley & Sons.
Brace, N., Snelgar, R., & Kemp, R. (2012). SPSS for Psychologists. Palgrave Macmillan.
Field, A. (2000). Discovering Statistics Using SPSS for Windows: Advanced Techniques for the
Beginner. Sage
Hinton, P. R., McMurray, I., & Brownlow, C. (2014). SPSS explained. Routledge.
Ott, R. L., & Longnecker, M. T. (2015). An introduction to statistical methods and data analysis.
Nelson Education.
Sprent, P., & Smeeton, N. C. (2016). Applied nonparametric statistical methods. CRC Press.
Weaver, K., Morales, V., Dunn, S., Godde, K. and Weaver, P. (2017). An Introduction to
Statistical Analysis in Research: With Applications in the Biological and Life Sciences.
John Wiley & Sons.
.
1 out of 11
Related Documents
Your All-in-One AI-Powered Toolkit for Academic Success.
+13062052269
info@desklib.com
Available 24*7 on WhatsApp / Email
Unlock your academic potential
Copyright © 2020–2025 A2Z Services. All Rights Reserved. Developed and managed by ZUCOL.


