Master's Level Statistics in Education Assignment, ESE633, May 2017
VerifiedAdded on 2022/10/13
|11
|2969
|22
Homework Assignment
AI Summary
This document presents a comprehensive solution to a master's level statistics assignment (ESE633) focusing on statistical tests and their applications in educational research. The assignment covers various statistical concepts including hypothesis formulation, t-tests, ANOVA, and regression analysis. The solution provides detailed explanations for selecting appropriate statistical tests based on research questions and data characteristics, such as gender comparisons, socioeconomic status, and school types. It also addresses the assumptions underlying these tests, including normality and homogeneity of variance, and explains the interpretation of statistical results, including p-values, confidence intervals, and multiple comparisons. Furthermore, the assignment explores the application of statistical procedures to analyze data on student height, jump span, and attitude towards English, providing insights into the use of t-tests, and ANOVA for comparing means and assessing intervention effects. The solution also delves into the interpretation of normality tests (Kolmogorov-Smirnov and Shapiro-Wilk) and provides a clear understanding of multiple comparison techniques and their significance in research findings.
ASSIGNMENT
MAY 2017 SEMESTER
SUBJECT CODE : ESE633
SUBJECT TITLE : STATISTICS IN EDUCATION
LEVEL : MASTER
STUDENT’S NAME :
MATRIC NO. :
PROGRAMME :
ACADEMIC
FACILITATOR
:
LEARNING CENTRE :
MAY 2017 SEMESTER
SUBJECT CODE : ESE633
SUBJECT TITLE : STATISTICS IN EDUCATION
LEVEL : MASTER
STUDENT’S NAME :
MATRIC NO. :
PROGRAMME :
ACADEMIC
FACILITATOR
:
LEARNING CENTRE :
Paraphrase This Document
Need a fresh take? Get an instant paraphrase of this document with our AI Paraphraser
ASSIGNMENT (60%)
INSTRUCTION: Answer ALL questions.
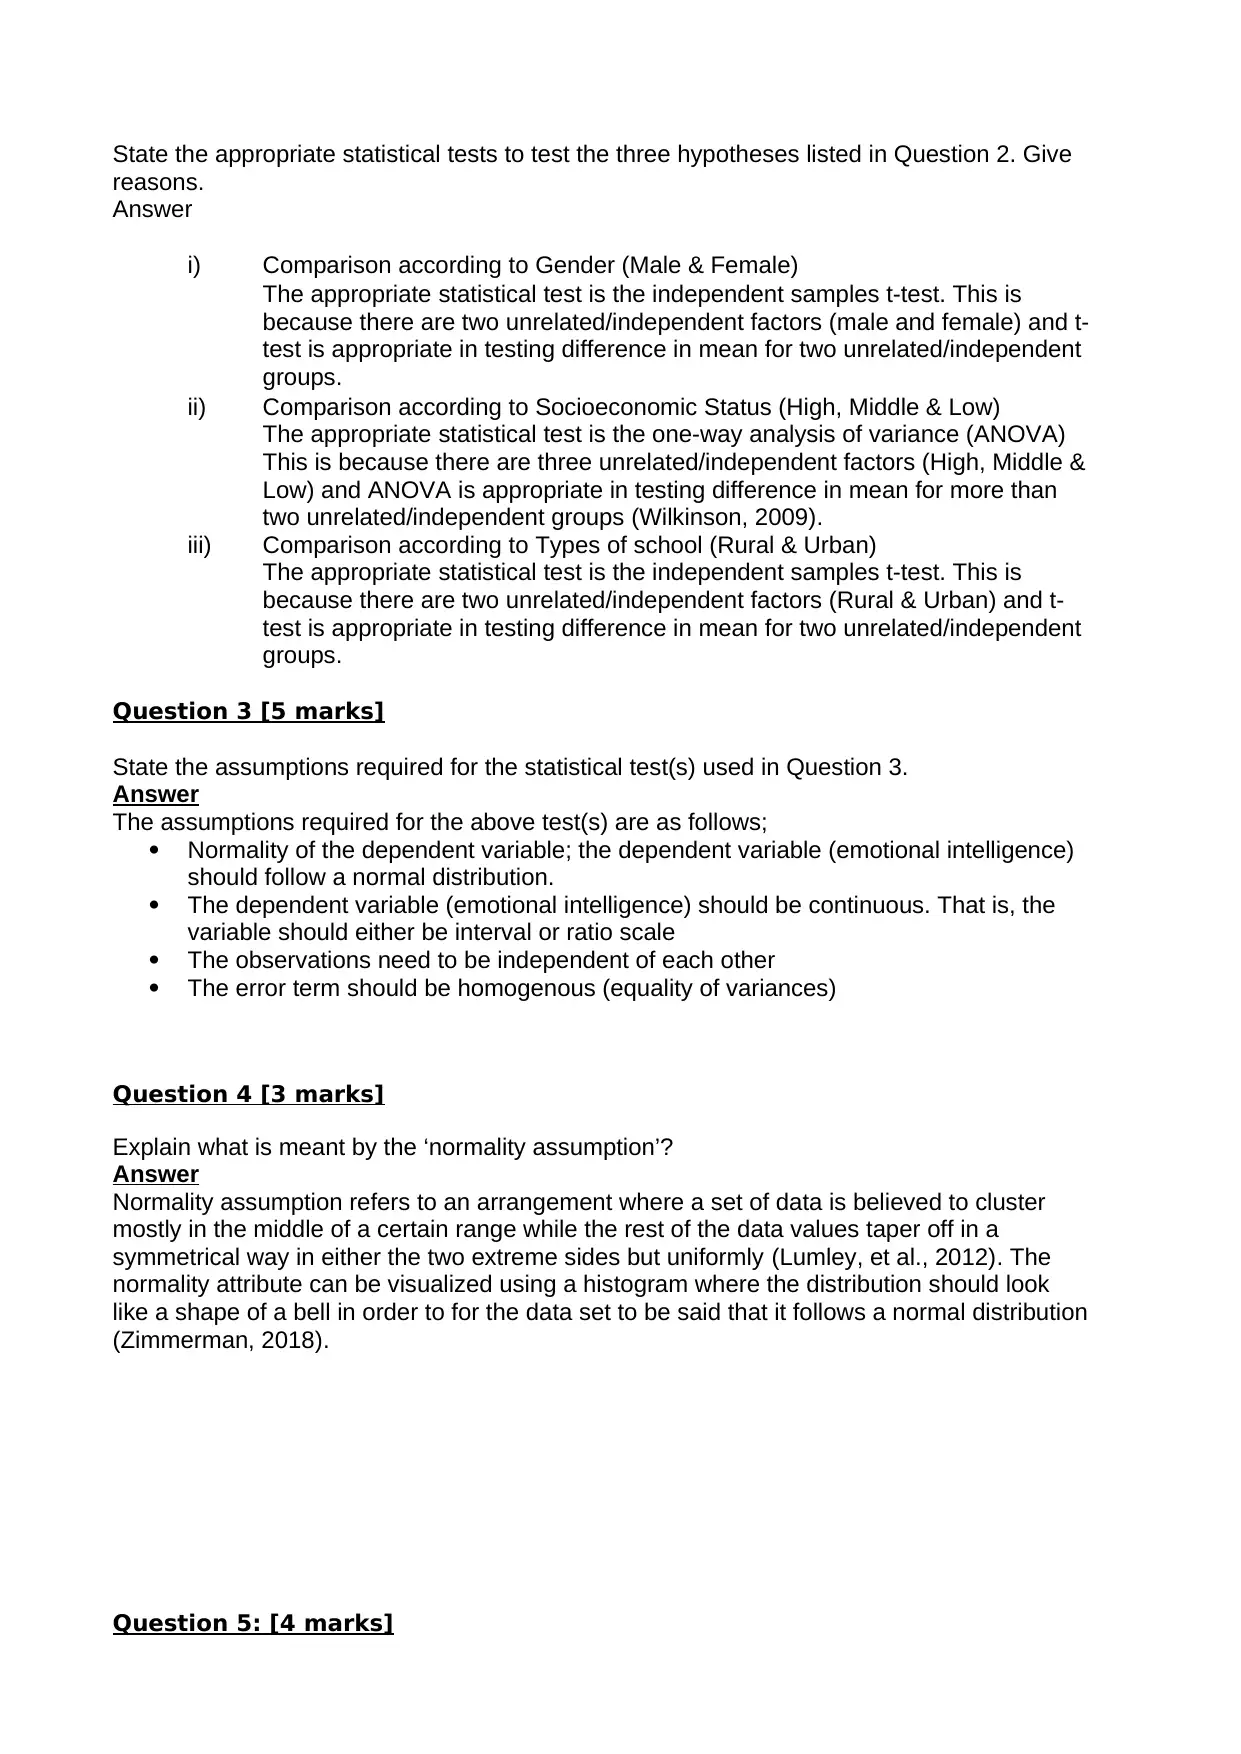
Question 1 [6 marks]
State THREE hypotheses using Emotional Intelligence as the dependent variable for the
following:
i) Comparison according to Gender (Male & Female)
Answer
Null hypothesis (H0): There is no significant difference in the emotional
intelligence between the male and female participants.
Alternative hypothesis (HA): There is significant difference in the emotional
intelligence between the male and female participants.
ii) Comparison according to Socioeconomic Status (High, Middle & Low)
Answer
Null hypothesis (H0): The emotional intelligence is the same across the three
socioeconomic status.
Alternative hypothesis (HA): At least one of the socioeconomic status has
different emotional intelligence.
iii) Comparison according to Types of school (Rural & Urban)
Answer
Null hypothesis (H0): There is no significant difference in the emotional
intelligence between the participants in the rural schools and those in the
urban schools.
Alternative hypothesis (HA): There is significant difference in the emotional
intelligence between the participants in the rural schools and those in the
urban schools.
Question 2 [3 marks]
A researcher conducted a study to measure Self-Esteem among of a group of
16 year old students. The sample consisted of 120 subjects; 60 males and 60
female subjects. In her study, the researcher defined Self-Esteem as consisting
of three factors or constructs; namely, Physical Self-Esteem, Academic Self-
Esteem and Social Self-Esteem.
INSTRUCTION: Answer ALL questions.
Question 1 [6 marks]
State THREE hypotheses using Emotional Intelligence as the dependent variable for the
following:
i) Comparison according to Gender (Male & Female)
Answer
Null hypothesis (H0): There is no significant difference in the emotional
intelligence between the male and female participants.
Alternative hypothesis (HA): There is significant difference in the emotional
intelligence between the male and female participants.
ii) Comparison according to Socioeconomic Status (High, Middle & Low)
Answer
Null hypothesis (H0): The emotional intelligence is the same across the three
socioeconomic status.
Alternative hypothesis (HA): At least one of the socioeconomic status has
different emotional intelligence.
iii) Comparison according to Types of school (Rural & Urban)
Answer
Null hypothesis (H0): There is no significant difference in the emotional
intelligence between the participants in the rural schools and those in the
urban schools.
Alternative hypothesis (HA): There is significant difference in the emotional
intelligence between the participants in the rural schools and those in the
urban schools.
Question 2 [3 marks]
A researcher conducted a study to measure Self-Esteem among of a group of
16 year old students. The sample consisted of 120 subjects; 60 males and 60
female subjects. In her study, the researcher defined Self-Esteem as consisting
of three factors or constructs; namely, Physical Self-Esteem, Academic Self-
Esteem and Social Self-Esteem.
State the appropriate statistical tests to test the three hypotheses listed in Question 2. Give
reasons.
Answer
i) Comparison according to Gender (Male & Female)
The appropriate statistical test is the independent samples t-test. This is
because there are two unrelated/independent factors (male and female) and t-
test is appropriate in testing difference in mean for two unrelated/independent
groups.
ii) Comparison according to Socioeconomic Status (High, Middle & Low)
The appropriate statistical test is the one-way analysis of variance (ANOVA)
This is because there are three unrelated/independent factors (High, Middle &
Low) and ANOVA is appropriate in testing difference in mean for more than
two unrelated/independent groups (Wilkinson, 2009).
iii) Comparison according to Types of school (Rural & Urban)
The appropriate statistical test is the independent samples t-test. This is
because there are two unrelated/independent factors (Rural & Urban) and t-
test is appropriate in testing difference in mean for two unrelated/independent
groups.
Question 3 [5 marks]
State the assumptions required for the statistical test(s) used in Question 3.
Answer
The assumptions required for the above test(s) are as follows;
Normality of the dependent variable; the dependent variable (emotional intelligence)
should follow a normal distribution.
The dependent variable (emotional intelligence) should be continuous. That is, the
variable should either be interval or ratio scale
The observations need to be independent of each other
The error term should be homogenous (equality of variances)
Question 4 [3 marks]
Explain what is meant by the ‘normality assumption’?
Answer
Normality assumption refers to an arrangement where a set of data is believed to cluster
mostly in the middle of a certain range while the rest of the data values taper off in a
symmetrical way in either the two extreme sides but uniformly (Lumley, et al., 2012). The
normality attribute can be visualized using a histogram where the distribution should look
like a shape of a bell in order to for the data set to be said that it follows a normal distribution
(Zimmerman, 2018).
Question 5: [4 marks]
⊘ This is a preview!⊘
Do you want full access?
Subscribe today to unlock all pages.
Trusted by 1+ million students worldwide
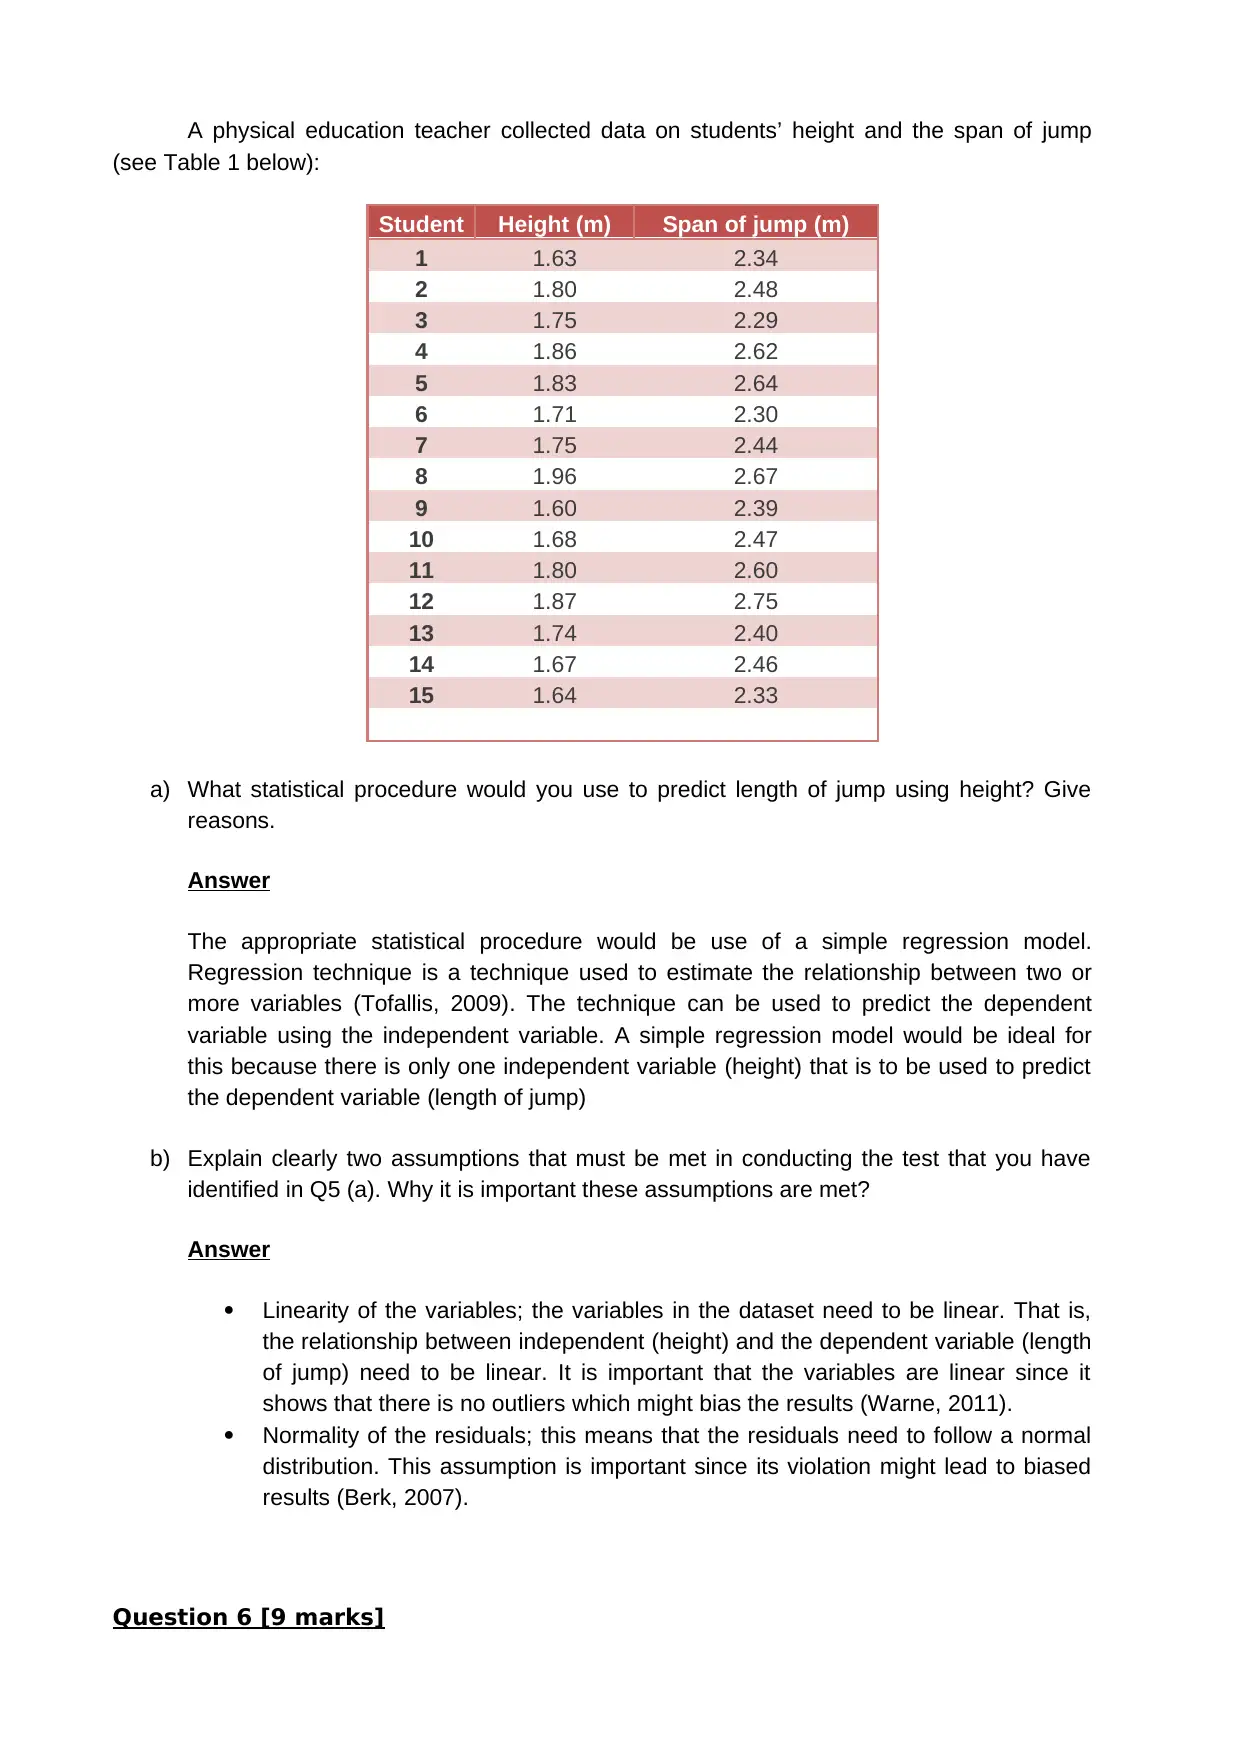
A physical education teacher collected data on students’ height and the span of jump
(see Table 1 below):
Student Height (m) Span of jump (m)
1 1.63 2.34
2 1.80 2.48
3 1.75 2.29
4 1.86 2.62
5 1.83 2.64
6 1.71 2.30
7 1.75 2.44
8 1.96 2.67
9 1.60 2.39
10 1.68 2.47
11 1.80 2.60
12 1.87 2.75
13 1.74 2.40
14 1.67 2.46
15 1.64 2.33
a) What statistical procedure would you use to predict length of jump using height? Give
reasons.
Answer
The appropriate statistical procedure would be use of a simple regression model.
Regression technique is a technique used to estimate the relationship between two or
more variables (Tofallis, 2009). The technique can be used to predict the dependent
variable using the independent variable. A simple regression model would be ideal for
this because there is only one independent variable (height) that is to be used to predict
the dependent variable (length of jump)
b) Explain clearly two assumptions that must be met in conducting the test that you have
identified in Q5 (a). Why it is important these assumptions are met?
Answer
Linearity of the variables; the variables in the dataset need to be linear. That is,
the relationship between independent (height) and the dependent variable (length
of jump) need to be linear. It is important that the variables are linear since it
shows that there is no outliers which might bias the results (Warne, 2011).
Normality of the residuals; this means that the residuals need to follow a normal
distribution. This assumption is important since its violation might lead to biased
results (Berk, 2007).
Question 6 [9 marks]
Paraphrase This Document
Need a fresh take? Get an instant paraphrase of this document with our AI Paraphraser
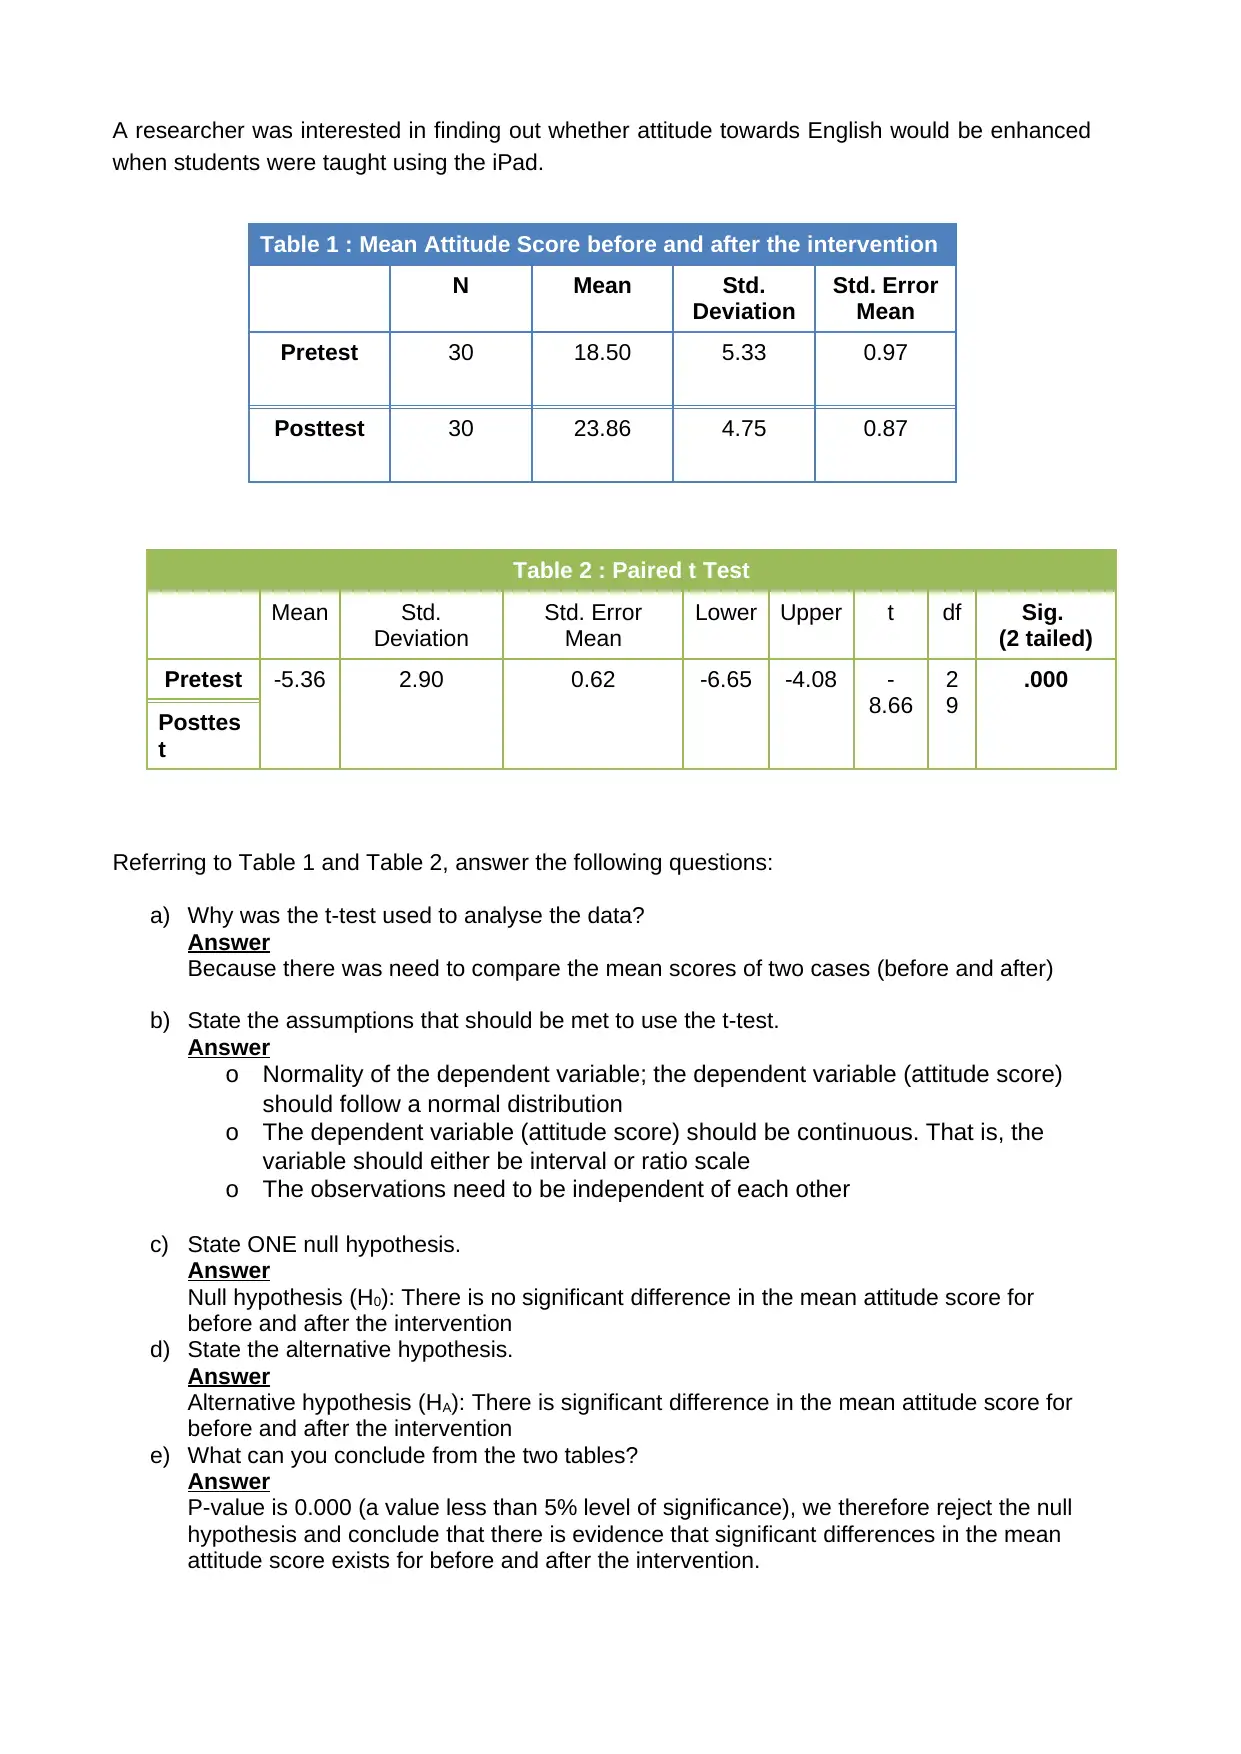
A researcher was interested in finding out whether attitude towards English would be enhanced
when students were taught using the iPad.
Table 2 : Paired t Test
Mean Std.
Deviation
Std. Error
Mean
Lower Upper t df Sig.
(2 tailed)
Pretest -5.36 2.90 0.62 -6.65 -4.08 -
8.66
2
9
.000
Posttes
t
Referring to Table 1 and Table 2, answer the following questions:
a) Why was the t-test used to analyse the data?
Answer
Because there was need to compare the mean scores of two cases (before and after)
b) State the assumptions that should be met to use the t-test.
Answer
o Normality of the dependent variable; the dependent variable (attitude score)
should follow a normal distribution
o The dependent variable (attitude score) should be continuous. That is, the
variable should either be interval or ratio scale
o The observations need to be independent of each other
c) State ONE null hypothesis.
Answer
Null hypothesis (H0): There is no significant difference in the mean attitude score for
before and after the intervention
d) State the alternative hypothesis.
Answer
Alternative hypothesis (HA): There is significant difference in the mean attitude score for
before and after the intervention
e) What can you conclude from the two tables?
Answer
P-value is 0.000 (a value less than 5% level of significance), we therefore reject the null
hypothesis and conclude that there is evidence that significant differences in the mean
attitude score exists for before and after the intervention.
Table 1 : Mean Attitude Score before and after the intervention
N Mean Std.
Deviation
Std. Error
Mean
Pretest 30 18.50 5.33 0.97
Posttest 30 23.86 4.75 0.87
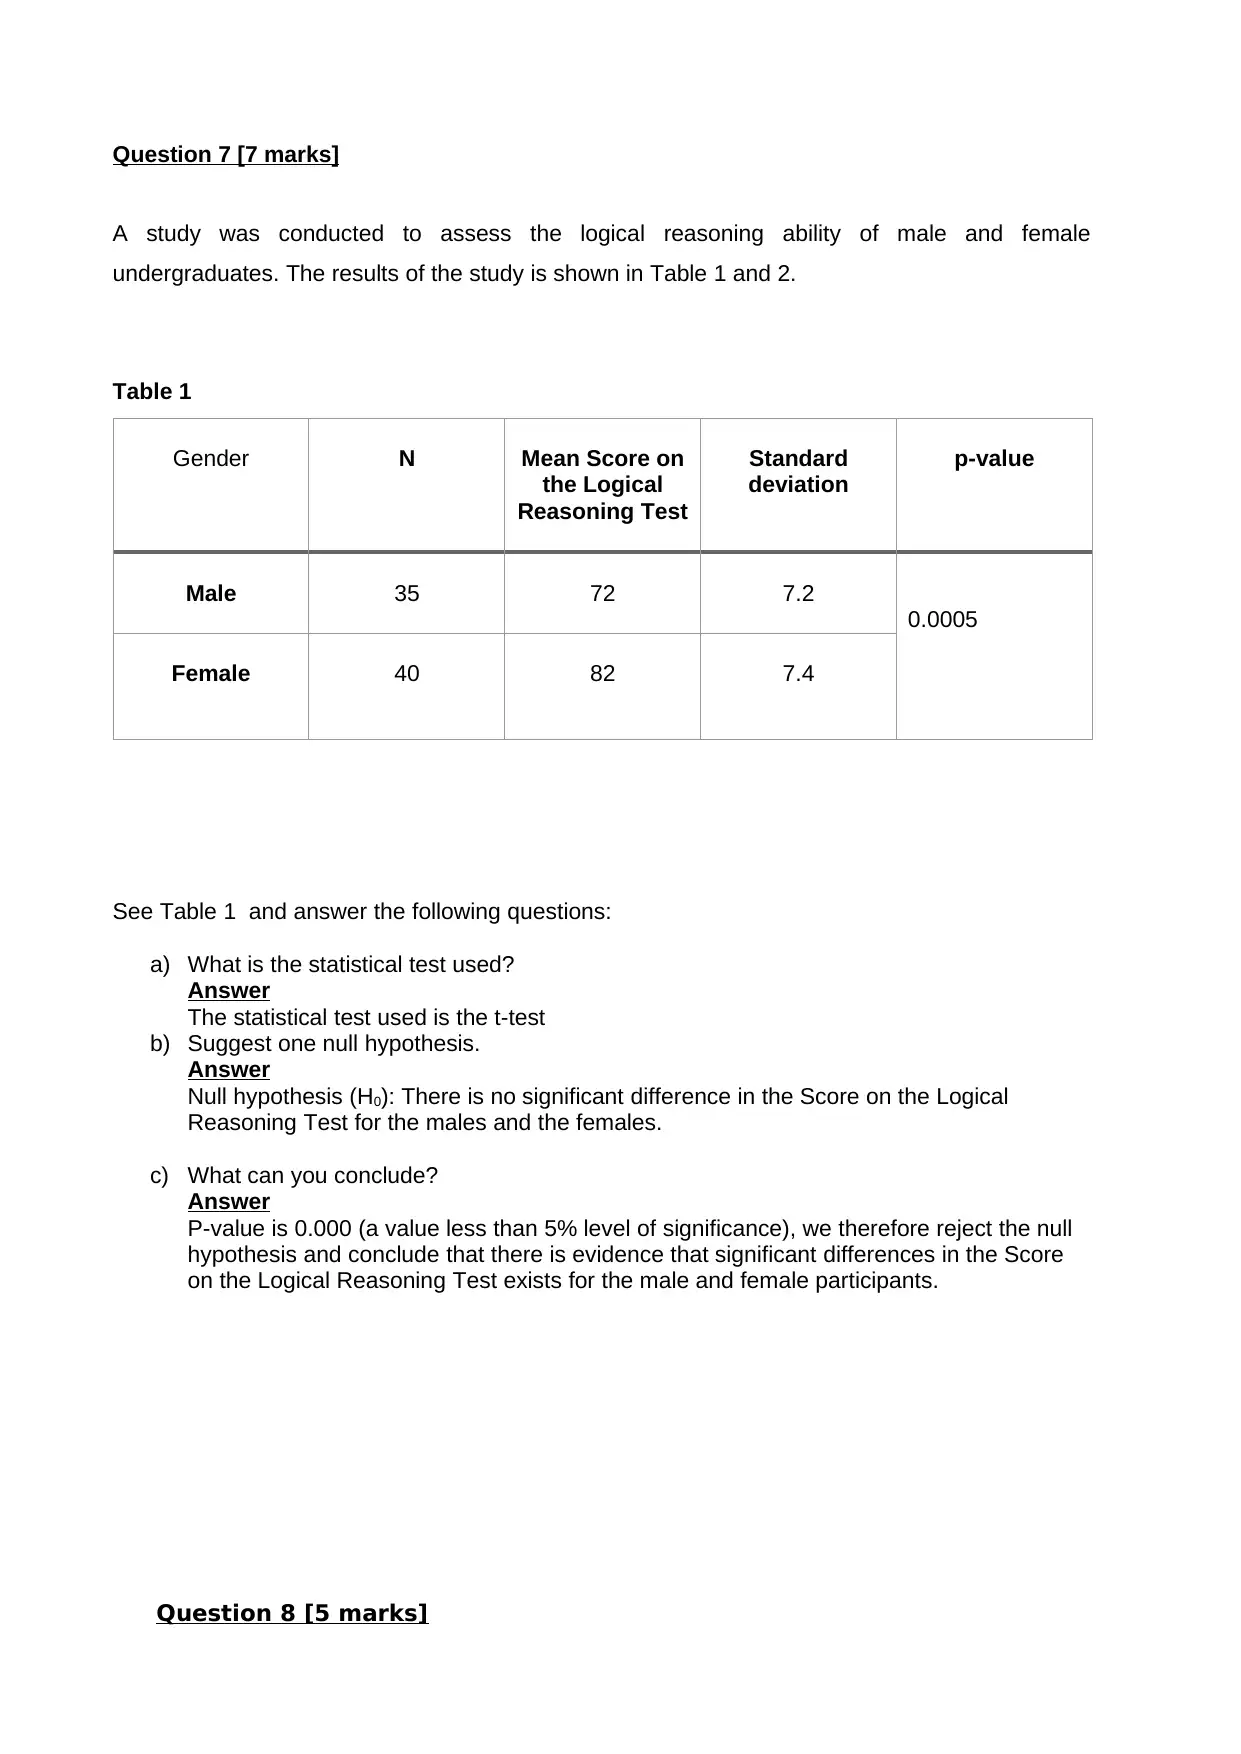
Question 7 [7 marks]
A study was conducted to assess the logical reasoning ability of male and female
undergraduates. The results of the study is shown in Table 1 and 2.
Table 1
Gender N Mean Score on
the Logical
Reasoning Test
Standard
deviation
p-value
Male 35 72 7.2
0.0005
Female 40 82 7.4
See Table 1 and answer the following questions:
a) What is the statistical test used?
Answer
The statistical test used is the t-test
b) Suggest one null hypothesis.
Answer
Null hypothesis (H0): There is no significant difference in the Score on the Logical
Reasoning Test for the males and the females.
c) What can you conclude?
Answer
P-value is 0.000 (a value less than 5% level of significance), we therefore reject the null
hypothesis and conclude that there is evidence that significant differences in the Score
on the Logical Reasoning Test exists for the male and female participants.
Question 8 [5 marks]
⊘ This is a preview!⊘
Do you want full access?
Subscribe today to unlock all pages.
Trusted by 1+ million students worldwide
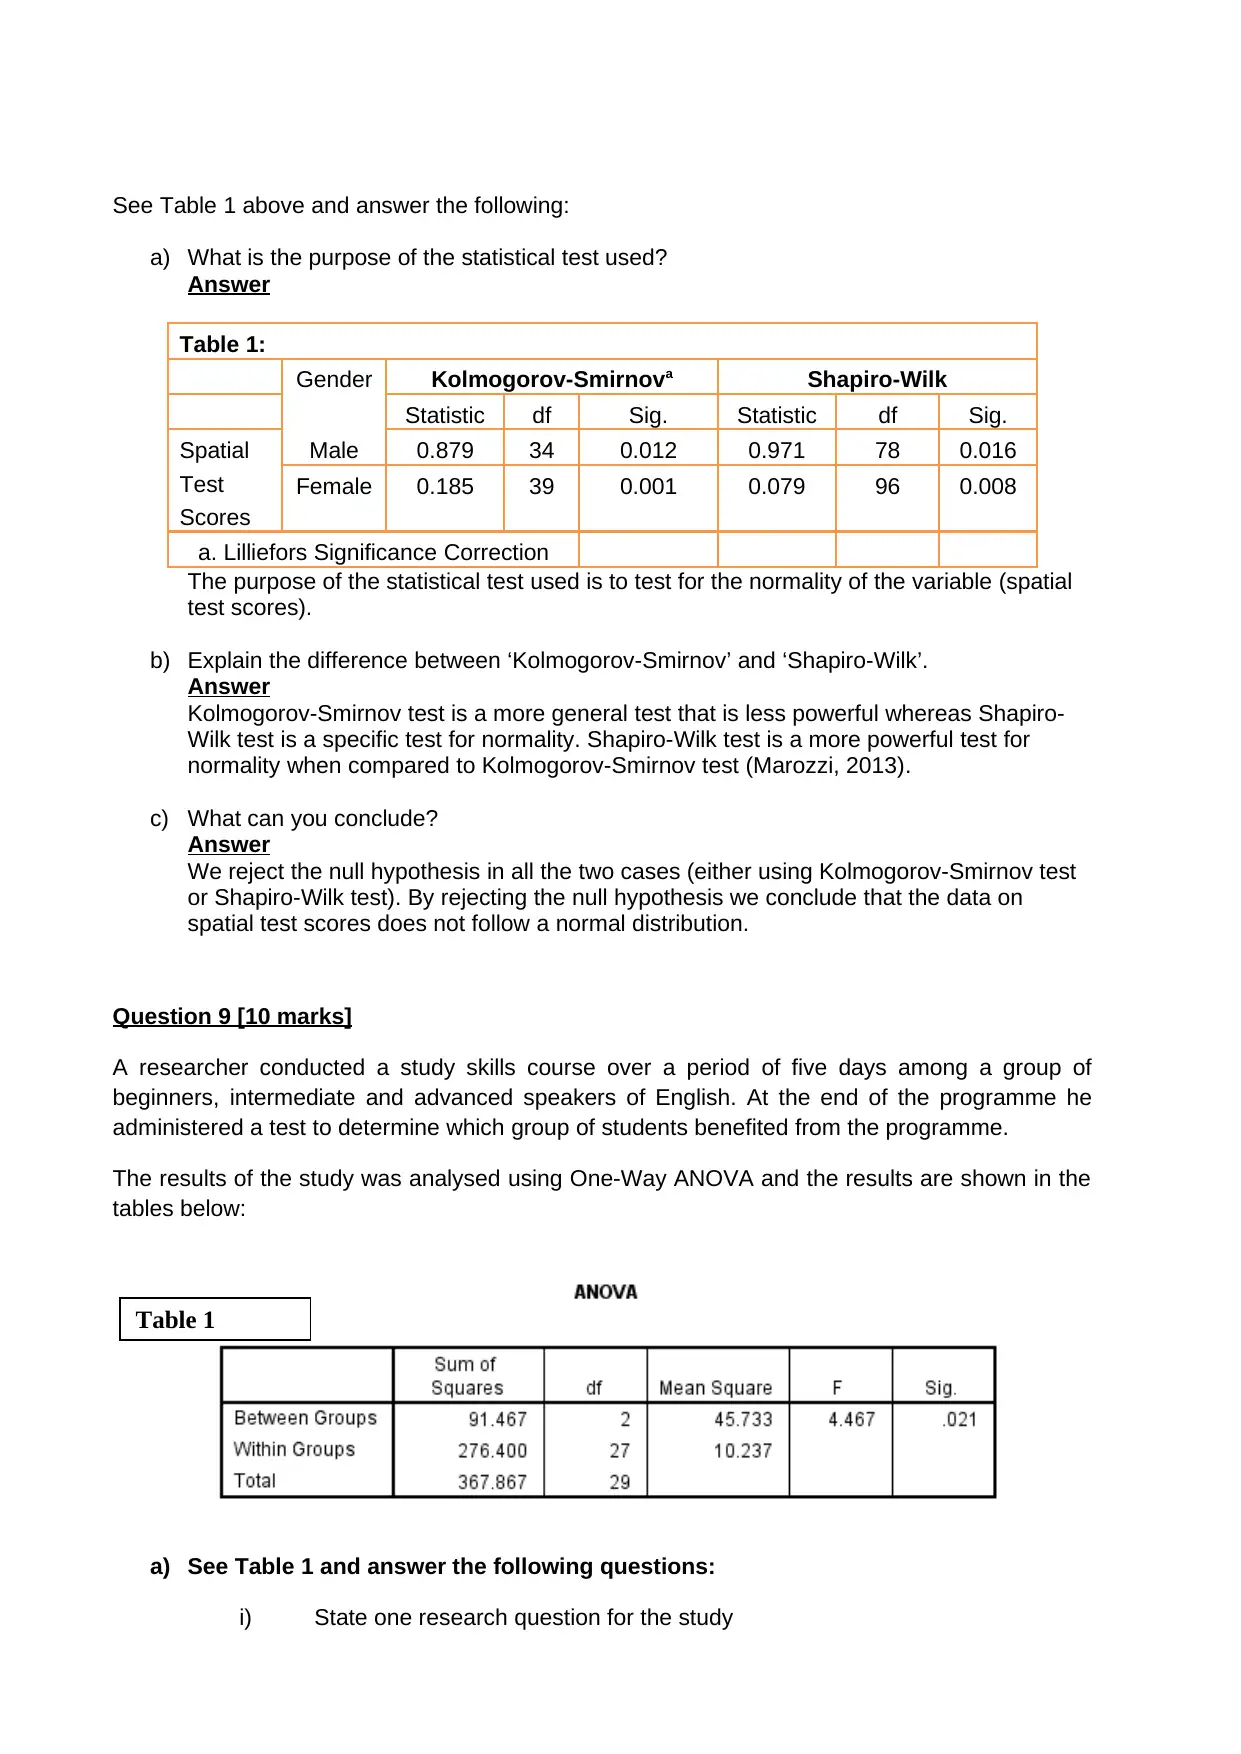
See Table 1 above and answer the following:
a) What is the purpose of the statistical test used?
Answer
The purpose of the statistical test used is to test for the normality of the variable (spatial
test scores).
b) Explain the difference between ‘Kolmogorov-Smirnov’ and ‘Shapiro-Wilk’.
Answer
Kolmogorov-Smirnov test is a more general test that is less powerful whereas Shapiro-
Wilk test is a specific test for normality. Shapiro-Wilk test is a more powerful test for
normality when compared to Kolmogorov-Smirnov test (Marozzi, 2013).
c) What can you conclude?
Answer
We reject the null hypothesis in all the two cases (either using Kolmogorov-Smirnov test
or Shapiro-Wilk test). By rejecting the null hypothesis we conclude that the data on
spatial test scores does not follow a normal distribution.
Question 9 [10 marks]
A researcher conducted a study skills course over a period of five days among a group of
beginners, intermediate and advanced speakers of English. At the end of the programme he
administered a test to determine which group of students benefited from the programme.
The results of the study was analysed using One-Way ANOVA and the results are shown in the
tables below:
a) See Table 1 and answer the following questions:
i) State one research question for the study
Table 1
Table 1:
Gender Kolmogorov-Smirnova Shapiro-Wilk
Statistic df Sig. Statistic df Sig.
Spatial
Test
Scores
Male 0.879 34 0.012 0.971 78 0.016
Female 0.185 39 0.001 0.079 96 0.008
a. Lilliefors Significance Correction
Paraphrase This Document
Need a fresh take? Get an instant paraphrase of this document with our AI Paraphraser
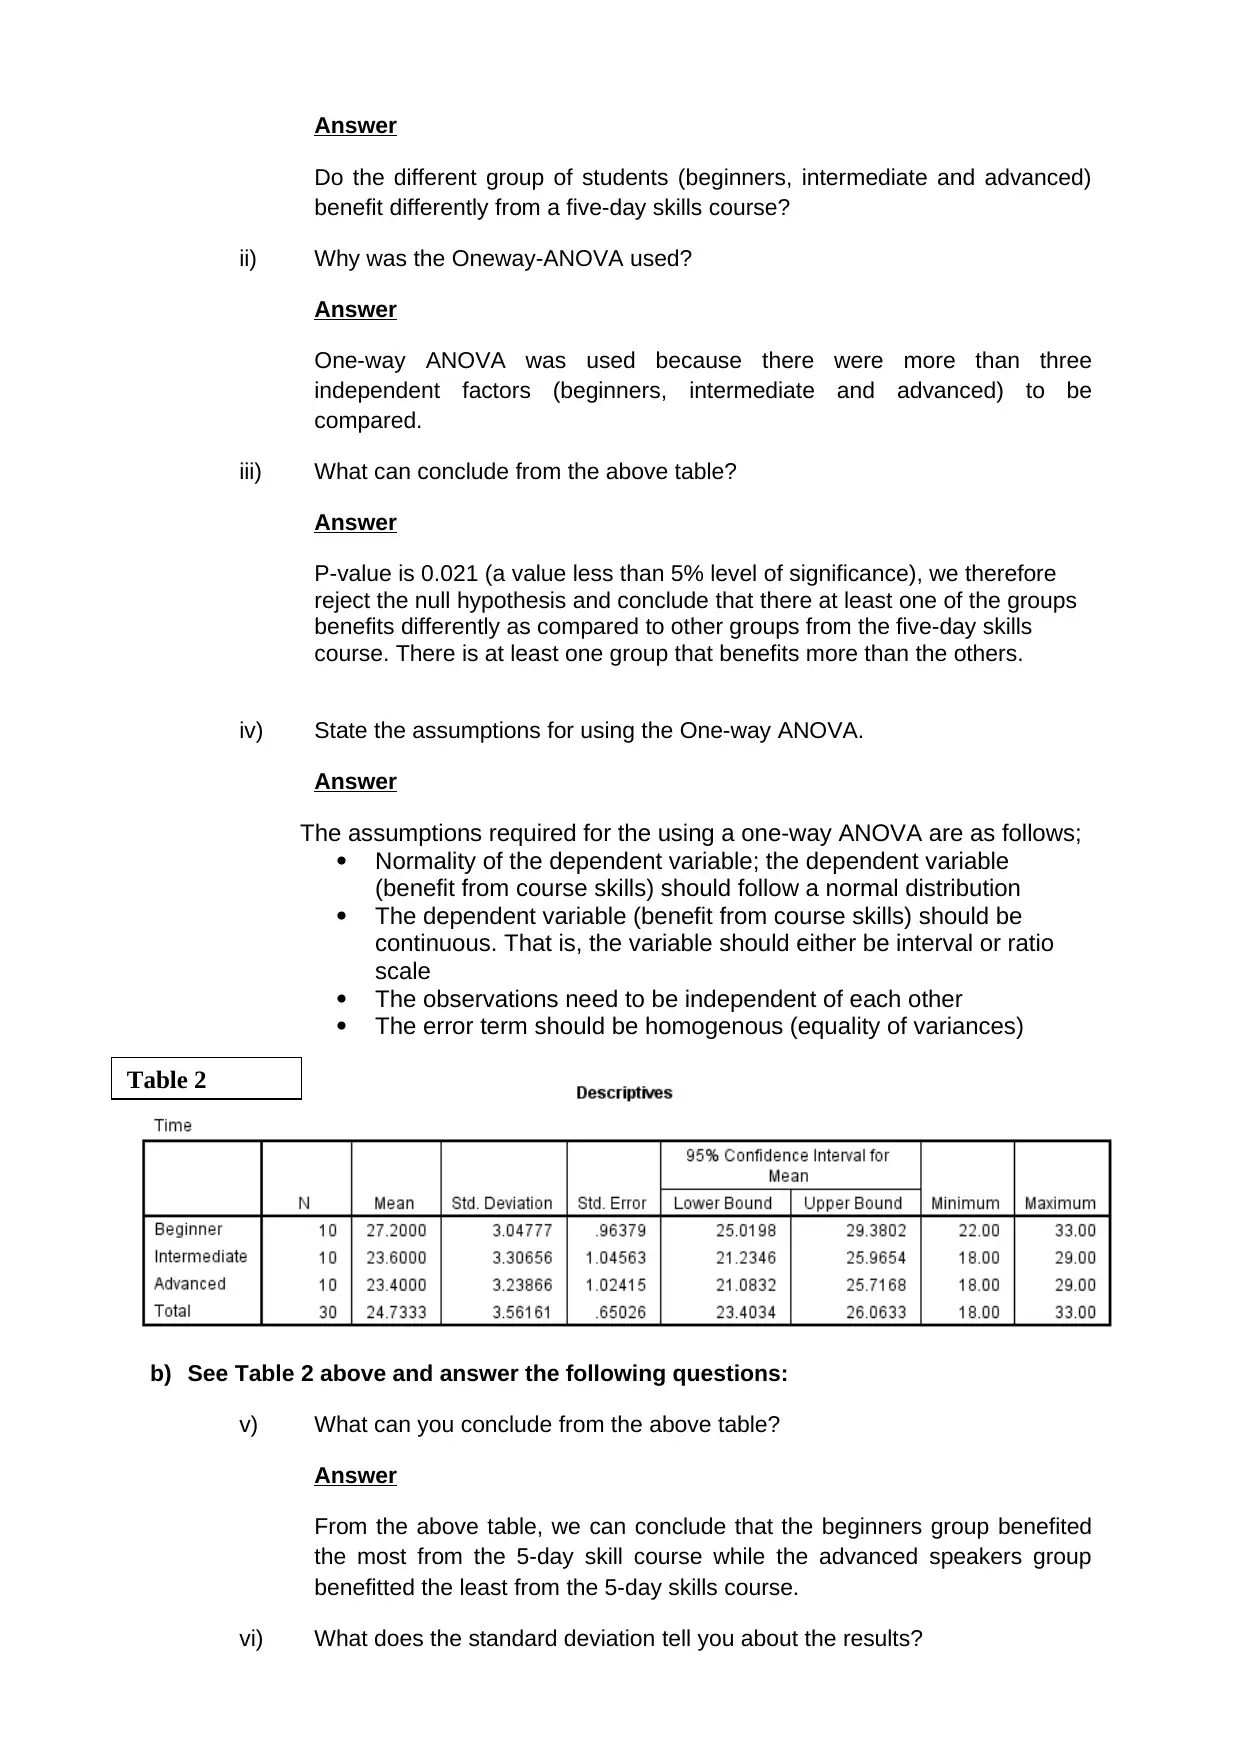
Answer
Do the different group of students (beginners, intermediate and advanced)
benefit differently from a five-day skills course?
ii) Why was the Oneway-ANOVA used?
Answer
One-way ANOVA was used because there were more than three
independent factors (beginners, intermediate and advanced) to be
compared.
iii) What can conclude from the above table?
Answer
P-value is 0.021 (a value less than 5% level of significance), we therefore
reject the null hypothesis and conclude that there at least one of the groups
benefits differently as compared to other groups from the five-day skills
course. There is at least one group that benefits more than the others.
iv) State the assumptions for using the One-way ANOVA.
Answer
The assumptions required for the using a one-way ANOVA are as follows;
Normality of the dependent variable; the dependent variable
(benefit from course skills) should follow a normal distribution
The dependent variable (benefit from course skills) should be
continuous. That is, the variable should either be interval or ratio
scale
The observations need to be independent of each other
The error term should be homogenous (equality of variances)
b) See Table 2 above and answer the following questions:
v) What can you conclude from the above table?
Answer
From the above table, we can conclude that the beginners group benefited
the most from the 5-day skill course while the advanced speakers group
benefitted the least from the 5-day skills course.
vi) What does the standard deviation tell you about the results?
Table 2
Answer
The standard deviations shows how spread out the data points are from the
mean. From what we see, it is clear that the data points for all the three
groups are not widely spread out from the mean as the standard deviation is
small compared to the mean.
vii) Explain the meaning of “95% confidence interval for mean”?
Answer
A 95% confidence interval for the mean refers to a range of values that an
individual can be 95% certain contains the true population mean (Morey, et
al., 2016). For the beginners, we are 95% confident that the true population
mean is between 25.02 and 29.38. We are 95% confident that the true
population mean for the intermediate group is between 21.23 and 25.97. We
are also 95% confident that the true population mean for the advanced
group is between 21.08 and 25.72. Lastly, we are 95% confident that the
true population mean for the entire sample is between 23.40 and 26.06.
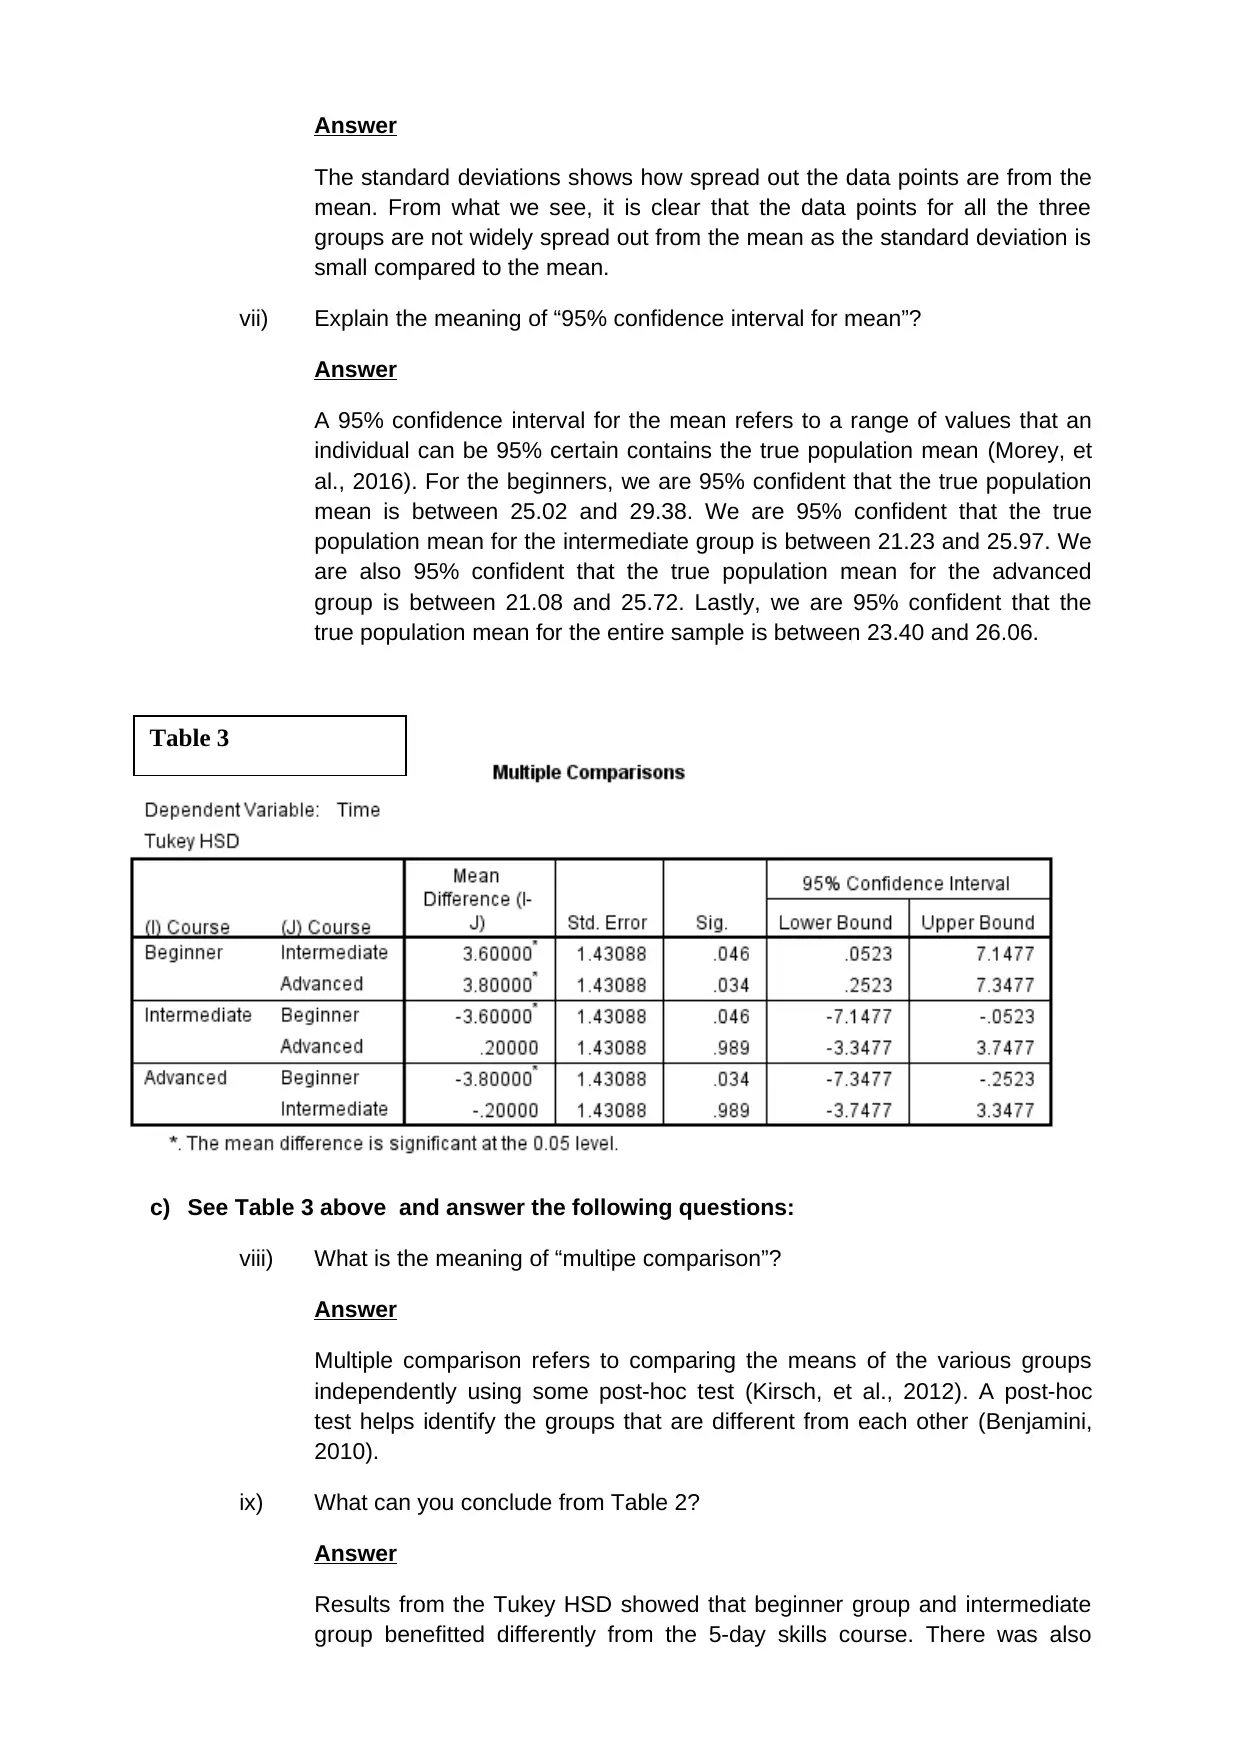
c) See Table 3 above and answer the following questions:
viii) What is the meaning of “multipe comparison”?
Answer
Multiple comparison refers to comparing the means of the various groups
independently using some post-hoc test (Kirsch, et al., 2012). A post-hoc
test helps identify the groups that are different from each other (Benjamini,
2010).
ix) What can you conclude from Table 2?
Answer
Results from the Tukey HSD showed that beginner group and intermediate
group benefitted differently from the 5-day skills course. There was also
Table 3
The standard deviations shows how spread out the data points are from the
mean. From what we see, it is clear that the data points for all the three
groups are not widely spread out from the mean as the standard deviation is
small compared to the mean.
vii) Explain the meaning of “95% confidence interval for mean”?
Answer
A 95% confidence interval for the mean refers to a range of values that an
individual can be 95% certain contains the true population mean (Morey, et
al., 2016). For the beginners, we are 95% confident that the true population
mean is between 25.02 and 29.38. We are 95% confident that the true
population mean for the intermediate group is between 21.23 and 25.97. We
are also 95% confident that the true population mean for the advanced
group is between 21.08 and 25.72. Lastly, we are 95% confident that the
true population mean for the entire sample is between 23.40 and 26.06.
c) See Table 3 above and answer the following questions:
viii) What is the meaning of “multipe comparison”?
Answer
Multiple comparison refers to comparing the means of the various groups
independently using some post-hoc test (Kirsch, et al., 2012). A post-hoc
test helps identify the groups that are different from each other (Benjamini,
2010).
ix) What can you conclude from Table 2?
Answer
Results from the Tukey HSD showed that beginner group and intermediate
group benefitted differently from the 5-day skills course. There was also
Table 3
⊘ This is a preview!⊘
Do you want full access?
Subscribe today to unlock all pages.
Trusted by 1+ million students worldwide
significant difference in the 5-day skills course benefit between beginner and
advanced groups.
x) Answer the Research Question stated in a (i)?
Answer
Yes the different groups of students (beginners, intermediate and advanced)
benefitted differently from a five-day skills course. When all the three groups
are compared, the beginners group benefitted the most while the advanced
group benefitted the least.
Question 10 [5 marks]
Spatial
Reasoning
Memor
y
Metacogniton Mathematical
ability
Verbal
reasoning
Spatial reasoning
Memory 0.56
Metacognition 0,65 0.67
Mathematical
ability
0.43 0.60 0.59 .
Verbal reasoning 0.34 0.41 0.49 0.70
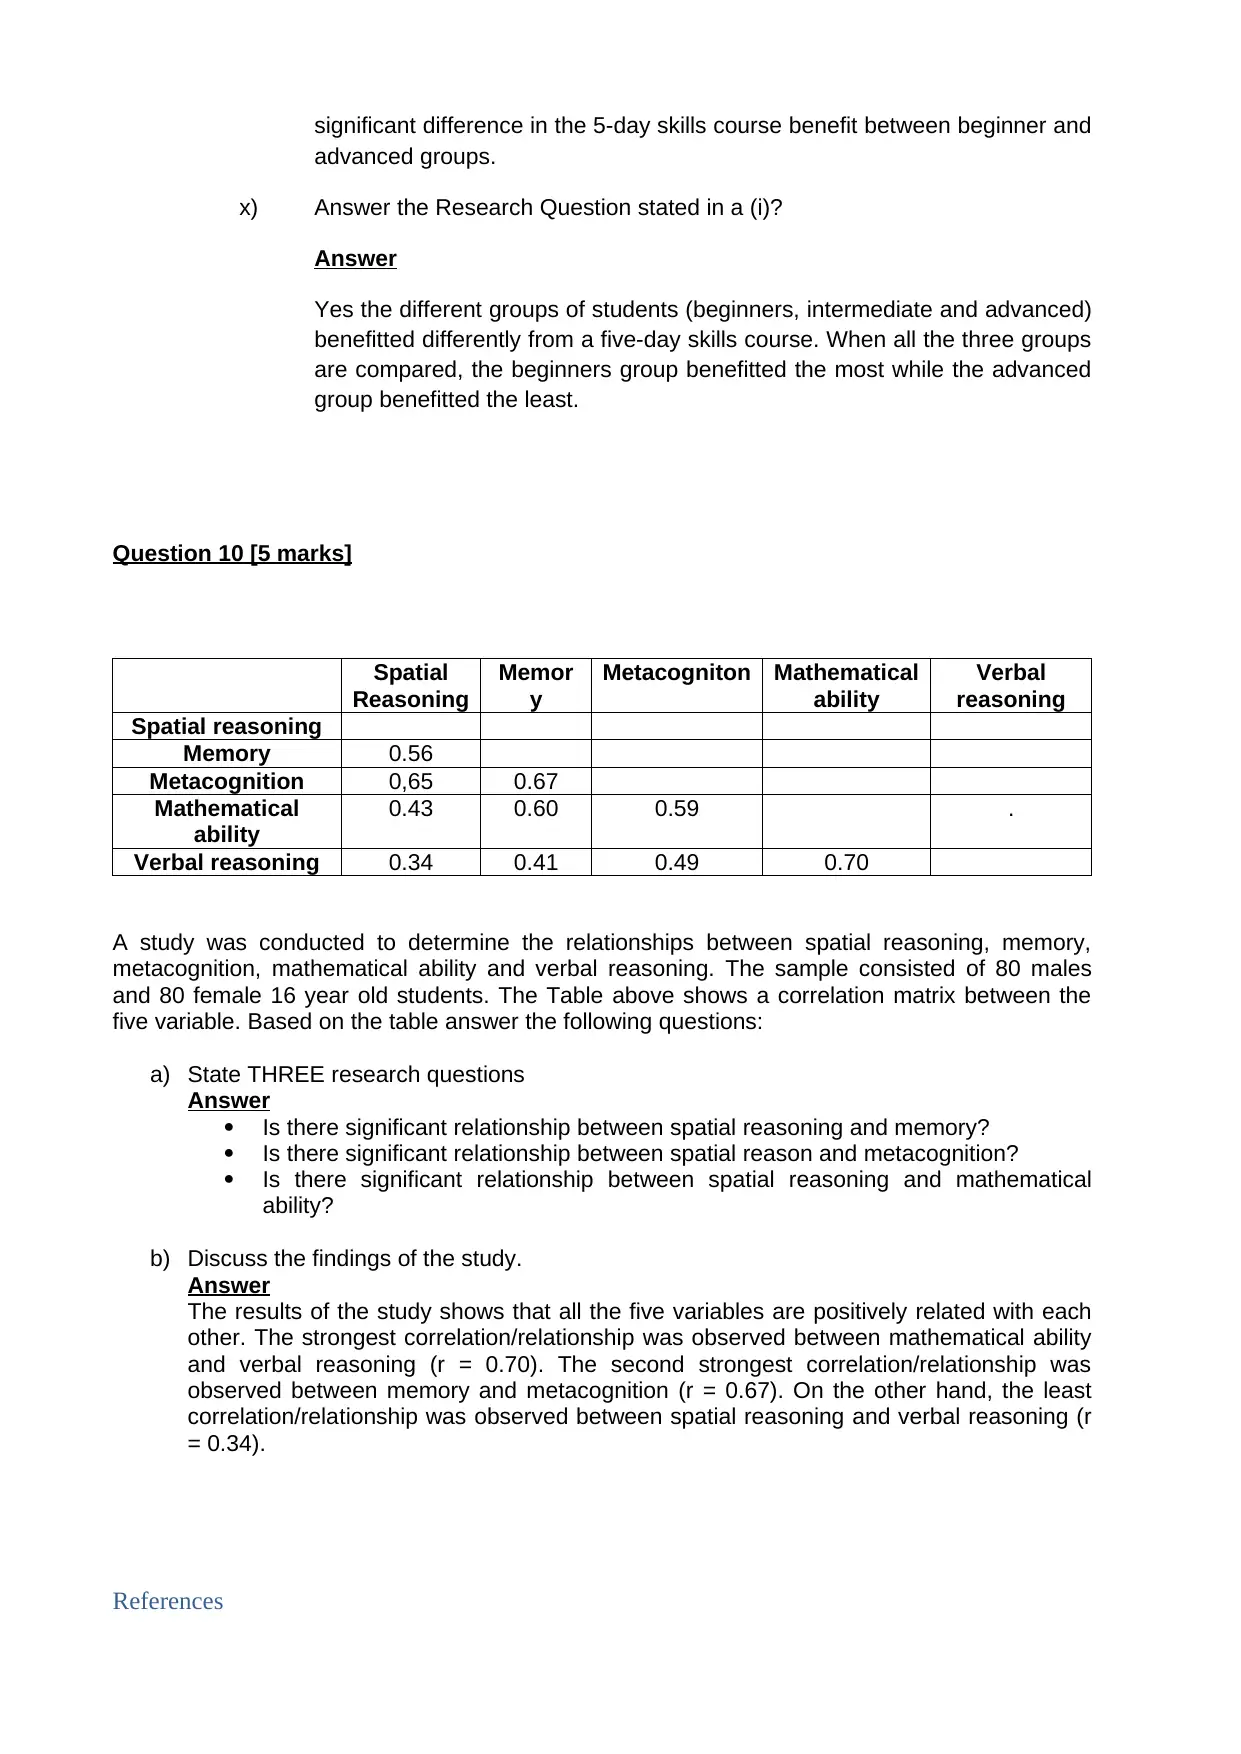
A study was conducted to determine the relationships between spatial reasoning, memory,
metacognition, mathematical ability and verbal reasoning. The sample consisted of 80 males
and 80 female 16 year old students. The Table above shows a correlation matrix between the
five variable. Based on the table answer the following questions:
a) State THREE research questions
Answer
Is there significant relationship between spatial reasoning and memory?
Is there significant relationship between spatial reason and metacognition?
Is there significant relationship between spatial reasoning and mathematical
ability?
b) Discuss the findings of the study.
Answer
The results of the study shows that all the five variables are positively related with each
other. The strongest correlation/relationship was observed between mathematical ability
and verbal reasoning (r = 0.70). The second strongest correlation/relationship was
observed between memory and metacognition (r = 0.67). On the other hand, the least
correlation/relationship was observed between spatial reasoning and verbal reasoning (r
= 0.34).
References
advanced groups.
x) Answer the Research Question stated in a (i)?
Answer
Yes the different groups of students (beginners, intermediate and advanced)
benefitted differently from a five-day skills course. When all the three groups
are compared, the beginners group benefitted the most while the advanced
group benefitted the least.
Question 10 [5 marks]
Spatial
Reasoning
Memor
y
Metacogniton Mathematical
ability
Verbal
reasoning
Spatial reasoning
Memory 0.56
Metacognition 0,65 0.67
Mathematical
ability
0.43 0.60 0.59 .
Verbal reasoning 0.34 0.41 0.49 0.70
A study was conducted to determine the relationships between spatial reasoning, memory,
metacognition, mathematical ability and verbal reasoning. The sample consisted of 80 males
and 80 female 16 year old students. The Table above shows a correlation matrix between the
five variable. Based on the table answer the following questions:
a) State THREE research questions
Answer
Is there significant relationship between spatial reasoning and memory?
Is there significant relationship between spatial reason and metacognition?
Is there significant relationship between spatial reasoning and mathematical
ability?
b) Discuss the findings of the study.
Answer
The results of the study shows that all the five variables are positively related with each
other. The strongest correlation/relationship was observed between mathematical ability
and verbal reasoning (r = 0.70). The second strongest correlation/relationship was
observed between memory and metacognition (r = 0.67). On the other hand, the least
correlation/relationship was observed between spatial reasoning and verbal reasoning (r
= 0.34).
References
Paraphrase This Document
Need a fresh take? Get an instant paraphrase of this document with our AI Paraphraser
Benjamini, Y., 2010. Simultaneous and selective inference: Current successes and future
challenges. Biometrical Journal, 52(6), p. 708–721.
Berk, R. A., 2007. Regression Analysis: A Constructive Critique. Criminal Justice Review, 32(3),
p. 301–302.
Kirsch, A. et al., 2012. An Efficient Rigorous Approach for Identifying Statistically Significant
Frequent Itemsets. Journal of the ACM, 59(3), p. 1–12:22.
Lumley, T., Diehr, P., Emerson, S. & Chen, L., 2012. The Importance of the Normality
Assumption in Large Public Health Data Sets. Annual Review of Public Health, 23(1), p. 151–
169.
Marozzi, M., 2013. Nonparametric Simultaneous Tests for Location and Scale Testing: a
Comparison of Several Methods. Communications in Statistics – Simulation and Computation,
42(6), p. 1298–1317.
Morey, R. D. et al., 2016. The Fallacy of Placing Confidence in Confidence Intervals.
Psychonomic Bulletin & Review, 23(1), p. 103–123.
Tofallis, C., 2009. Least Squares Percentage Regression. Journal of Modern Applied Statistical
Methods, 7(5), p. 526–534.
Warne, R. T., 2011. Beyond multiple regression: Using commonality analysis to better
understand R2 results. Gifted Child Quarterly, 55(4), p. 313–318.
Wilkinson, L., 2009. Statistical Methods in Psychology Journals; Guidelines and Explanations.
American Psychologist, 5(8), p. 594–604.
Zimmerman, D. W., 2018. Invalidation of Parametric and Nonparametric Statistical Tests by
Concurrent Violation of Two Assumptions. The Journal of Experimental Education, 67(1), p.
55–68.
1 out of 11
Related Documents


Your All-in-One AI-Powered Toolkit for Academic Success.
+13062052269
info@desklib.com
Available 24*7 on WhatsApp / Email
![[object Object]](/_next/static/media/star-bottom.7253800d.svg)
Unlock your academic potential
Copyright © 2020–2026 A2Z Services. All Rights Reserved. Developed and managed by ZUCOL.