Statistics Homework: Two-Sample Inference, Chi-Square, and ANOVA

Verified

Added on  2023/05/29

|13
|1500
|147
Homework Assignment
AI Summary
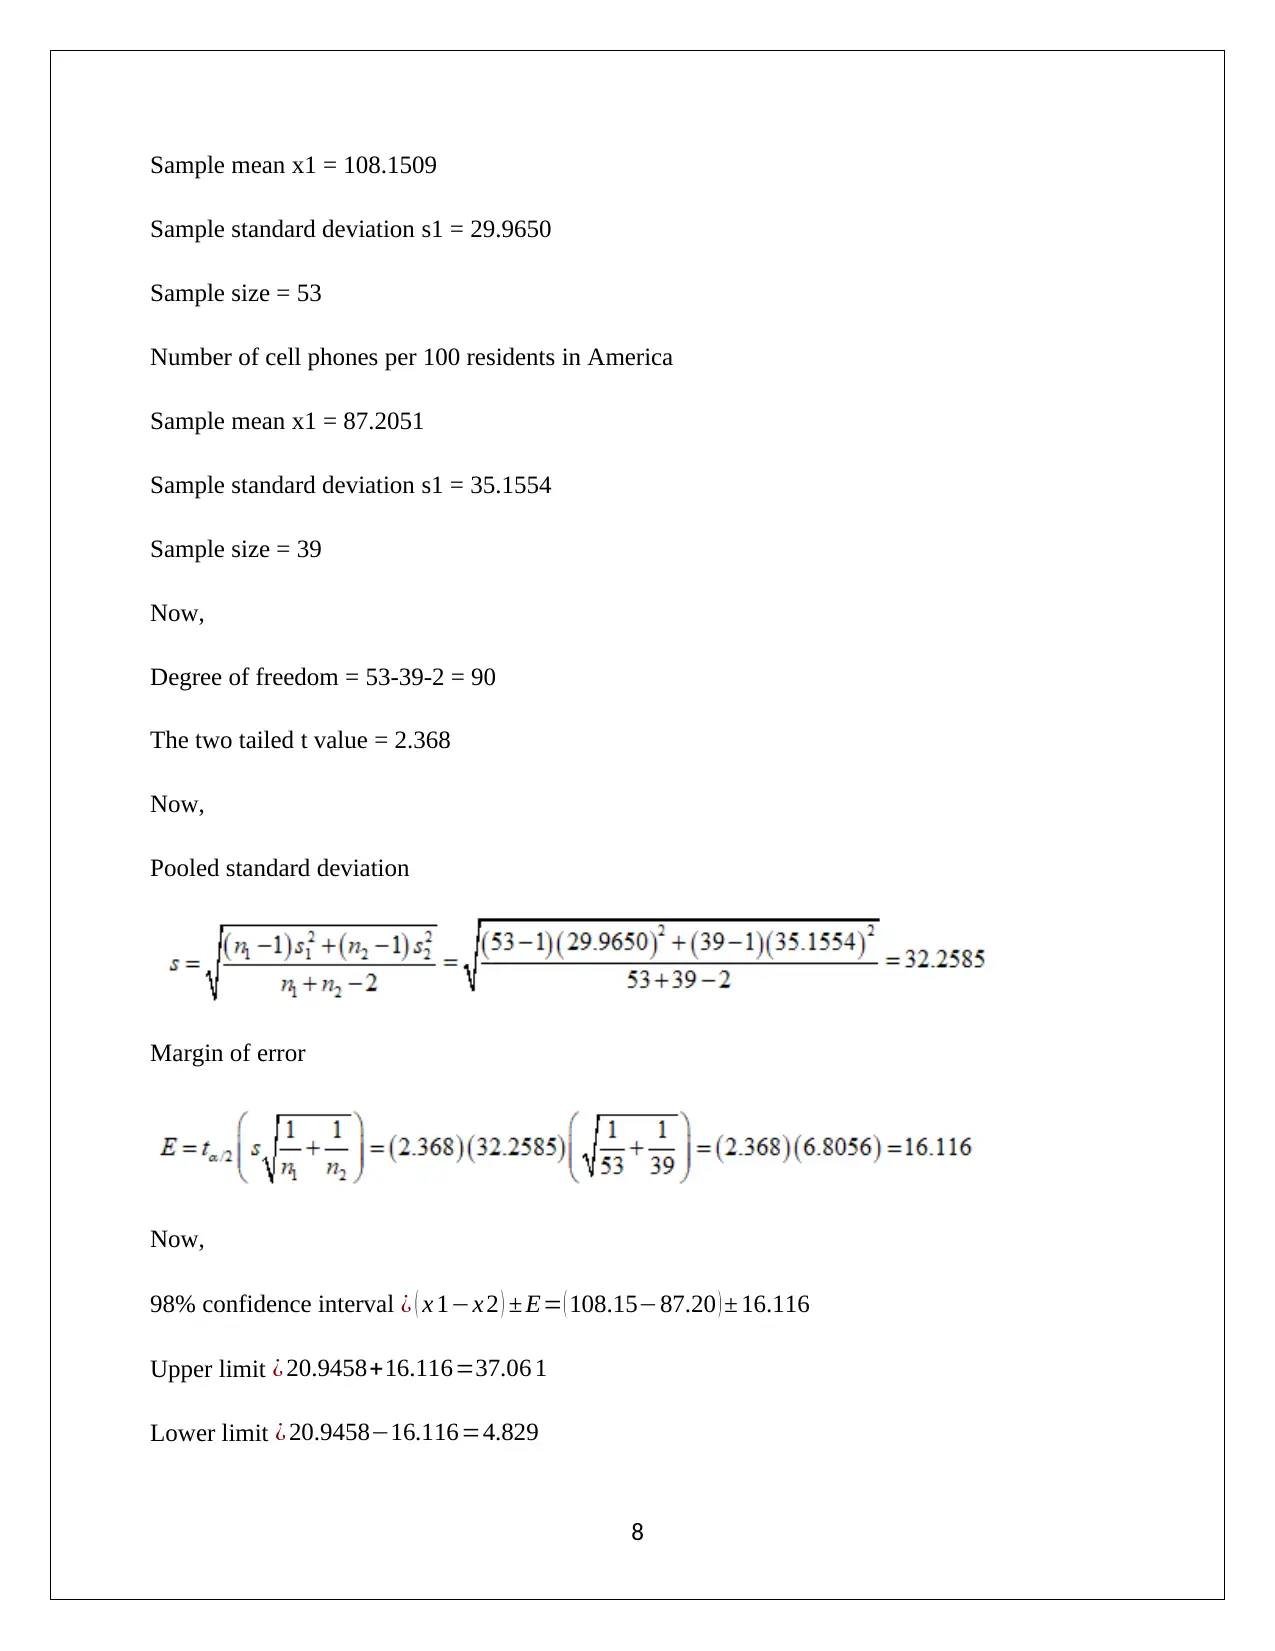
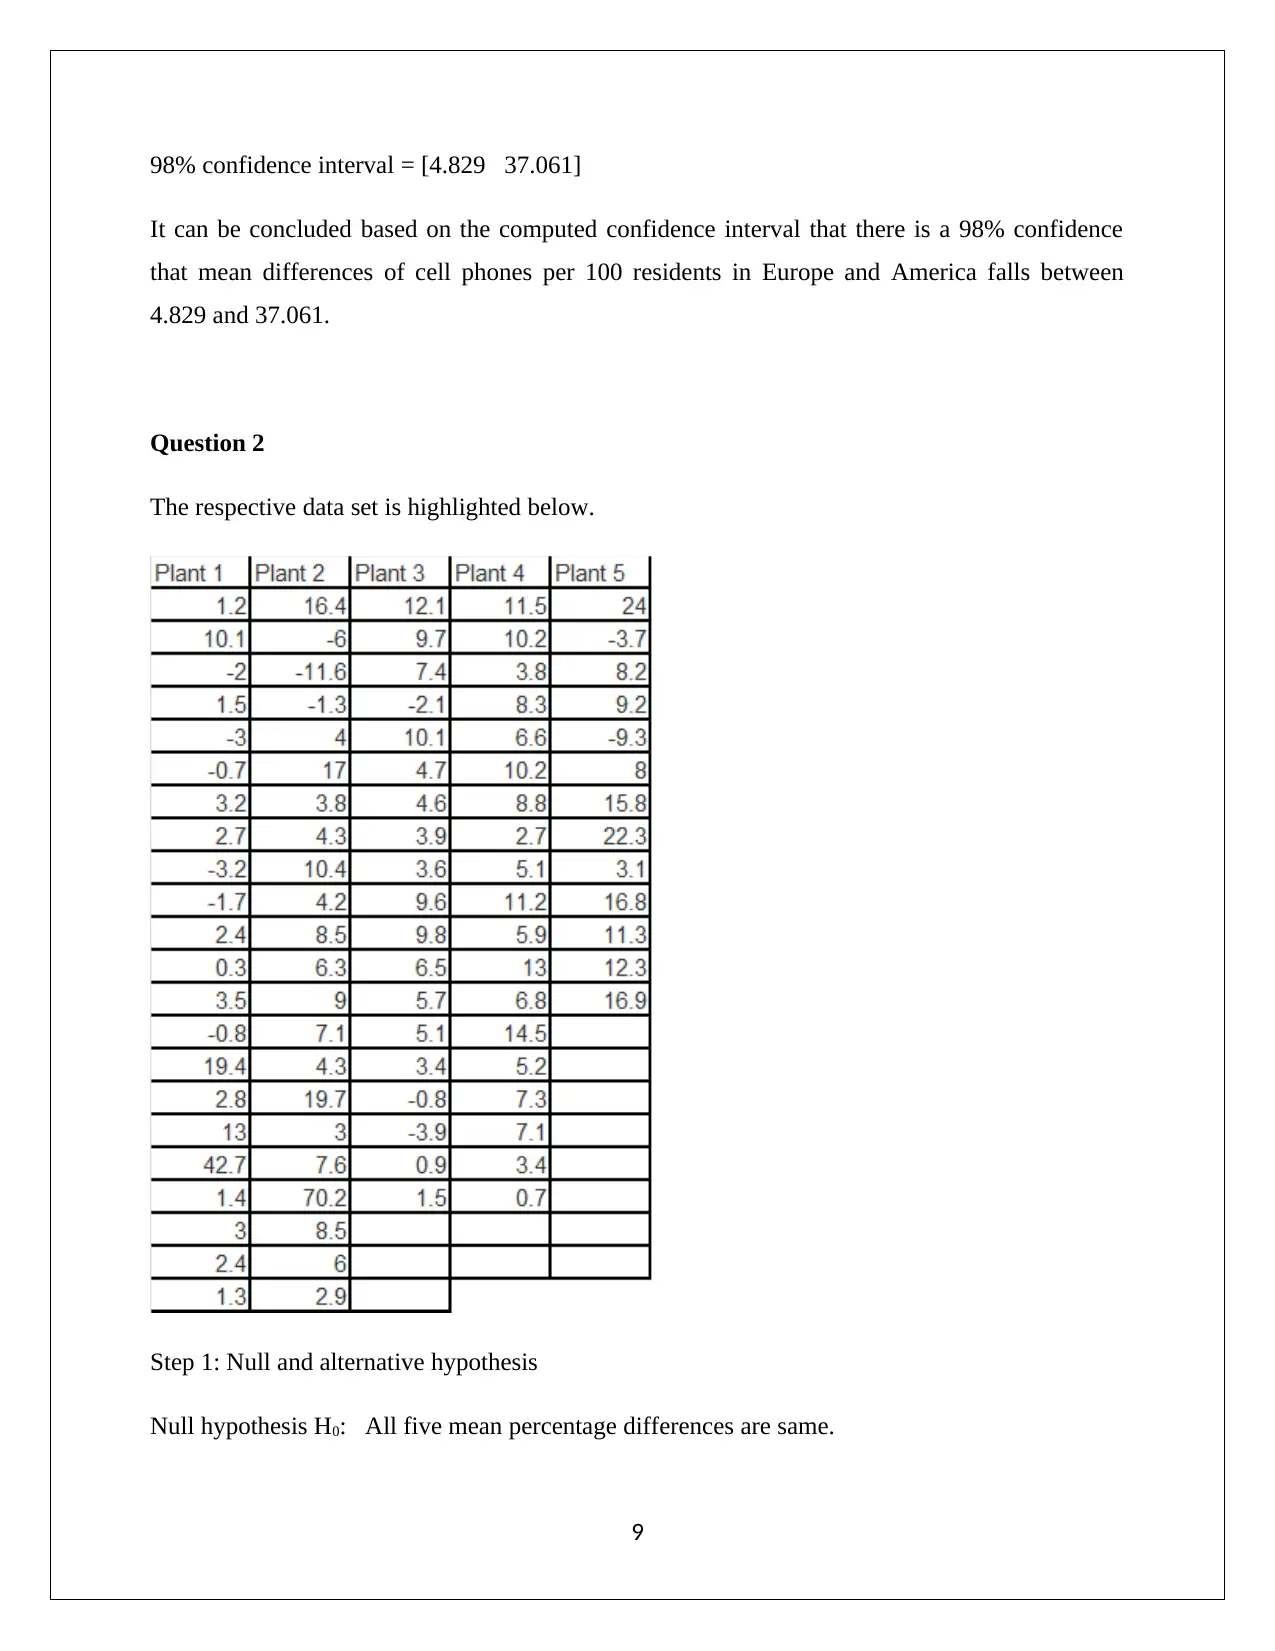
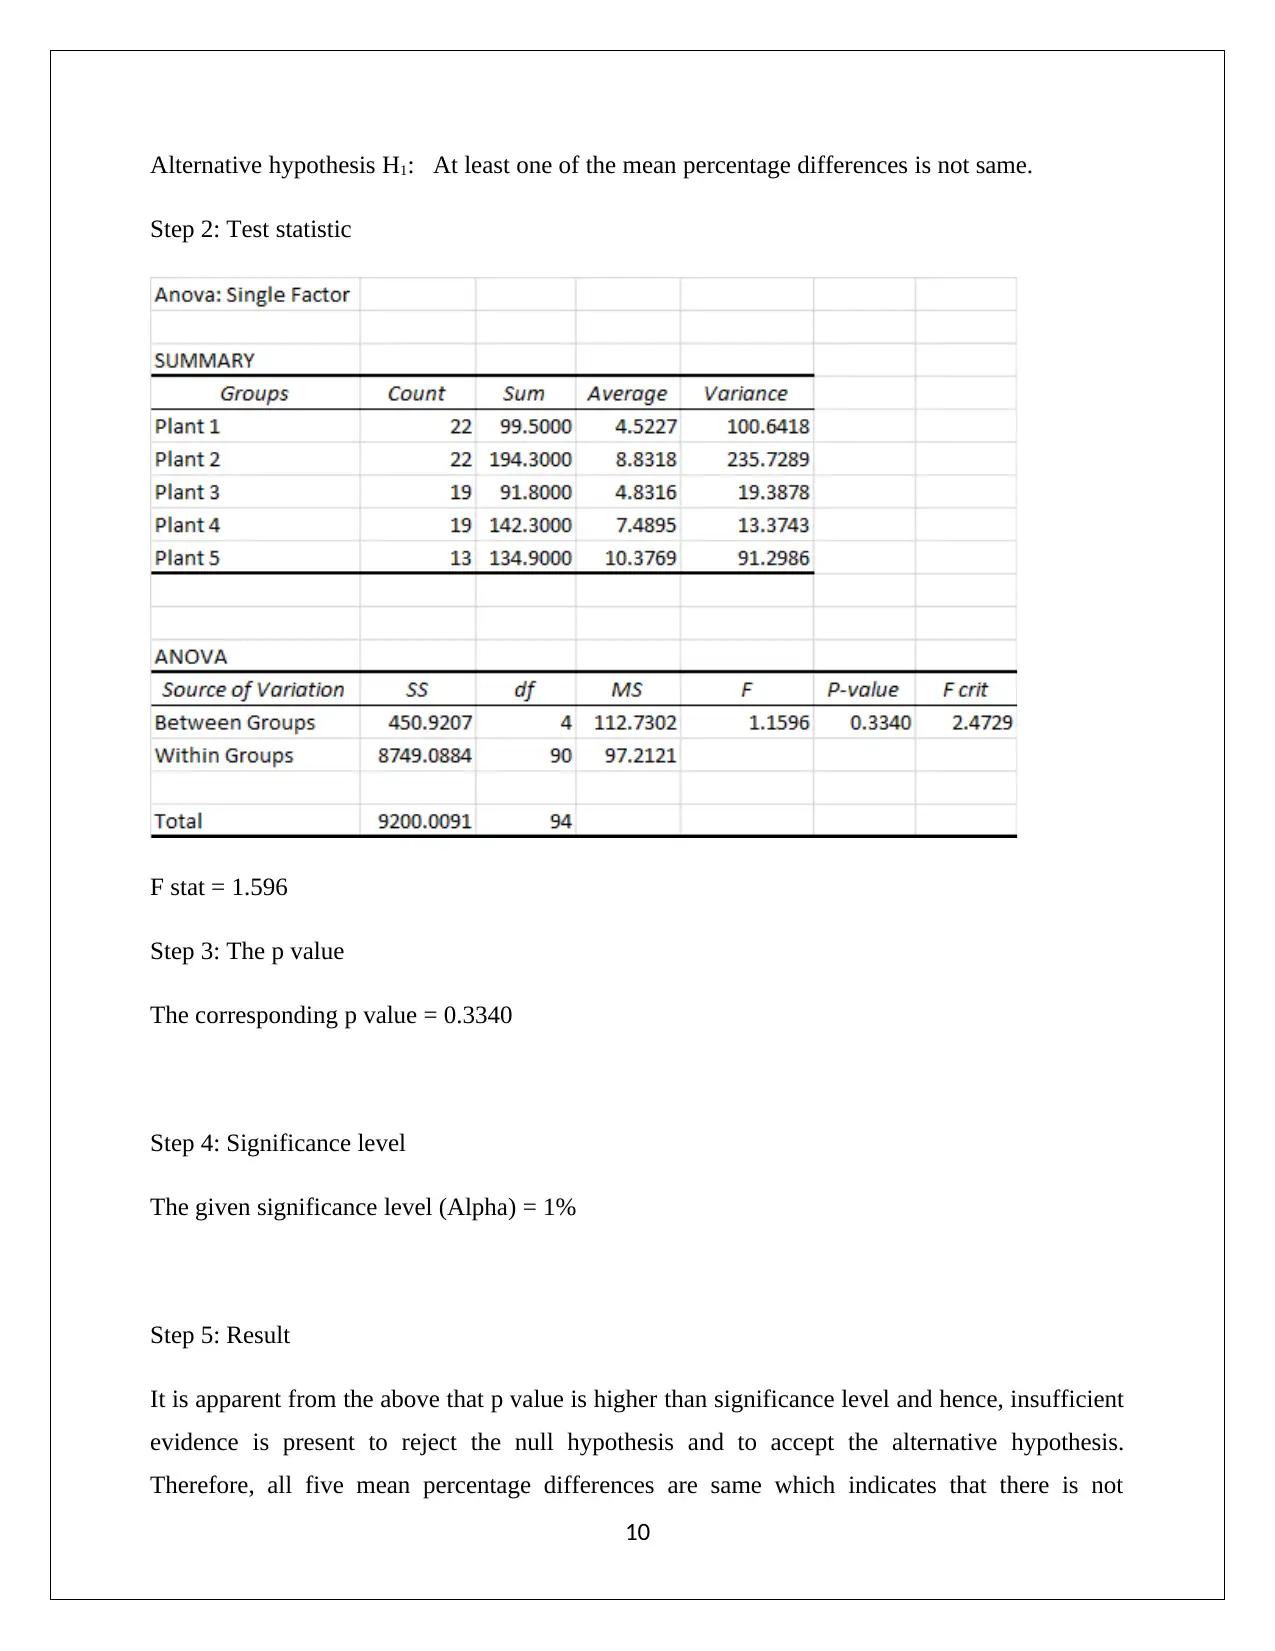
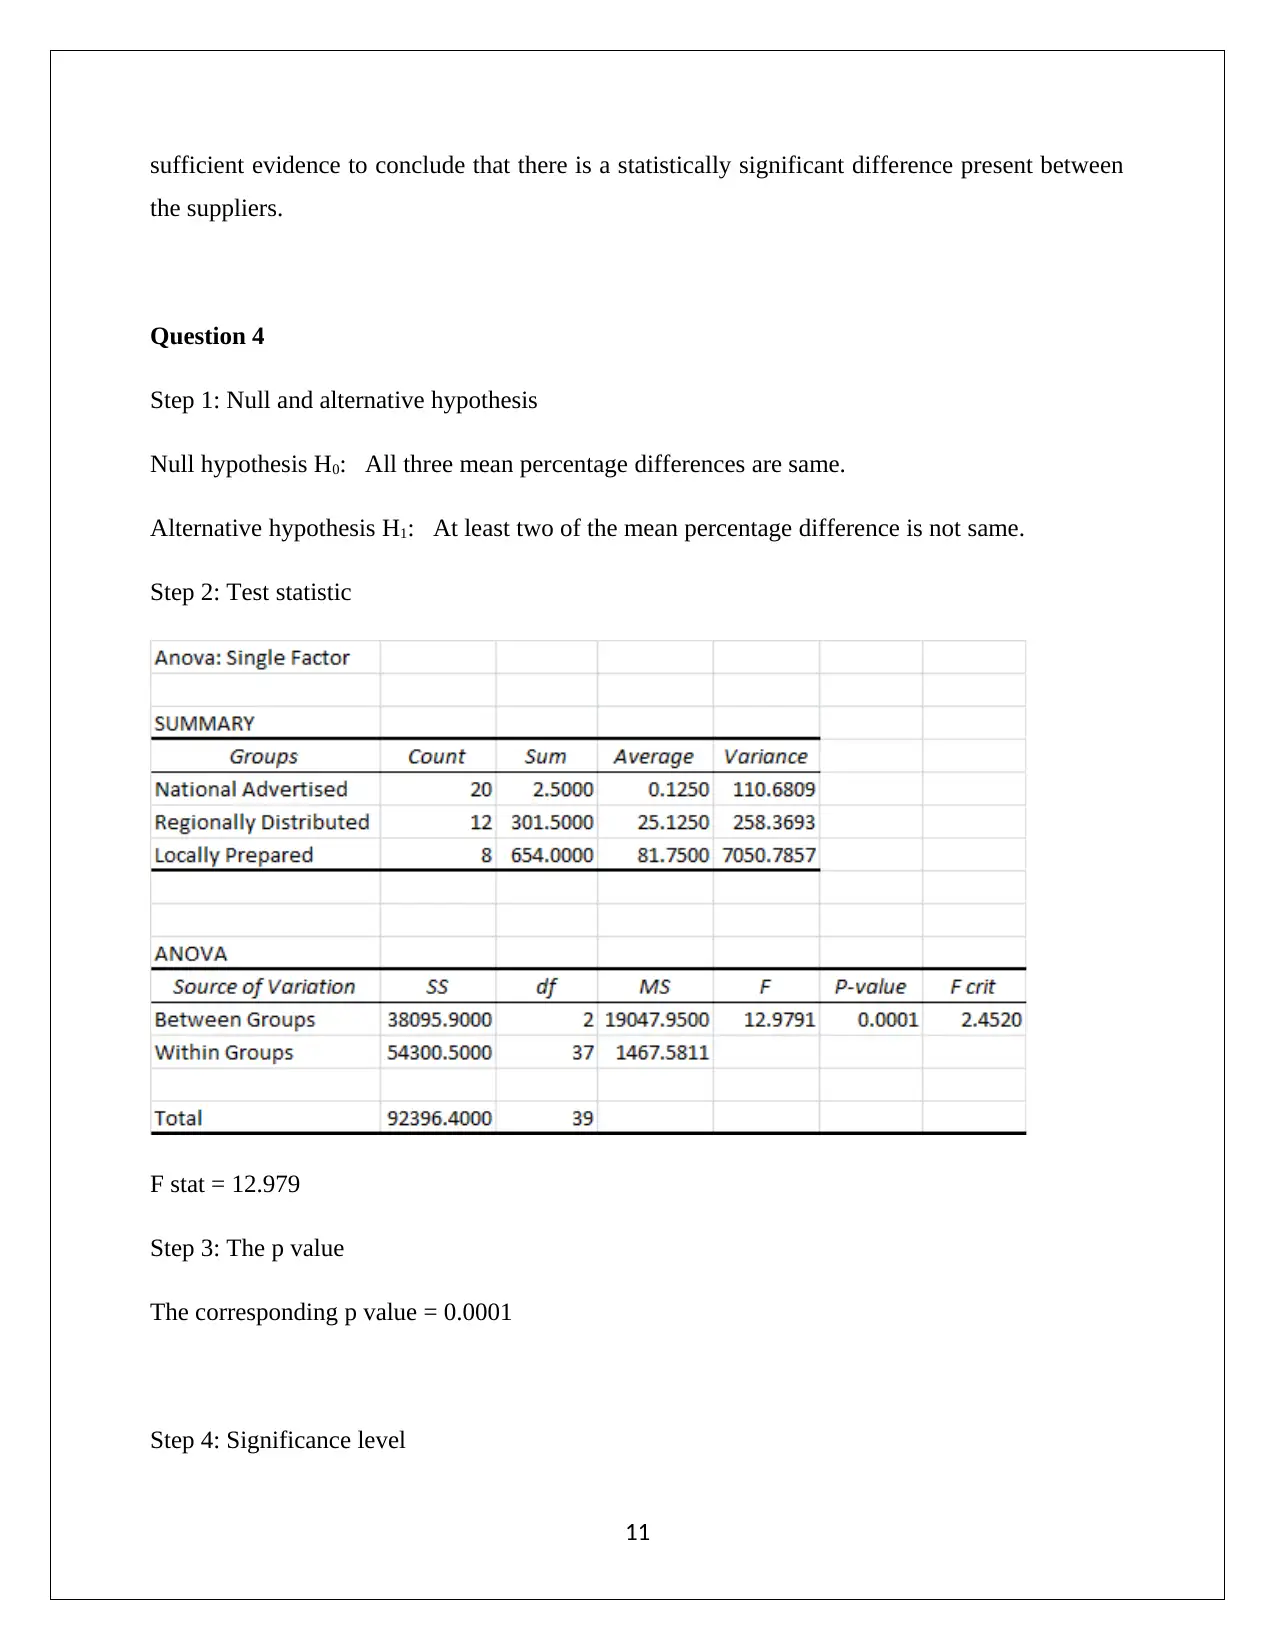
This statistics assignment provides solutions to problems related to two-sample inference, chi-square tests, and ANOVA. It includes hypothesis testing and confidence interval calculations for various scenarios. The problems cover topics such as comparing the proportion of female students in different exams, determining if the proportion of children diagnosed with ASD differs between states, comparing fish wholesaler prices, analyzing income differences between genders, assessing brain volume differences in patients with schizophrenia, comparing cell phone usage in Europe and America, and evaluating percentage differences between suppliers. Each problem includes a null and alternative hypothesis, test statistic calculation, p-value determination, and a conclusion based on a significance level. The assignment demonstrates the application of statistical methods to real-world problems and provides detailed steps for solving each problem. Desklib provides students access to past papers and solved assignments.
tabler-icon-diamond-filled.svg

Contribute Materials

Your contribution can guide someone’s learning journey. Share your documents today.
Document Page
STATISTICS
STUDENT NAME/ID
[Pick the date]
tabler-icon-diamond-filled.svg

Secure Best Marks with AI Grader

Need help grading? Try our AI Grader for instant feedback on your assignments.
Document Page
Question 2
Total number of student those took biology exam n1= 144,796
Total number of female student those took biology exam x1=84,199
Total number of student those took AB exam n2= 211,693
Total number of female student those took AB exam x2=102,598
90% confidence interval for the difference in the proportion of female students taking biology
exam and AB exam =?
Proportion of female student those took biology exam p1= x1/n1 = 84199/144796= 0.5815
Proportion of female student those took biology exam p2= x1/n1 = 102598/211693=0.4847
The z value for 90% confidence interval = 1.645
Standard error = 0.5815(10.5815)
144796 + 0.4847 (10.4847)
211693 =0.0017
Lower limit of 90% confidence interval = (0.5815-0.4847) – (1.645 * ) = 0.0941
Upper limit of 90% confidence interval= (0.5815-0.4847) + (1.645 * )= 0.0996
Hence, 90% confidence interval =[0.0941 0.0996].
Question 5
Step 1: Null and alternative hypothesis
Null hypothesis H0: p1-p2 = 0
Alternative hypothesis H1: p1-p2 > 0
Step 2: Test statistic
n1 = 18440
1
Document Page
x1 = 245
p1=245/18440 =0.01328
Now,
n2=2123
x2=45
p2 =45/2123 =0.021196
Pooled proportion p = (245+45)/(18440+2123) = 0.014103
The z value
Z value = -2.92699
Step 3: The p value
The corresponding two tailed p value = 0.998
Step 4: Significance level
The given significance level (Alpha) = 1%
Step 5: Result
It is apparent from the above that p value is higher than significance level and hence, insufficient
evidence is present to reject the null hypothesis and to accept the alternative hypothesis.
Therefore, “it cannot be said that proportion of children diagnosed with ASD in Pennsylvania is
higher than the proportion of children those are diagnosed with ASD in Utah.”
Question 3
2
Document Page
Claim- West fish wholesaler is more expensive than an east fish wholesaler.
Step 1: Null and alternative hypothesis
Null hypothesis H0: μ1- μ 2 = 0
Alternative hypothesis H1: μ1- μ 2 > 0
Step 2: Test statistic
Sample mean difference x(d) =22.01/8 = 2.445
Sample standard deviation difference = sqrt{(491.84 – (22.01^2)/9}/8 = 7.3994
The t stat = (2.445-0)/(7.3994/ sqrt(9)) = 0.9915
Degree of freedom = 9-1= 8
Step 3: The p value
The corresponding two tailed p value = 0.1752
Step 4: Significance level
3
tabler-icon-diamond-filled.svg

Secure Best Marks with AI Grader

Need help grading? Try our AI Grader for instant feedback on your assignments.
Document Page
The given significance level (Alpha) = 5%
Step 5: Result
It is apparent from the above that p value is higher than significance level and hence, insufficient
evidence is present to reject the null hypothesis and to accept the alternative hypothesis.
Therefore, “it cannot be said that west fish wholesaler is more expensive than an east fish
wholesaler.”
Question 6
Mean difference in traffic count between 6th and 13th = 128385.3 -126549.5= 1835.8
Question 1
Significance level = 1%
Claim- Mean income of males is more than mean income of female.
Step 1: Null and alternative hypothesis
Null hypothesis H0: μ1=μ 2
4
Document Page
Alternative hypothesis H1: μ1>μ 2
Step 2: Test statistic
n1 =52
x1 = 46,453
s1 = 7031
Now,
n2=52
x2=36,511
s2 = 6138
Difference of mean = x1-x2 = 9942
Standard error = sqrt{((7031^2)/52)+((6135^2)/52)} =1294.02
The t stat = 9935/1294.02 = 7.68
Degree of freedom = 52+52-2 =102
Step 3: The p value
The p value = 0.00
Step 4: Significance level
The given significance level (Alpha) = 5%
Step 5: Result
It is apparent from the above that p value is lower than significance level and hence, sufficient
evidence is present to reject the null hypothesis and to accept the alternative hypothesis.
Therefore, “it cannot be said that mean income of males is more than mean income of female.”
5
Document Page
Question 1
Step 1: Null and alternative hypothesis
Null hypothesis H0: μ1=μ 2
Alternative hypothesis H1: μ1- μ 2 > 0
Step 2: Test statistic
Let X = Brain volume of normal patients
Y = Brain volume of schizophrenia patients
Summary statistics
Brain volume of normal patients (X)
Mean = 1,463,339.2
Standard deviation = 125,458.28
Sample size = 32
Now,
Brain volume of schizophrenia patients
Brain volume of normal patients (X)
Mean = 1,451,293.2
Standard deviation = 171,932.23
Sample size = 31
Poled variance = {((31*125458^2) + (30*171932^2)}/(31+30) = 2,253,685,105
Standard error of the difference of the mean = sqrt((2,253,685,105/((1/32)+(1/31))) = 37,832.17
The t stat = (1463339-1451293)/ 37,832.17 = 0.3184
6
tabler-icon-diamond-filled.svg

Paraphrase This Document

Need a fresh take? Get an instant paraphrase of this document with our AI Paraphraser
Document Page
Step 3: The p value
The corresponding right tailed p value = 0.376
Step 4: Significance level
The given significance level (Alpha) = 10%
Step 5: Result
It is apparent from the above that p value is higher than significance level and hence, insufficient
evidence is present to reject the null hypothesis and to accept the alternative hypothesis.
Therefore, “it cannot be said that patient with schizophrenia have less TBV on average a
compared with the patient who is normal.”
Question 4
90% confidence interval for the difference in TBV of normal patients with the patient those has
schizophrenia
The t value for 90% confidence interval = 1.813
Standard error of the difference of the mean = sqrt((2,253,685,105/((1/32)+(1/31))) = 37,832.17
The mean difference = (1463339-1451293)=12046
Lower limit of 90% confidence interval =12046 – (1.813 *37,832.17)=-56543.7
Upper limit of 90% confidence interval=12046 + (1.813 *37,832.17)=80635.7
Hence, 90% confidence interval = [-56543.7 80635.7]
Question 8
Number of cell phones per 100 residents in Europe
7
Document Page
Sample mean x1 = 108.1509
Sample standard deviation s1 = 29.9650
Sample size = 53
Number of cell phones per 100 residents in America
Sample mean x1 = 87.2051
Sample standard deviation s1 = 35.1554
Sample size = 39
Now,
Degree of freedom = 53-39-2 = 90
The two tailed t value = 2.368
Now,
Pooled standard deviation
Margin of error
Now,
98% confidence interval ¿ ( x 1x 2 ) ± E= ( 108.1587.20 ) ± 16.116
Upper limit ¿ 20.9458+16.116=37.06 1
Lower limit ¿ 20.945816.116=4.829
8
Document Page
98% confidence interval = [4.829 37.061]
It can be concluded based on the computed confidence interval that there is a 98% confidence
that mean differences of cell phones per 100 residents in Europe and America falls between
4.829 and 37.061.
Question 2
The respective data set is highlighted below.
Step 1: Null and alternative hypothesis
Null hypothesis H0: All five mean percentage differences are same.
9
tabler-icon-diamond-filled.svg

Secure Best Marks with AI Grader

Need help grading? Try our AI Grader for instant feedback on your assignments.
Document Page
Alternative hypothesis H1: At least one of the mean percentage differences is not same.
Step 2: Test statistic
F stat = 1.596
Step 3: The p value
The corresponding p value = 0.3340
Step 4: Significance level
The given significance level (Alpha) = 1%
Step 5: Result
It is apparent from the above that p value is higher than significance level and hence, insufficient
evidence is present to reject the null hypothesis and to accept the alternative hypothesis.
Therefore, all five mean percentage differences are same which indicates that there is not
10
Document Page
sufficient evidence to conclude that there is a statistically significant difference present between
the suppliers.
Question 4
Step 1: Null and alternative hypothesis
Null hypothesis H0: All three mean percentage differences are same.
Alternative hypothesis H1: At least two of the mean percentage difference is not same.
Step 2: Test statistic
F stat = 12.979
Step 3: The p value
The corresponding p value = 0.0001
Step 4: Significance level
11
Document Page
The given significance level (Alpha) = 10%
Step 5: Result
It is apparent from the above that p value is lower than significance level and hence, sufficient
evidence is present to reject the null hypothesis and to accept the alternative hypothesis.
Therefore, it can be conclude that at least two of the mean percentage differences between the
three groups is not same.
12
chevron_up_icon
1 out of 13
circle_padding
hide_on_mobile
zoom_out_icon
logo.png

Your All-in-One AI-Powered Toolkit for Academic Success.

Available 24*7 on WhatsApp / Email

[object Object]