Statistics for Management: CPI, RPI, and Inflation Analysis
VerifiedAdded on 2020/10/04
|16
|3449
|157
Report
AI Summary
This report presents a comprehensive analysis of statistical concepts relevant to management, focusing on consumer price index (CPI), retail price index (RPI), and inflation. The assignment begins with an exploration of CPI, CPIH, and RPI data from the Office for National Statistics (ONS), examining changes from 2007 to 2017 and highlighting the differences between CPI and RPI. It then delves into the calculation and interpretation of annual inflation using CPI data. Furthermore, the report includes a statistical analysis of hourly earnings, using ogive graphs to estimate the median and quartiles. This section also calculates the mean and standard deviation of hourly earnings and compares earnings between Manchester and London. The assignment also applies a paired t-test to analyze data, assesses the test under normal conditions, and computes a 99% confidence interval. Finally, it presents charts illustrating changes in CPI, CPIH, and RPI over the specified period and includes an ogive graph for cumulative staff percentages versus hourly earnings, concluding with a summary of the findings and relevant references.
STATISTICS FOR
MANAGEMENT
MANAGEMENT
Paraphrase This Document
Need a fresh take? Get an instant paraphrase of this document with our AI Paraphraser
TABLE OF CONTENTS
INTRODUCTION...........................................................................................................................1
ACTIVITY 1 ...................................................................................................................................1
a) Use Of office national statistic to locate data relating to CPI , CPIH and RPI........................1
b) Changes in price indices from 2007 to 2017 ..........................................................................2
c) Difference between CPI and RPI ............................................................................................2
d) Use of consumer price index to explain its use to calculate annual inflation.........................4
e) Importance to measure the rate of inflation ............................................................................5
ACTIVITY 2....................................................................................................................................5
a) 1. Ogive to estimate the median hourly earning and the quartiles..........................................5
2. Hourly earning mean and standard deviation..........................................................................7
b) Comparison between Manchester and London earnings.........................................................9
ACTIVITY 3....................................................................................................................................9
A) Paired t test at 5 % level of significance.................................................................................9
B) Assessing paired t test with normal conditions.....................................................................10
C) 99% confidence interval with aim of reduction in mean......................................................10
ACTIVITY 4..................................................................................................................................11
a) Using data from ONS to produce charts indicating change in CPI, CPIH and RPI from 2007
to 2017.......................................................................................................................................11
b) Ogive for cumulative % staff v/s hourly earning..................................................................12
CONCLUSION .............................................................................................................................12
REFERENCES..............................................................................................................................14
INTRODUCTION
Statistics refers to the collection of numerical data which is used to measure the
quantitative information. Statistics is used in management for financial analysis, for decision
making, auditing and market research. It is used by management as it gives a technique to obtain,
consider, analyse and relate numerical data. This study will include consumer price index and
retail price index which is been collected from the office of national statistics. Furthermore, it
will include statistical methods used in business planning. Moreover, it will provide
understanding of business data using statistical methods. Statistics are used in business to make
good and sound decision for company. It helps in comparing the trend and changes by
collecting various data.
ACTIVITY 1
a) Use Of office national statistic to locate data relating to CPI , CPIH and RPI.
Consumer price index : It is a measure that helps in examining the weighted average of
prices of consumer goods and services. It helps in measuring the changes in prices of goods and
services (Definition of 'Consumer Price Index', 2017). It is calculated by dividing the price of
basket of goods and services in the given year by the price of the same basket in the base year
(Keller, 2015). After this ,the ratio is multiplied by 100 which gives the consumer price index.
In the base year, Consumer price index adds up to 100.
CPIH : It stands for consumer price inflation including owner occupiers housing cost.
Also, it does not include the changes in house prices. It is produced each month in UK by the
office of national statistics but adjusted to reflect changes in average residential rents (Haimes,
2015). These rents are used as proxy measure to identify estimated cost for homeowners to rent
their own homes. CPIH is used instead of CPI to better reflect the cost pressures faced by UK
households.
Retail price index : It is used to measure the inflation which is published in the office of
national statistics. It helps in measuring the change in the cost of retail goods and services
(Anderson And et.al., 2018). The measurements are made by recording the goods and services
which people are expected to buy ,putting them into an imaginary shopping basket known as
“basket of Goods”. RPI include cost of housing such as mortgage interest cost and council tax
which CPI does not include.
1
⊘ This is a preview!⊘
Do you want full access?
Subscribe today to unlock all pages.
Trusted by 1+ million students worldwide
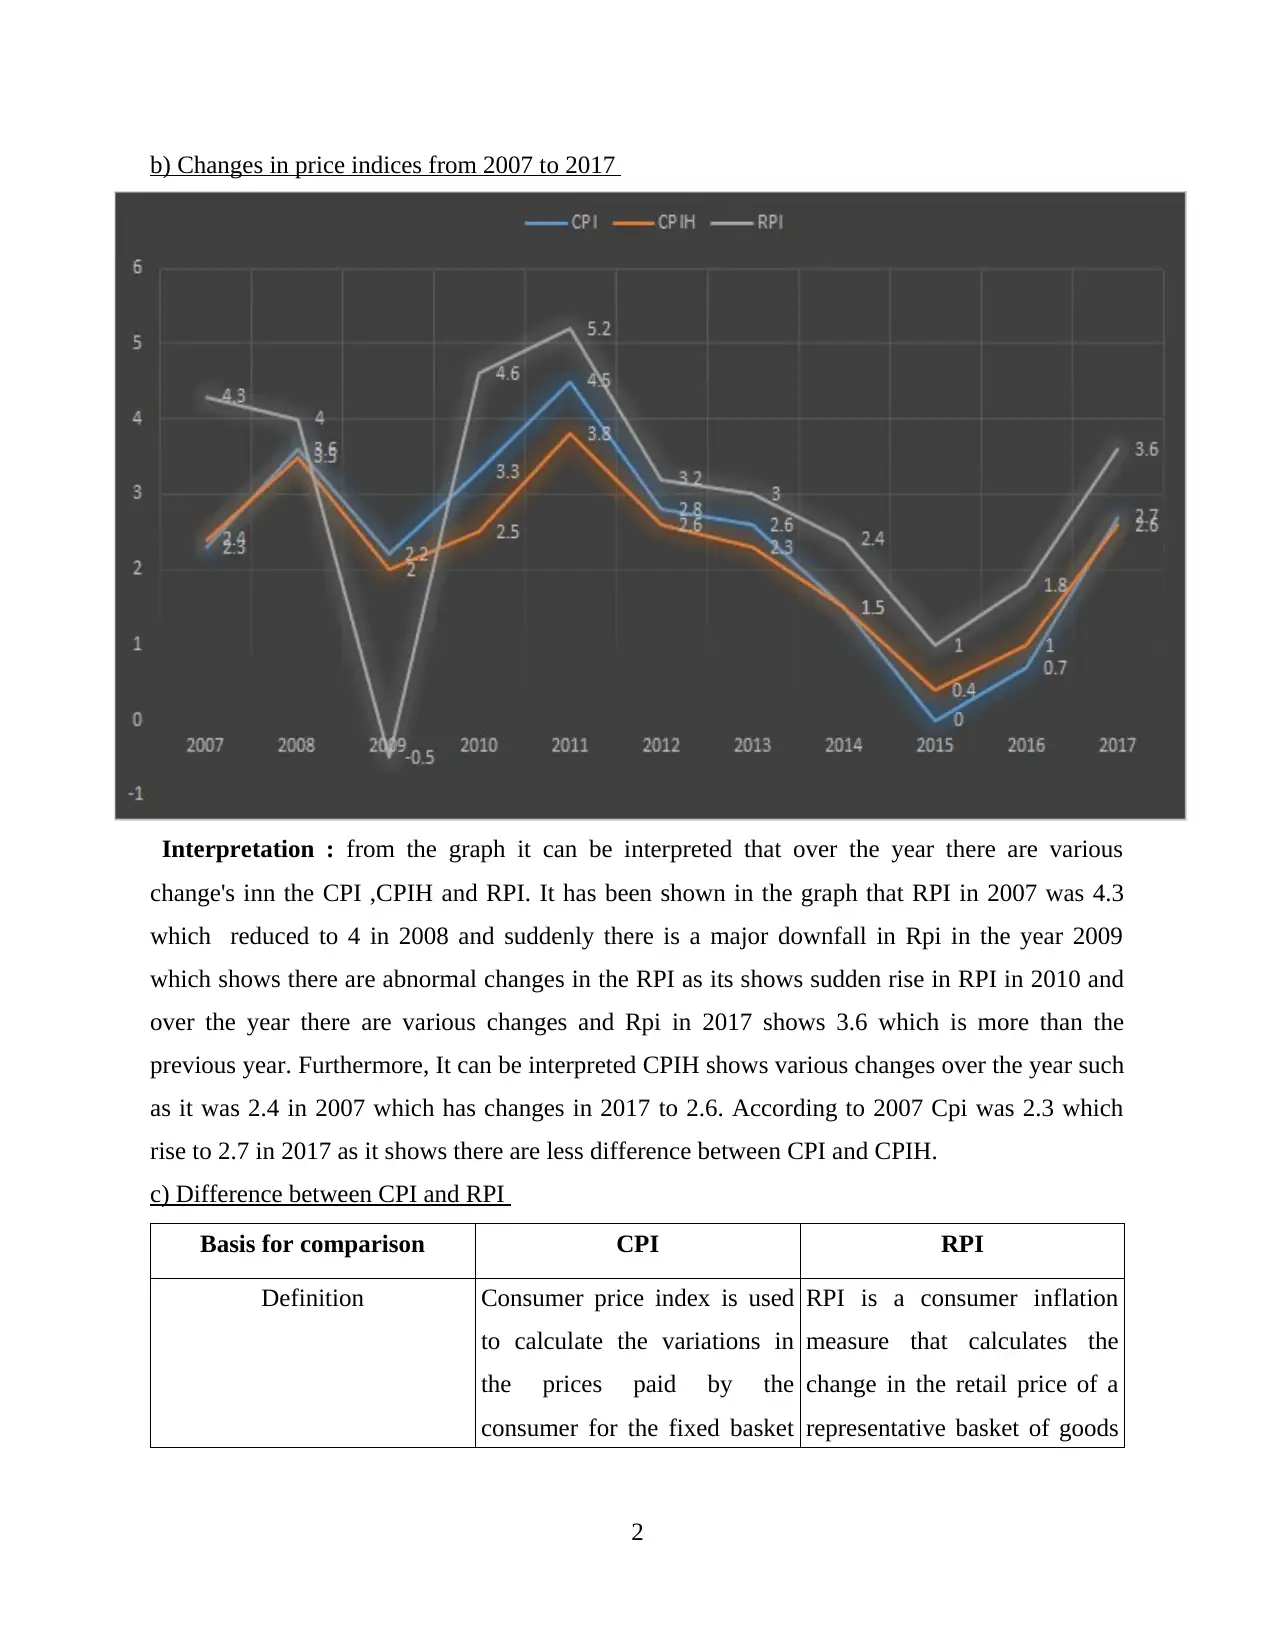
b) Changes in price indices from 2007 to 2017
Interpretation : from the graph it can be interpreted that over the year there are various
change's inn the CPI ,CPIH and RPI. It has been shown in the graph that RPI in 2007 was 4.3
which reduced to 4 in 2008 and suddenly there is a major downfall in Rpi in the year 2009
which shows there are abnormal changes in the RPI as its shows sudden rise in RPI in 2010 and
over the year there are various changes and Rpi in 2017 shows 3.6 which is more than the
previous year. Furthermore, It can be interpreted CPIH shows various changes over the year such
as it was 2.4 in 2007 which has changes in 2017 to 2.6. According to 2007 Cpi was 2.3 which
rise to 2.7 in 2017 as it shows there are less difference between CPI and CPIH.
c) Difference between CPI and RPI
Basis for comparison CPI RPI
Definition Consumer price index is used
to calculate the variations in
the prices paid by the
consumer for the fixed basket
RPI is a consumer inflation
measure that calculates the
change in the retail price of a
representative basket of goods
2
Paraphrase This Document
Need a fresh take? Get an instant paraphrase of this document with our AI Paraphraser
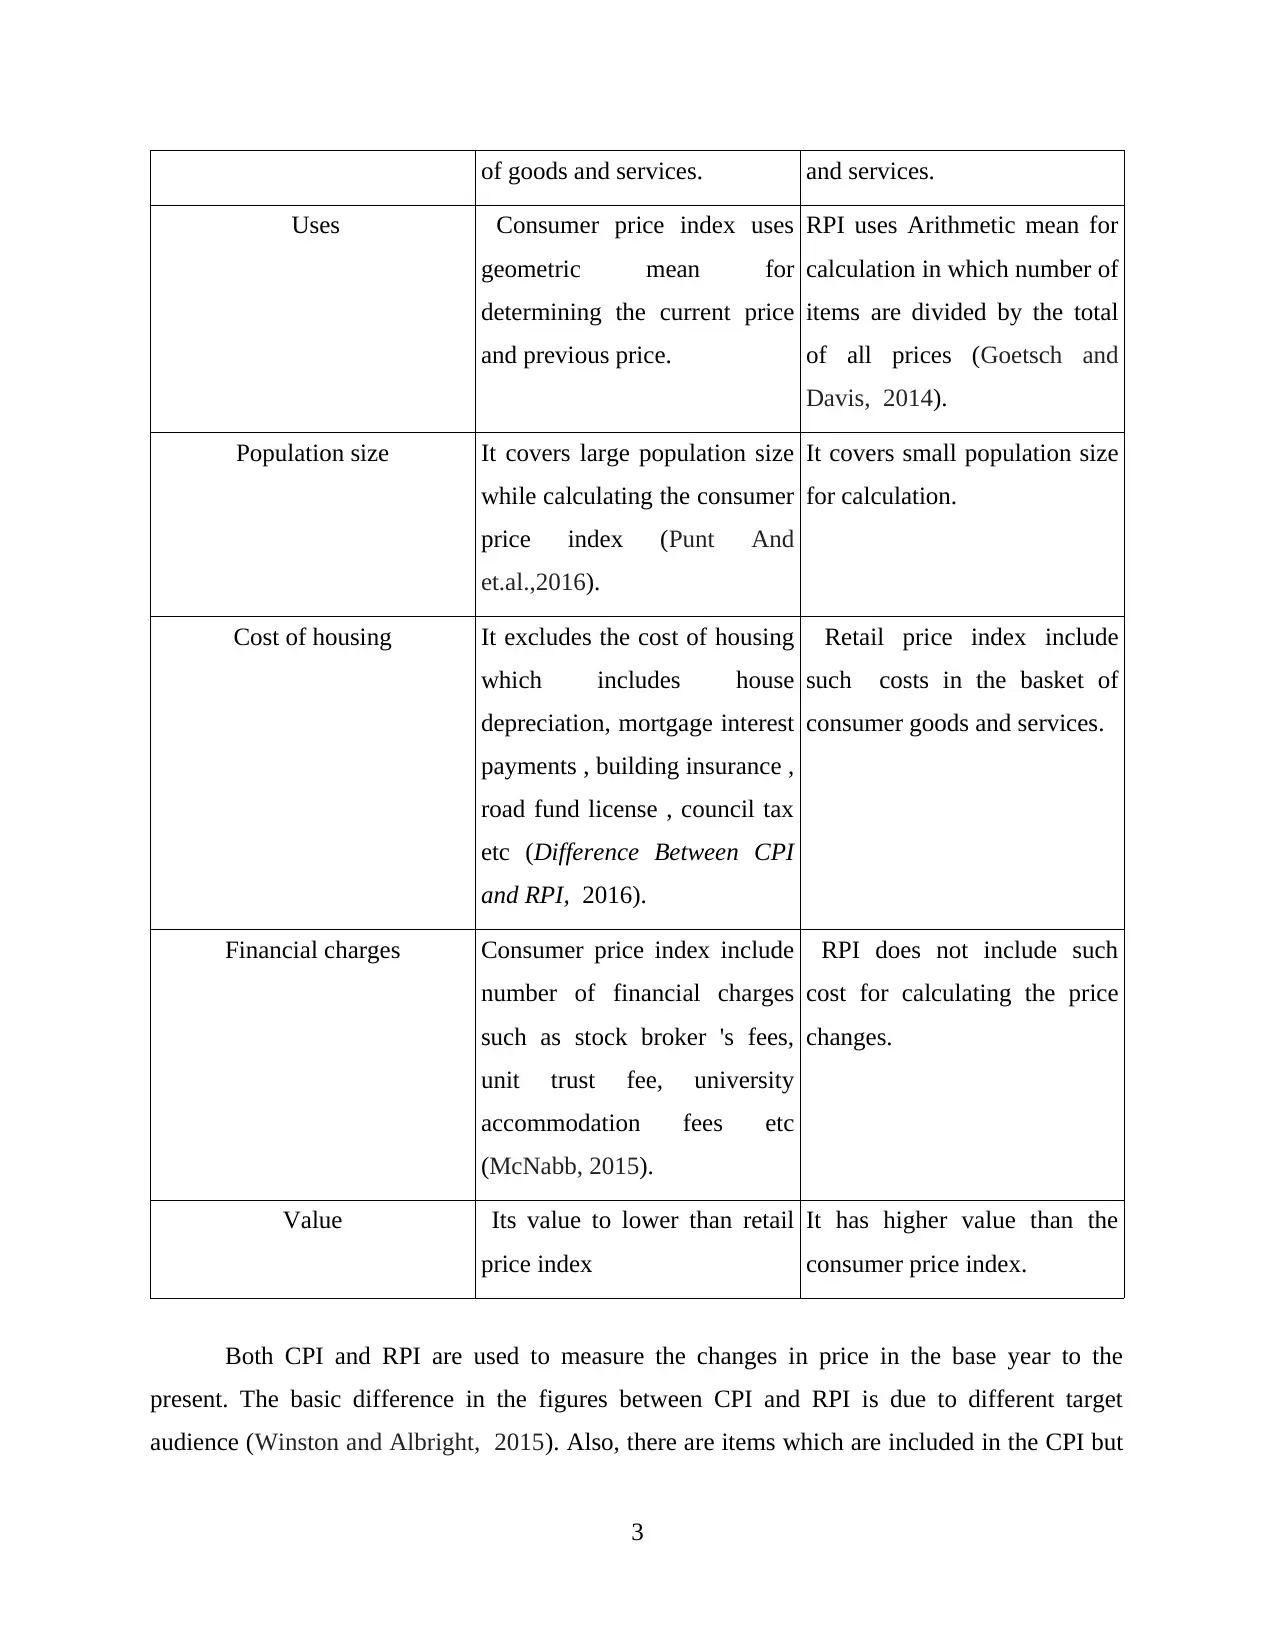
of goods and services. and services.
Uses Consumer price index uses
geometric mean for
determining the current price
and previous price.
RPI uses Arithmetic mean for
calculation in which number of
items are divided by the total
of all prices (Goetsch and
Davis, 2014).
Population size It covers large population size
while calculating the consumer
price index (Punt And
et.al.,2016).
It covers small population size
for calculation.
Cost of housing It excludes the cost of housing
which includes house
depreciation, mortgage interest
payments , building insurance ,
road fund license , council tax
etc (Difference Between CPI
and RPI, 2016).
Retail price index include
such costs in the basket of
consumer goods and services.
Financial charges Consumer price index include
number of financial charges
such as stock broker 's fees,
unit trust fee, university
accommodation fees etc
(McNabb, 2015).
RPI does not include such
cost for calculating the price
changes.
Value Its value to lower than retail
price index
It has higher value than the
consumer price index.
Both CPI and RPI are used to measure the changes in price in the base year to the
present. The basic difference in the figures between CPI and RPI is due to different target
audience (Winston and Albright, 2015). Also, there are items which are included in the CPI but
3
they are not included in RPI. Also, both the price indices are calculated different formula which
also to the difference between the two of them.
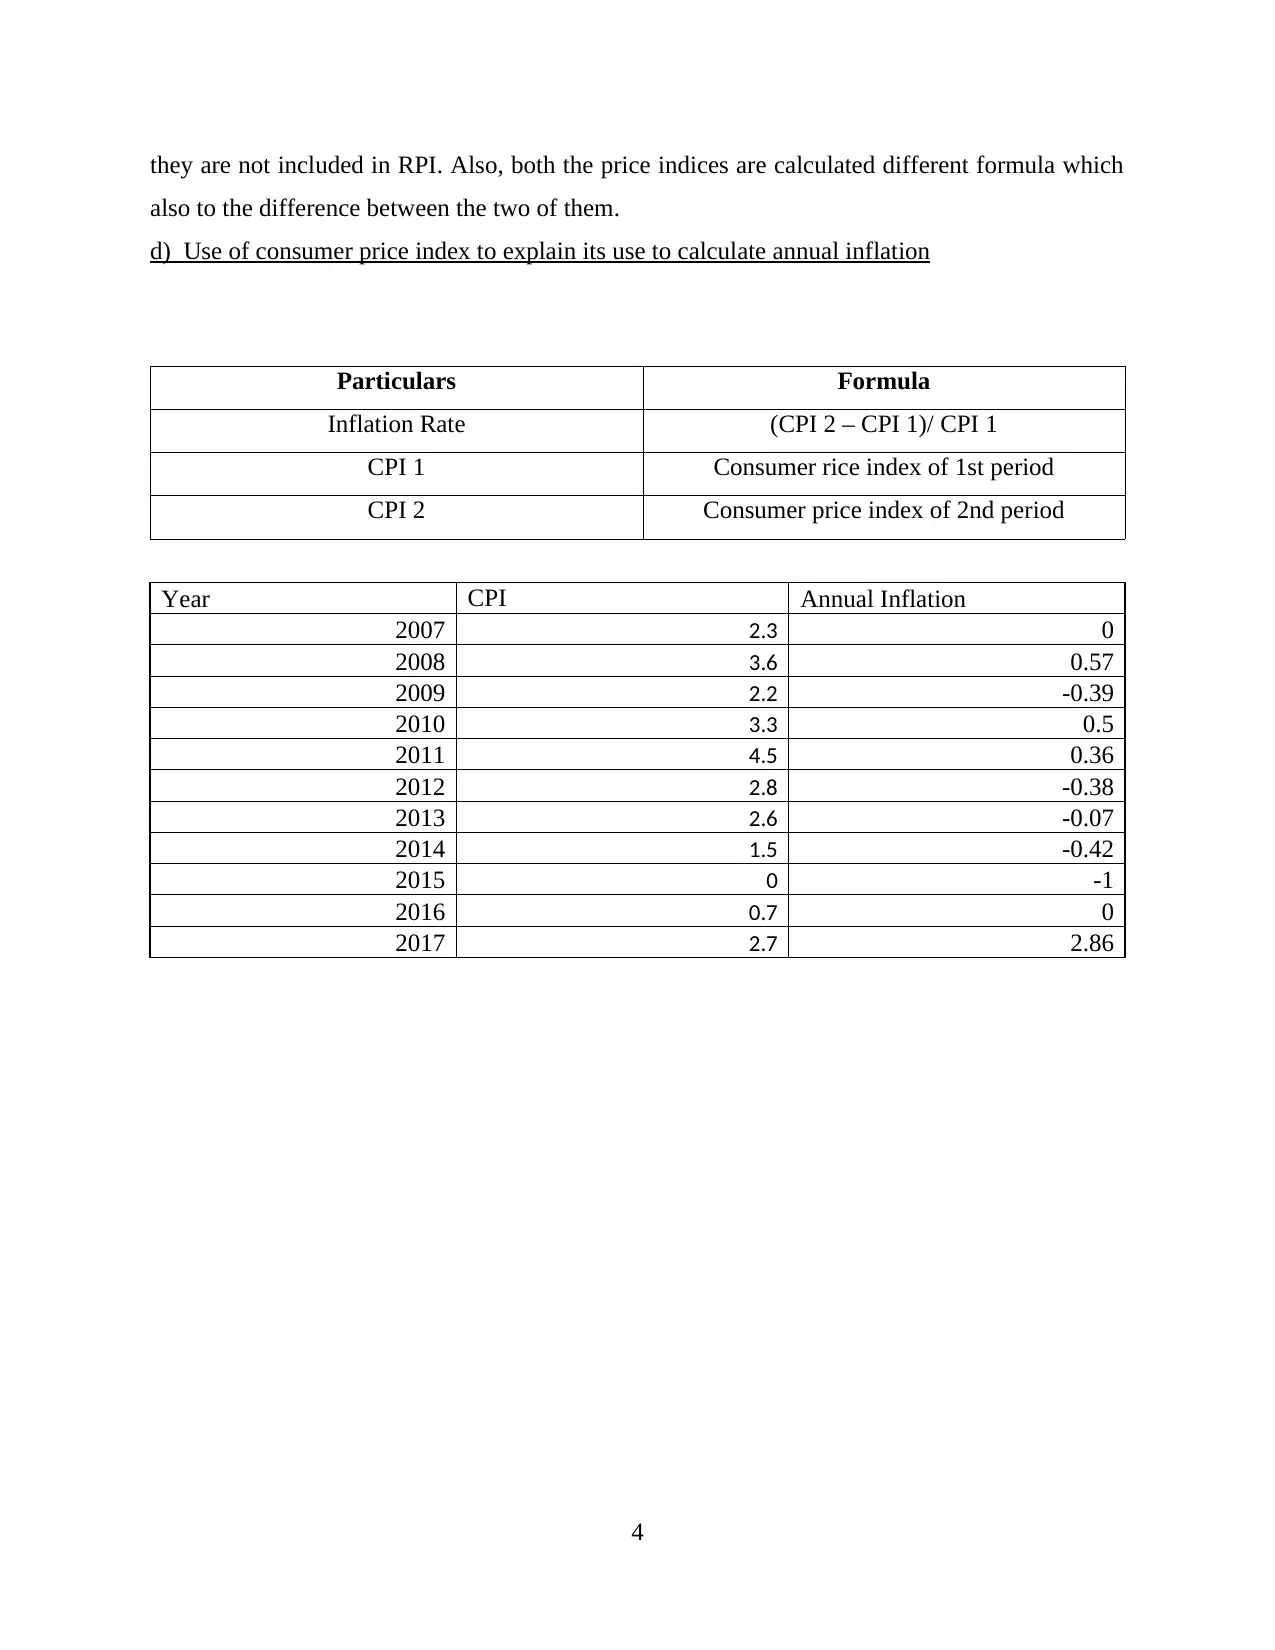
d) Use of consumer price index to explain its use to calculate annual inflation
Particulars Formula
Inflation Rate (CPI 2 – CPI 1)/ CPI 1
CPI 1 Consumer rice index of 1st period
CPI 2 Consumer price index of 2nd period
Year CPI Annual Inflation
2007 2.3 0
2008 3.6 0.57
2009 2.2 -0.39
2010 3.3 0.5
2011 4.5 0.36
2012 2.8 -0.38
2013 2.6 -0.07
2014 1.5 -0.42
2015 0 -1
2016 0.7 0
2017 2.7 2.86
4
also to the difference between the two of them.
d) Use of consumer price index to explain its use to calculate annual inflation
Particulars Formula
Inflation Rate (CPI 2 – CPI 1)/ CPI 1
CPI 1 Consumer rice index of 1st period
CPI 2 Consumer price index of 2nd period
Year CPI Annual Inflation
2007 2.3 0
2008 3.6 0.57
2009 2.2 -0.39
2010 3.3 0.5
2011 4.5 0.36
2012 2.8 -0.38
2013 2.6 -0.07
2014 1.5 -0.42
2015 0 -1
2016 0.7 0
2017 2.7 2.86
4
⊘ This is a preview!⊘
Do you want full access?
Subscribe today to unlock all pages.
Trusted by 1+ million students worldwide
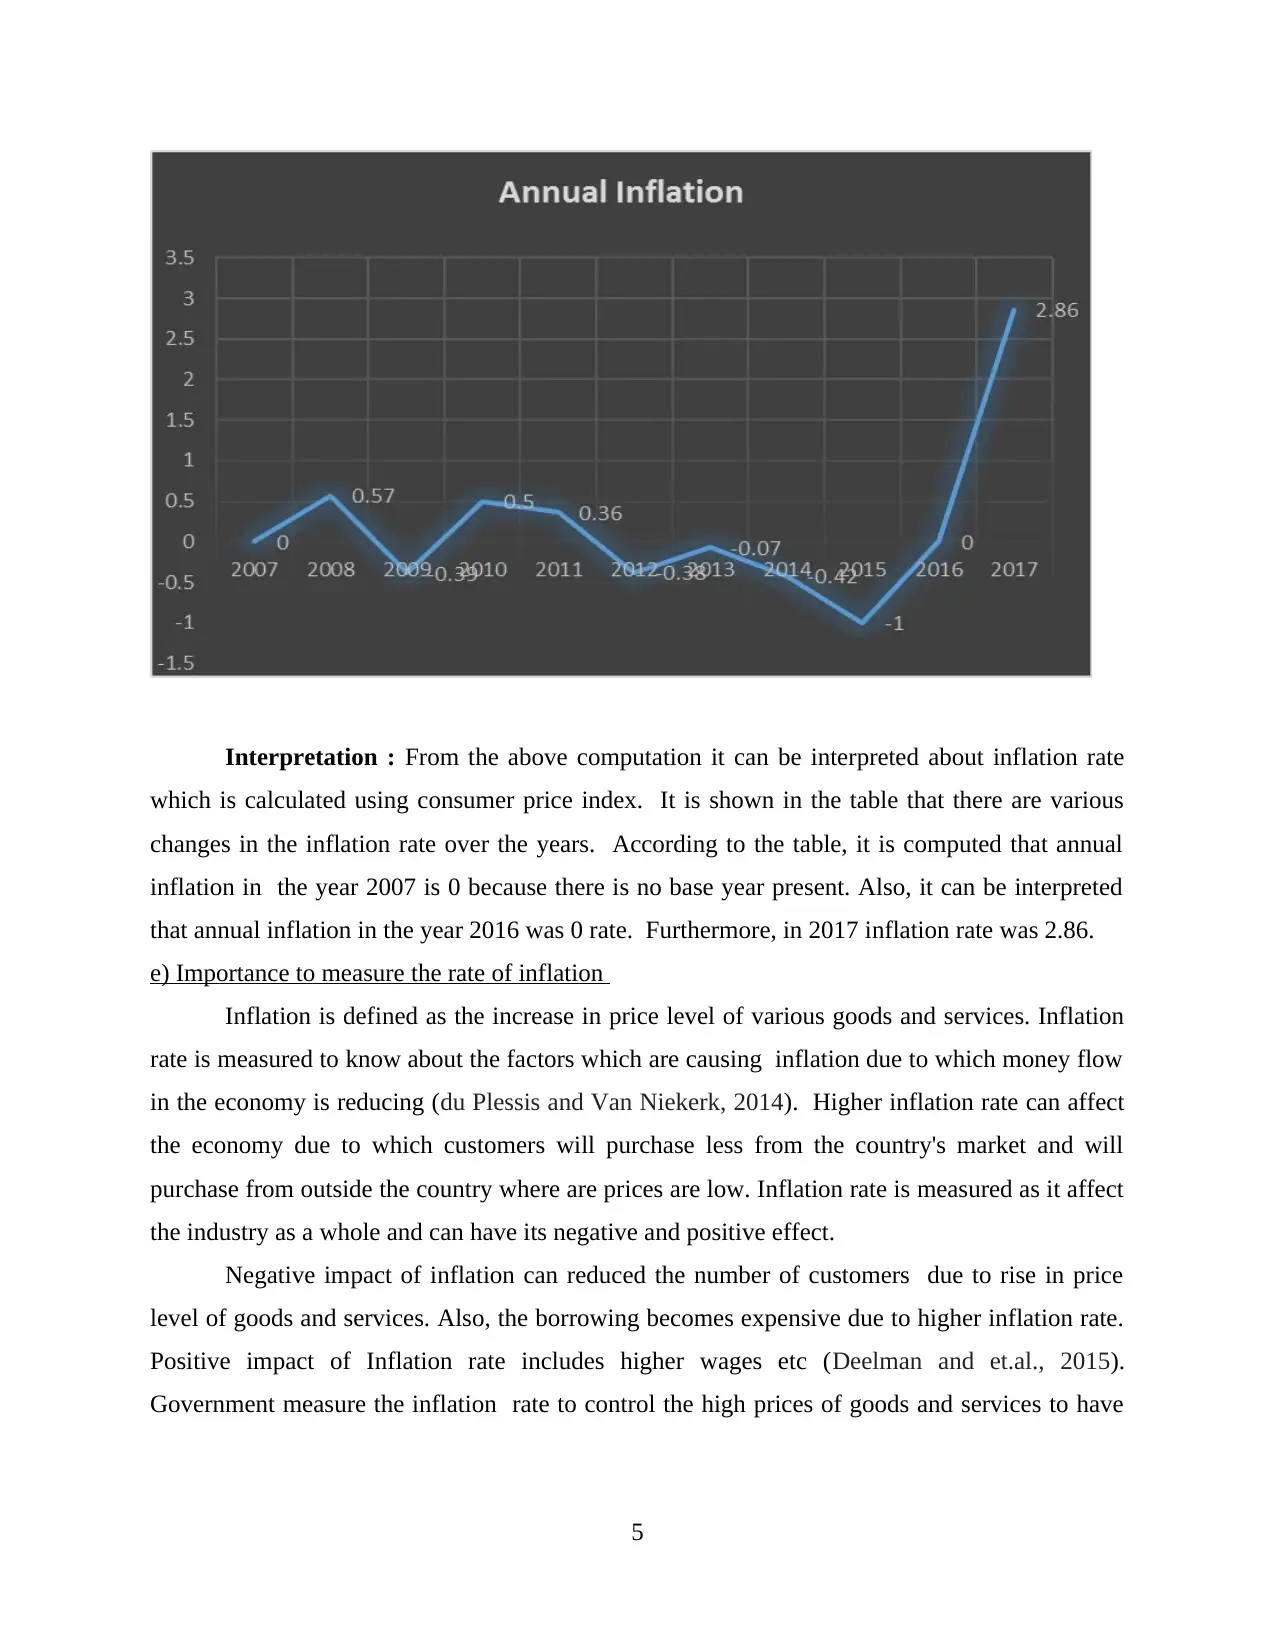
Interpretation : From the above computation it can be interpreted about inflation rate
which is calculated using consumer price index. It is shown in the table that there are various
changes in the inflation rate over the years. According to the table, it is computed that annual
inflation in the year 2007 is 0 because there is no base year present. Also, it can be interpreted
that annual inflation in the year 2016 was 0 rate. Furthermore, in 2017 inflation rate was 2.86.
e) Importance to measure the rate of inflation
Inflation is defined as the increase in price level of various goods and services. Inflation
rate is measured to know about the factors which are causing inflation due to which money flow
in the economy is reducing (du Plessis and Van Niekerk, 2014). Higher inflation rate can affect
the economy due to which customers will purchase less from the country's market and will
purchase from outside the country where are prices are low. Inflation rate is measured as it affect
the industry as a whole and can have its negative and positive effect.
Negative impact of inflation can reduced the number of customers due to rise in price
level of goods and services. Also, the borrowing becomes expensive due to higher inflation rate.
Positive impact of Inflation rate includes higher wages etc (Deelman and et.al., 2015).
Government measure the inflation rate to control the high prices of goods and services to have
5
Paraphrase This Document
Need a fresh take? Get an instant paraphrase of this document with our AI Paraphraser
economic stability in the country. It is important to know about the inflation rate ton identify the
changes in price level which will affect the economic growth of the country.
It is important to measure the inflation rate as it will help to cut of the prices to control
the higher inflationary situation as it will affect the cost of living of the people which will be
increase due to higher cost of production.
ACTIVITY 2
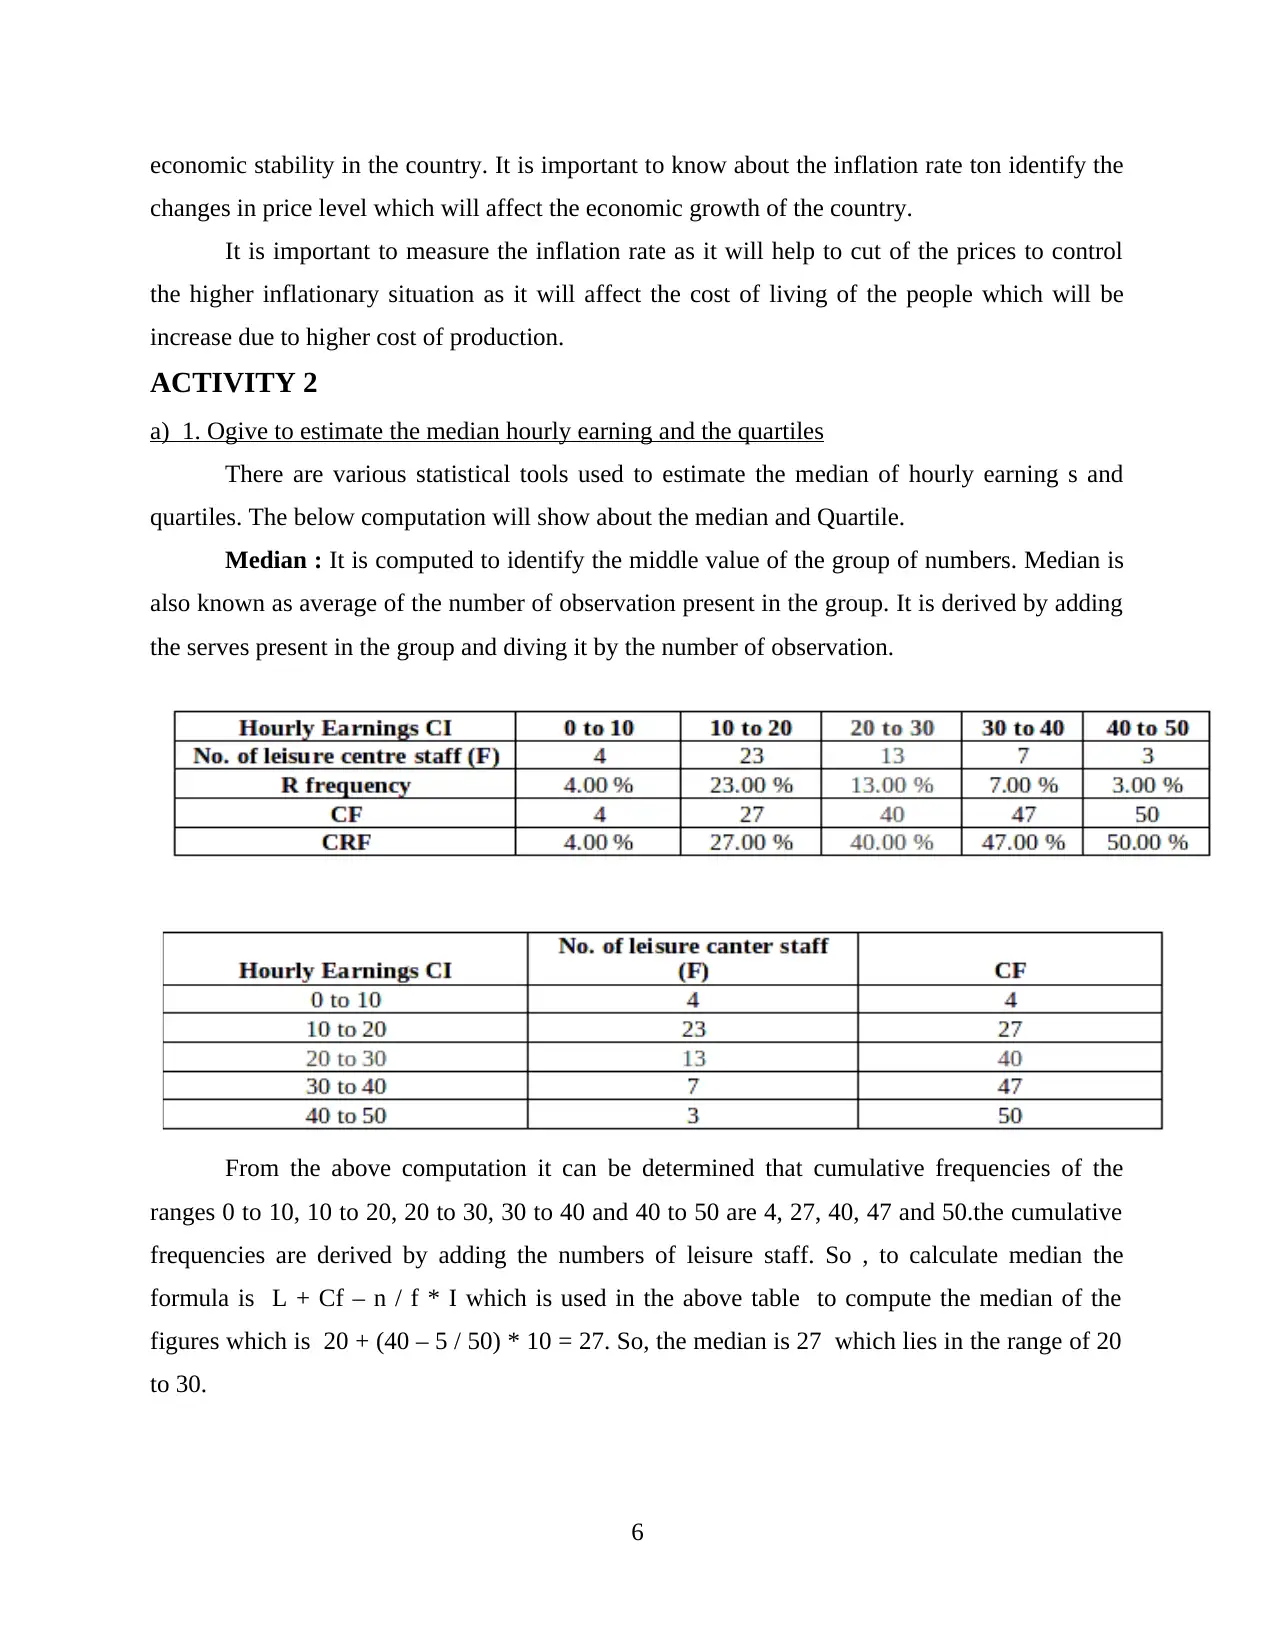
a) 1. Ogive to estimate the median hourly earning and the quartiles
There are various statistical tools used to estimate the median of hourly earning s and
quartiles. The below computation will show about the median and Quartile.
Median : It is computed to identify the middle value of the group of numbers. Median is
also known as average of the number of observation present in the group. It is derived by adding
the serves present in the group and diving it by the number of observation.
From the above computation it can be determined that cumulative frequencies of the
ranges 0 to 10, 10 to 20, 20 to 30, 30 to 40 and 40 to 50 are 4, 27, 40, 47 and 50.the cumulative
frequencies are derived by adding the numbers of leisure staff. So , to calculate median the
formula is L + Cf – n / f * I which is used in the above table to compute the median of the
figures which is 20 + (40 – 5 / 50) * 10 = 27. So, the median is 27 which lies in the range of 20
to 30.
6
changes in price level which will affect the economic growth of the country.
It is important to measure the inflation rate as it will help to cut of the prices to control
the higher inflationary situation as it will affect the cost of living of the people which will be
increase due to higher cost of production.
ACTIVITY 2
a) 1. Ogive to estimate the median hourly earning and the quartiles
There are various statistical tools used to estimate the median of hourly earning s and
quartiles. The below computation will show about the median and Quartile.
Median : It is computed to identify the middle value of the group of numbers. Median is
also known as average of the number of observation present in the group. It is derived by adding
the serves present in the group and diving it by the number of observation.
From the above computation it can be determined that cumulative frequencies of the
ranges 0 to 10, 10 to 20, 20 to 30, 30 to 40 and 40 to 50 are 4, 27, 40, 47 and 50.the cumulative
frequencies are derived by adding the numbers of leisure staff. So , to calculate median the
formula is L + Cf – n / f * I which is used in the above table to compute the median of the
figures which is 20 + (40 – 5 / 50) * 10 = 27. So, the median is 27 which lies in the range of 20
to 30.
6
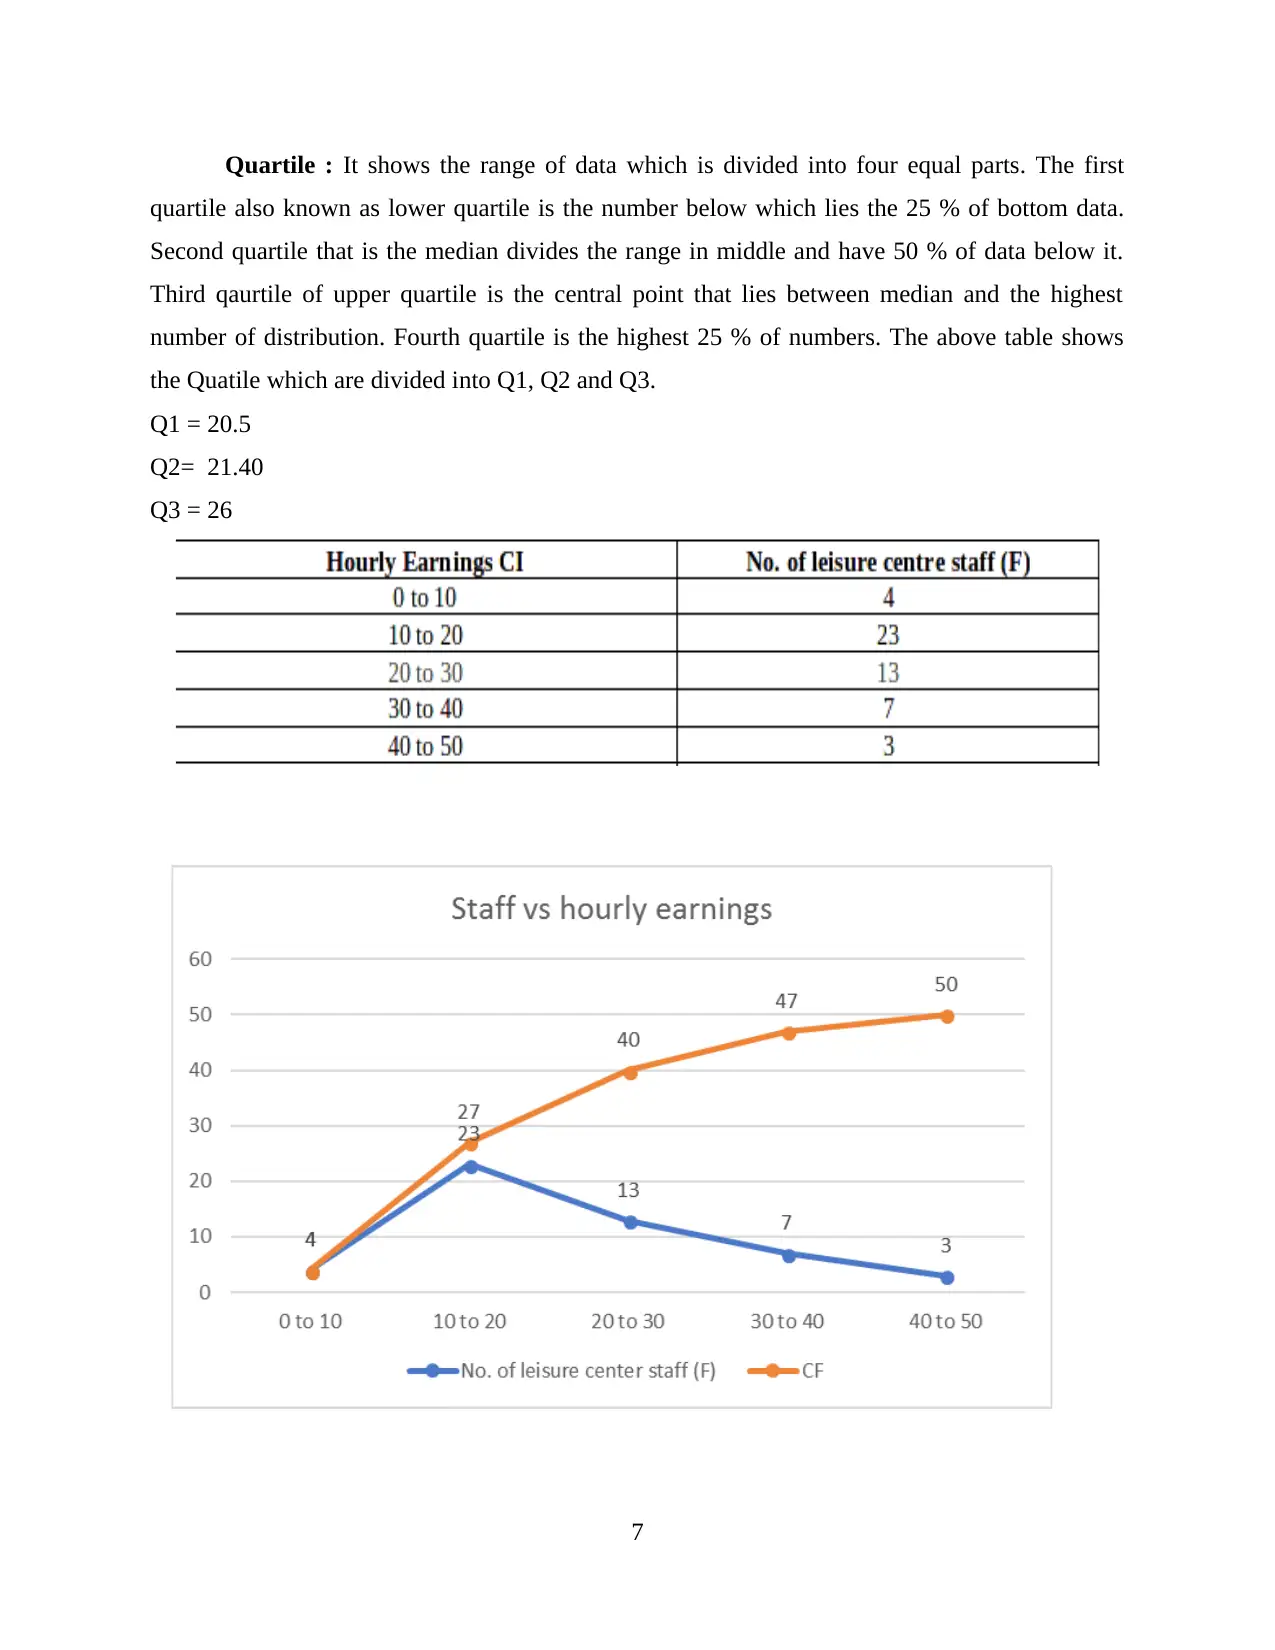
Quartile : It shows the range of data which is divided into four equal parts. The first
quartile also known as lower quartile is the number below which lies the 25 % of bottom data.
Second quartile that is the median divides the range in middle and have 50 % of data below it.
Third qaurtile of upper quartile is the central point that lies between median and the highest
number of distribution. Fourth quartile is the highest 25 % of numbers. The above table shows
the Quatile which are divided into Q1, Q2 and Q3.
Q1 = 20.5
Q2= 21.40
Q3 = 26
7
⊘ This is a preview!⊘
Do you want full access?
Subscribe today to unlock all pages.
Trusted by 1+ million students worldwide
Interpretation : From the above ogive graph it can be interpreted about median and
quartile which shows that median as computed is 27 and range in 20 to 30 working hours and
have staff 13. Quartile as computed shows 20.5, 21.40 and 26 which is extracted from Q1 to Q3.
The ogive graph is showing the cumulative frequencies of the various ranges of hourly working.
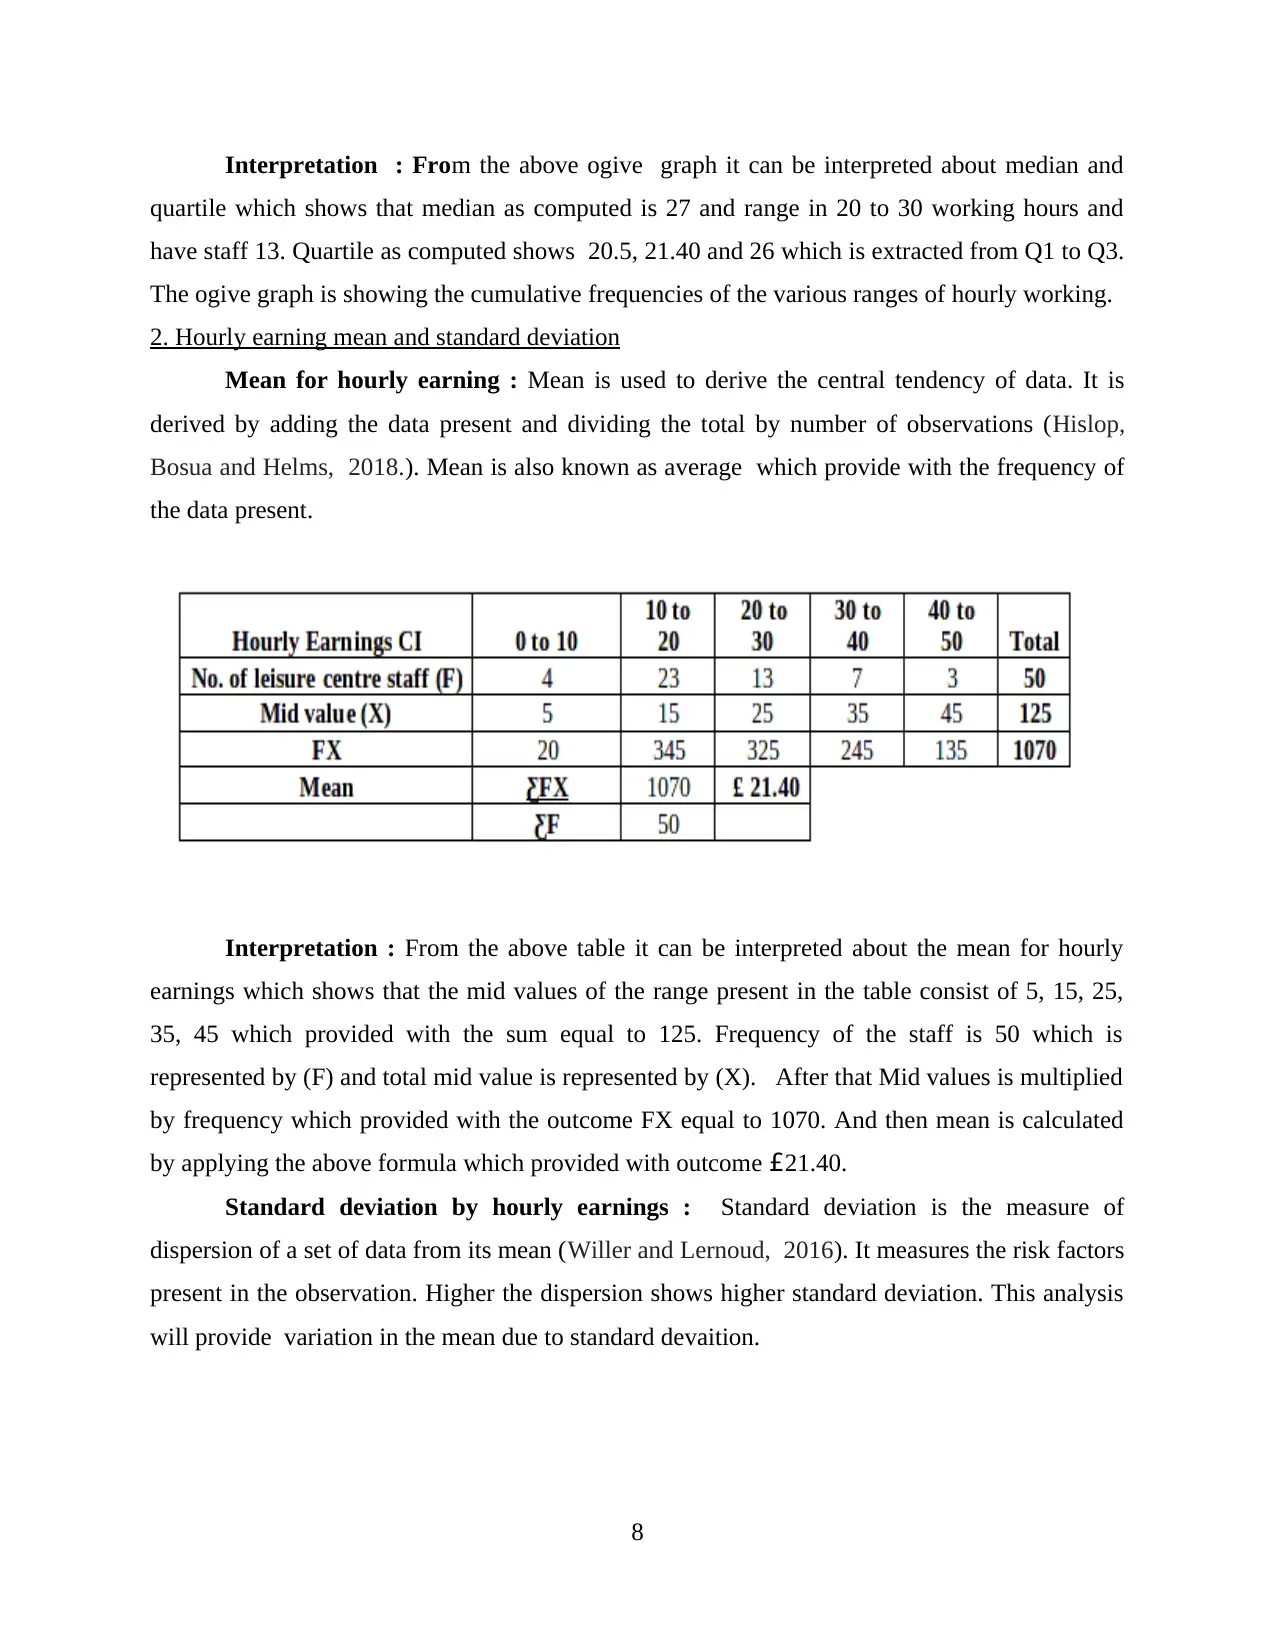
2. Hourly earning mean and standard deviation
Mean for hourly earning : Mean is used to derive the central tendency of data. It is
derived by adding the data present and dividing the total by number of observations (Hislop,
Bosua and Helms, 2018.). Mean is also known as average which provide with the frequency of
the data present.
Interpretation : From the above table it can be interpreted about the mean for hourly
earnings which shows that the mid values of the range present in the table consist of 5, 15, 25,
35, 45 which provided with the sum equal to 125. Frequency of the staff is 50 which is
represented by (F) and total mid value is represented by (X). After that Mid values is multiplied
by frequency which provided with the outcome FX equal to 1070. And then mean is calculated
by applying the above formula which provided with outcome £21.40.
Standard deviation by hourly earnings : Standard deviation is the measure of
dispersion of a set of data from its mean (Willer and Lernoud, 2016). It measures the risk factors
present in the observation. Higher the dispersion shows higher standard deviation. This analysis
will provide variation in the mean due to standard devaition.
8
quartile which shows that median as computed is 27 and range in 20 to 30 working hours and
have staff 13. Quartile as computed shows 20.5, 21.40 and 26 which is extracted from Q1 to Q3.
The ogive graph is showing the cumulative frequencies of the various ranges of hourly working.
2. Hourly earning mean and standard deviation
Mean for hourly earning : Mean is used to derive the central tendency of data. It is
derived by adding the data present and dividing the total by number of observations (Hislop,
Bosua and Helms, 2018.). Mean is also known as average which provide with the frequency of
the data present.
Interpretation : From the above table it can be interpreted about the mean for hourly
earnings which shows that the mid values of the range present in the table consist of 5, 15, 25,
35, 45 which provided with the sum equal to 125. Frequency of the staff is 50 which is
represented by (F) and total mid value is represented by (X). After that Mid values is multiplied
by frequency which provided with the outcome FX equal to 1070. And then mean is calculated
by applying the above formula which provided with outcome £21.40.
Standard deviation by hourly earnings : Standard deviation is the measure of
dispersion of a set of data from its mean (Willer and Lernoud, 2016). It measures the risk factors
present in the observation. Higher the dispersion shows higher standard deviation. This analysis
will provide variation in the mean due to standard devaition.
8
Paraphrase This Document
Need a fresh take? Get an instant paraphrase of this document with our AI Paraphraser
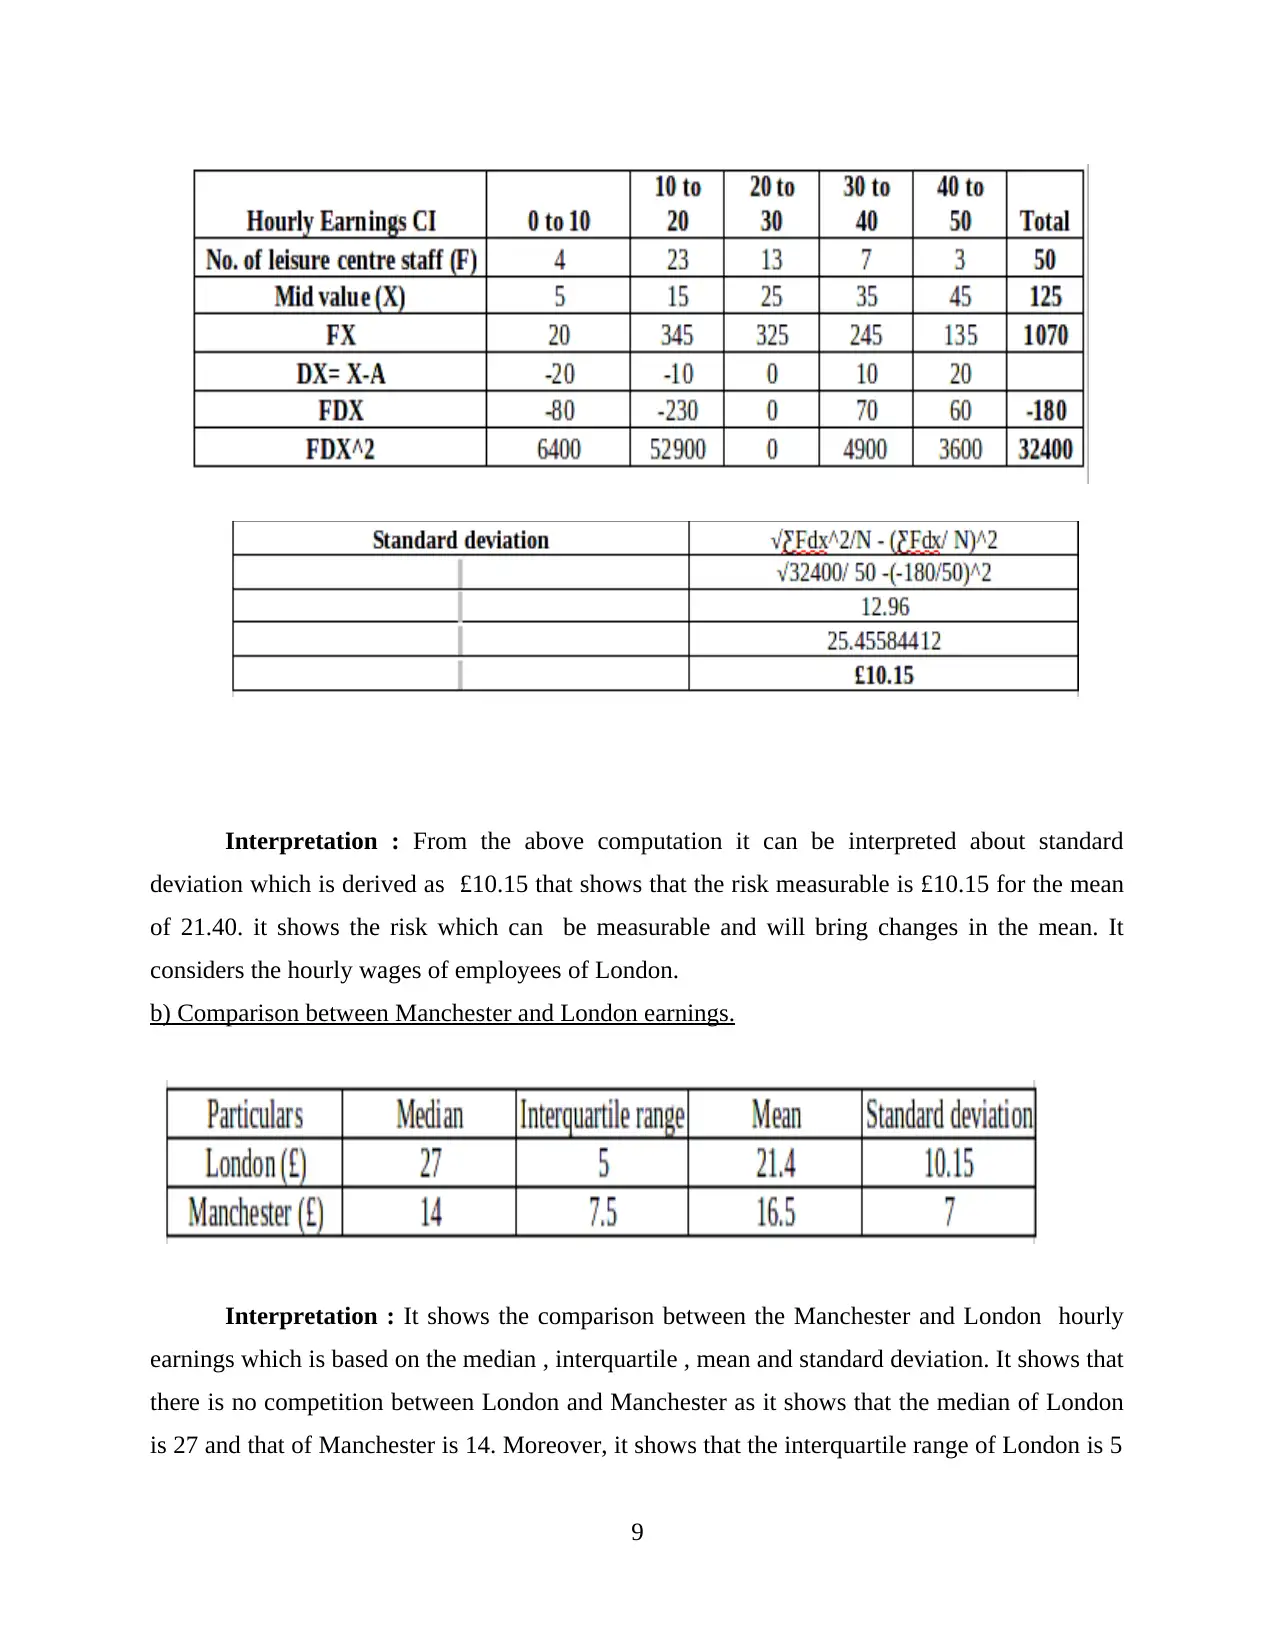
Interpretation : From the above computation it can be interpreted about standard
deviation which is derived as £10.15 that shows that the risk measurable is £10.15 for the mean
of 21.40. it shows the risk which can be measurable and will bring changes in the mean. It
considers the hourly wages of employees of London.
b) Comparison between Manchester and London earnings.
Interpretation : It shows the comparison between the Manchester and London hourly
earnings which is based on the median , interquartile , mean and standard deviation. It shows that
there is no competition between London and Manchester as it shows that the median of London
is 27 and that of Manchester is 14. Moreover, it shows that the interquartile range of London is 5
9
whereas Manchester is 7.5. Furthermore, mean of London is 21.4 whereas Manchester have
15.5. Also, the risk factors as per the standard deviation is 10.15 for London and 7 for
Manchester.
ACTIVITY 3
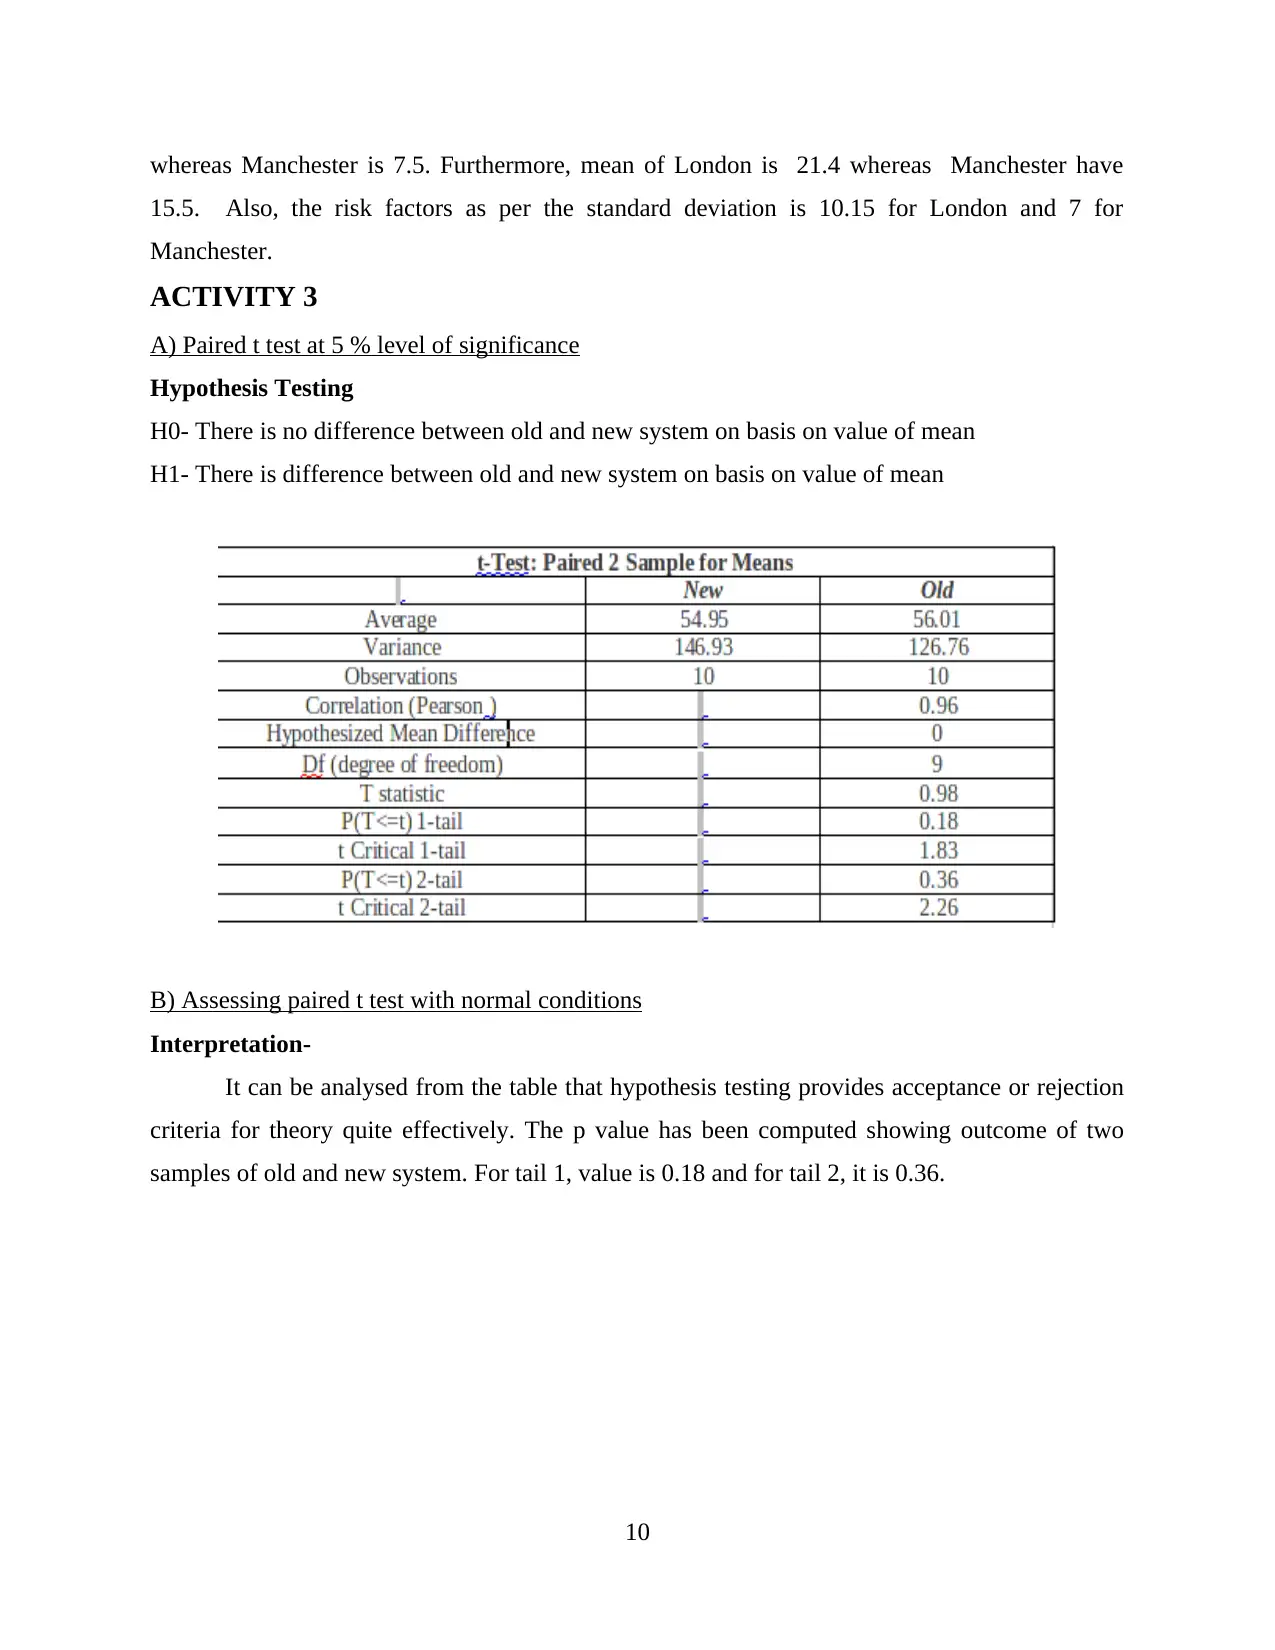
A) Paired t test at 5 % level of significance
Hypothesis Testing
H0- There is no difference between old and new system on basis on value of mean
H1- There is difference between old and new system on basis on value of mean
B) Assessing paired t test with normal conditions
Interpretation-
It can be analysed from the table that hypothesis testing provides acceptance or rejection
criteria for theory quite effectively. The p value has been computed showing outcome of two
samples of old and new system. For tail 1, value is 0.18 and for tail 2, it is 0.36.
10
15.5. Also, the risk factors as per the standard deviation is 10.15 for London and 7 for
Manchester.
ACTIVITY 3
A) Paired t test at 5 % level of significance
Hypothesis Testing
H0- There is no difference between old and new system on basis on value of mean
H1- There is difference between old and new system on basis on value of mean
B) Assessing paired t test with normal conditions
Interpretation-
It can be analysed from the table that hypothesis testing provides acceptance or rejection
criteria for theory quite effectively. The p value has been computed showing outcome of two
samples of old and new system. For tail 1, value is 0.18 and for tail 2, it is 0.36.
10
⊘ This is a preview!⊘
Do you want full access?
Subscribe today to unlock all pages.
Trusted by 1+ million students worldwide
1 out of 16
Related Documents


Your All-in-One AI-Powered Toolkit for Academic Success.
+13062052269
info@desklib.com
Available 24*7 on WhatsApp / Email
![[object Object]](/_next/static/media/star-bottom.7253800d.svg)
Unlock your academic potential
Copyright © 2020–2026 A2Z Services. All Rights Reserved. Developed and managed by ZUCOL.