Interval Estimation Assignment: Statistics for Management Decisions
VerifiedAdded on 2021/05/31
|11
|757
|17
Homework Assignment
AI Summary
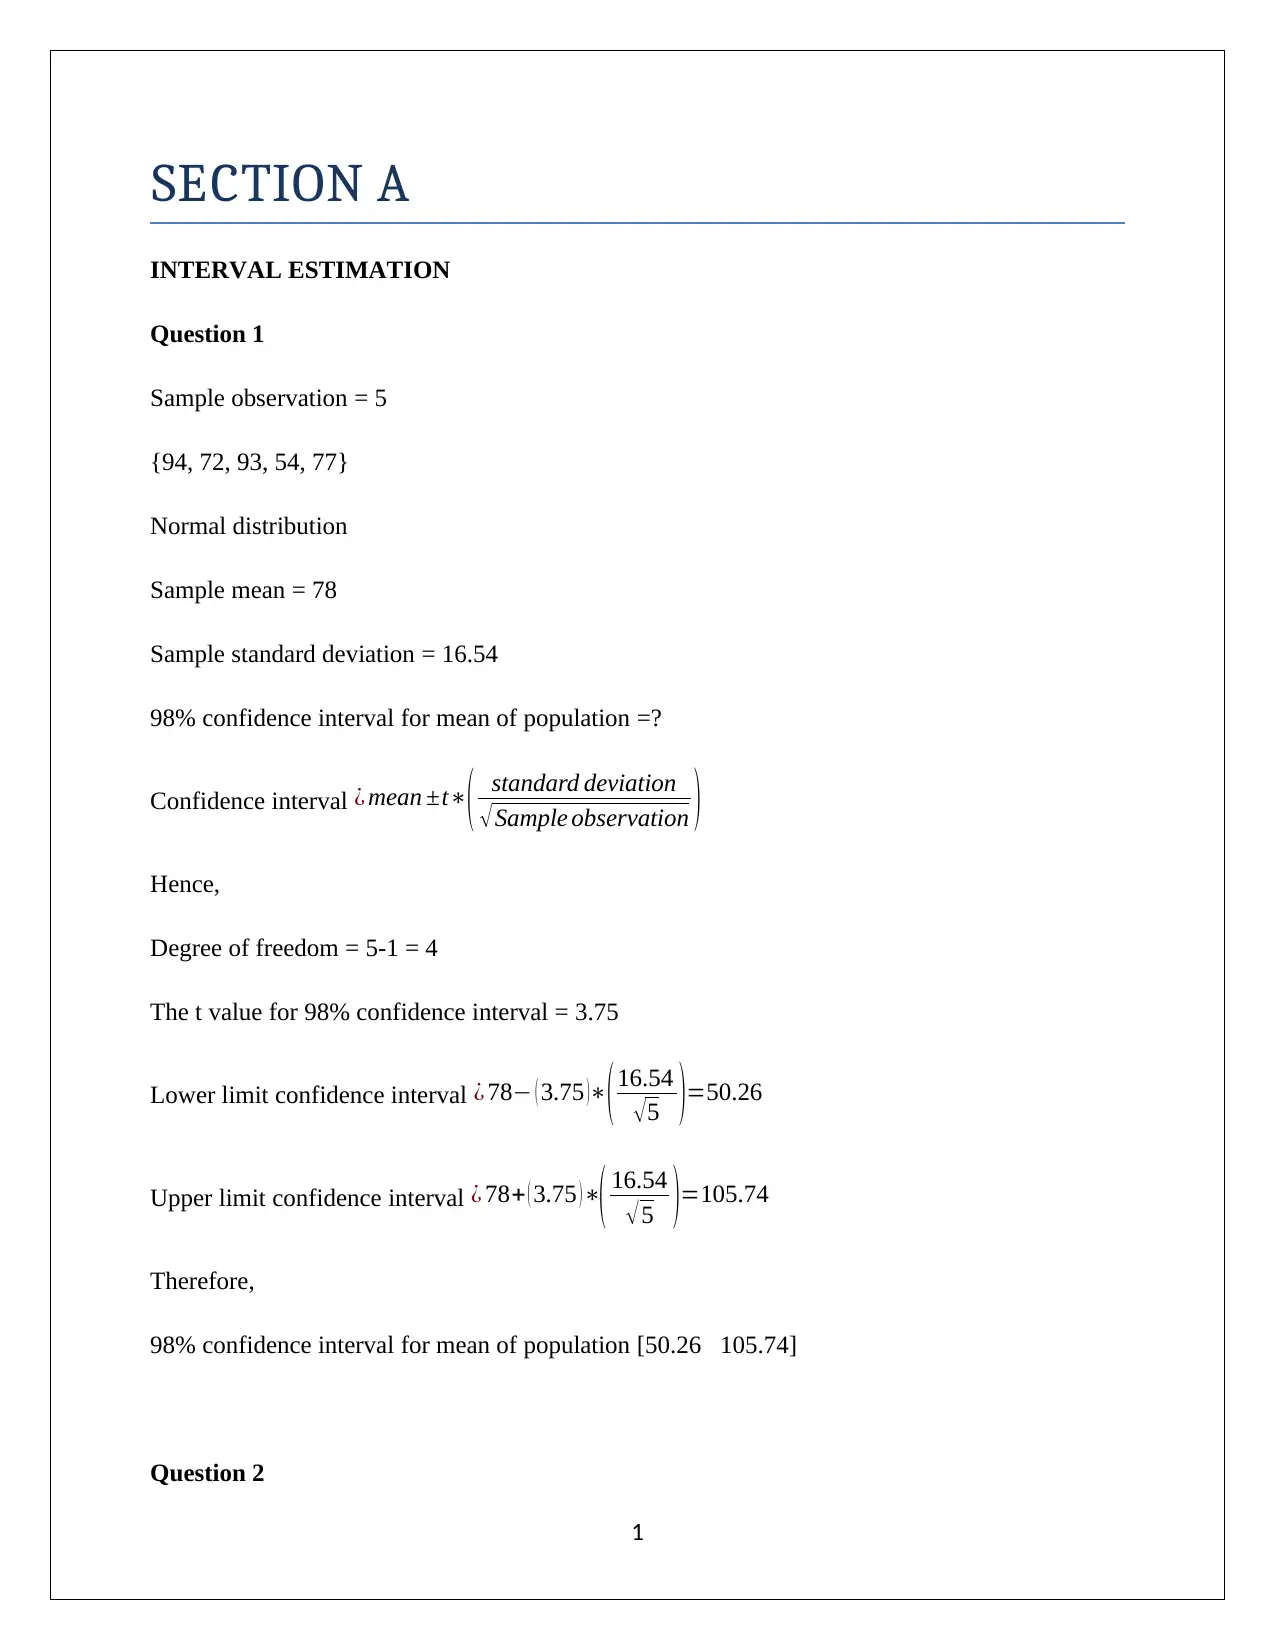
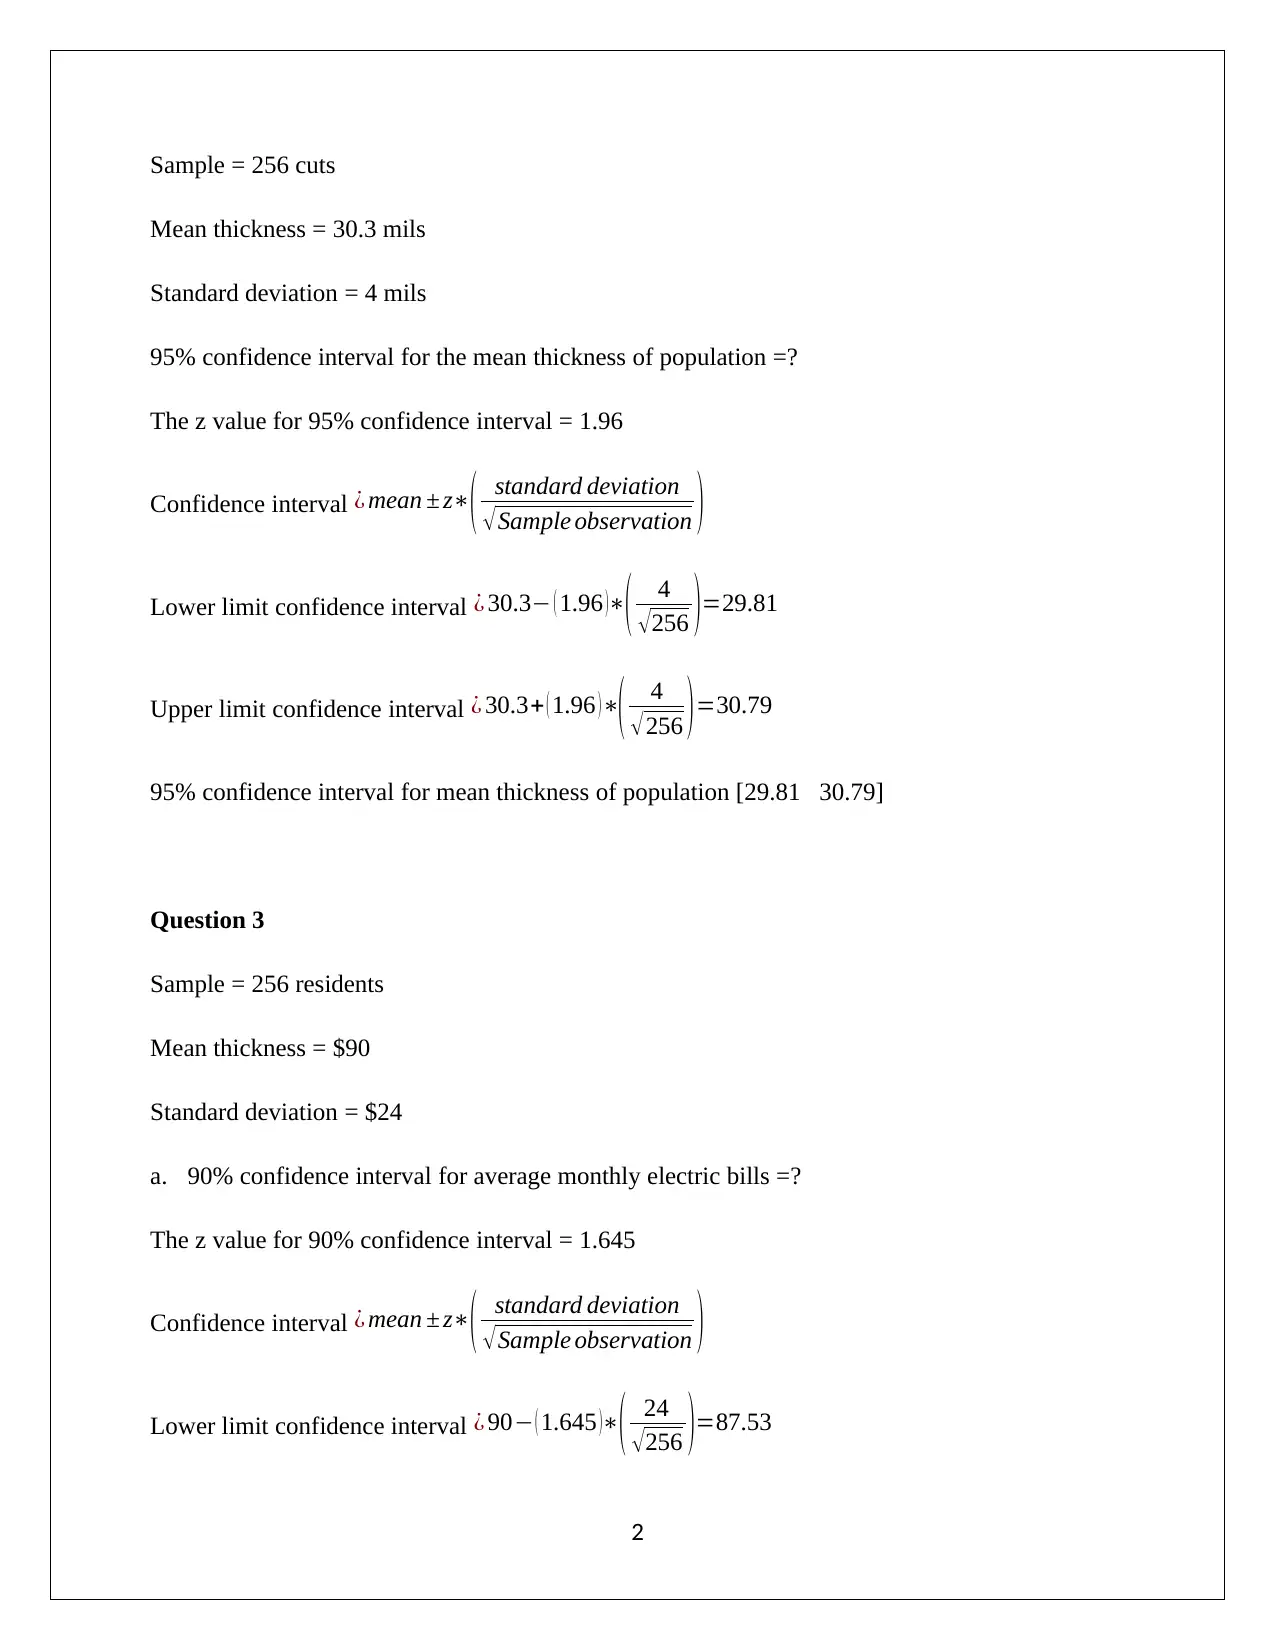
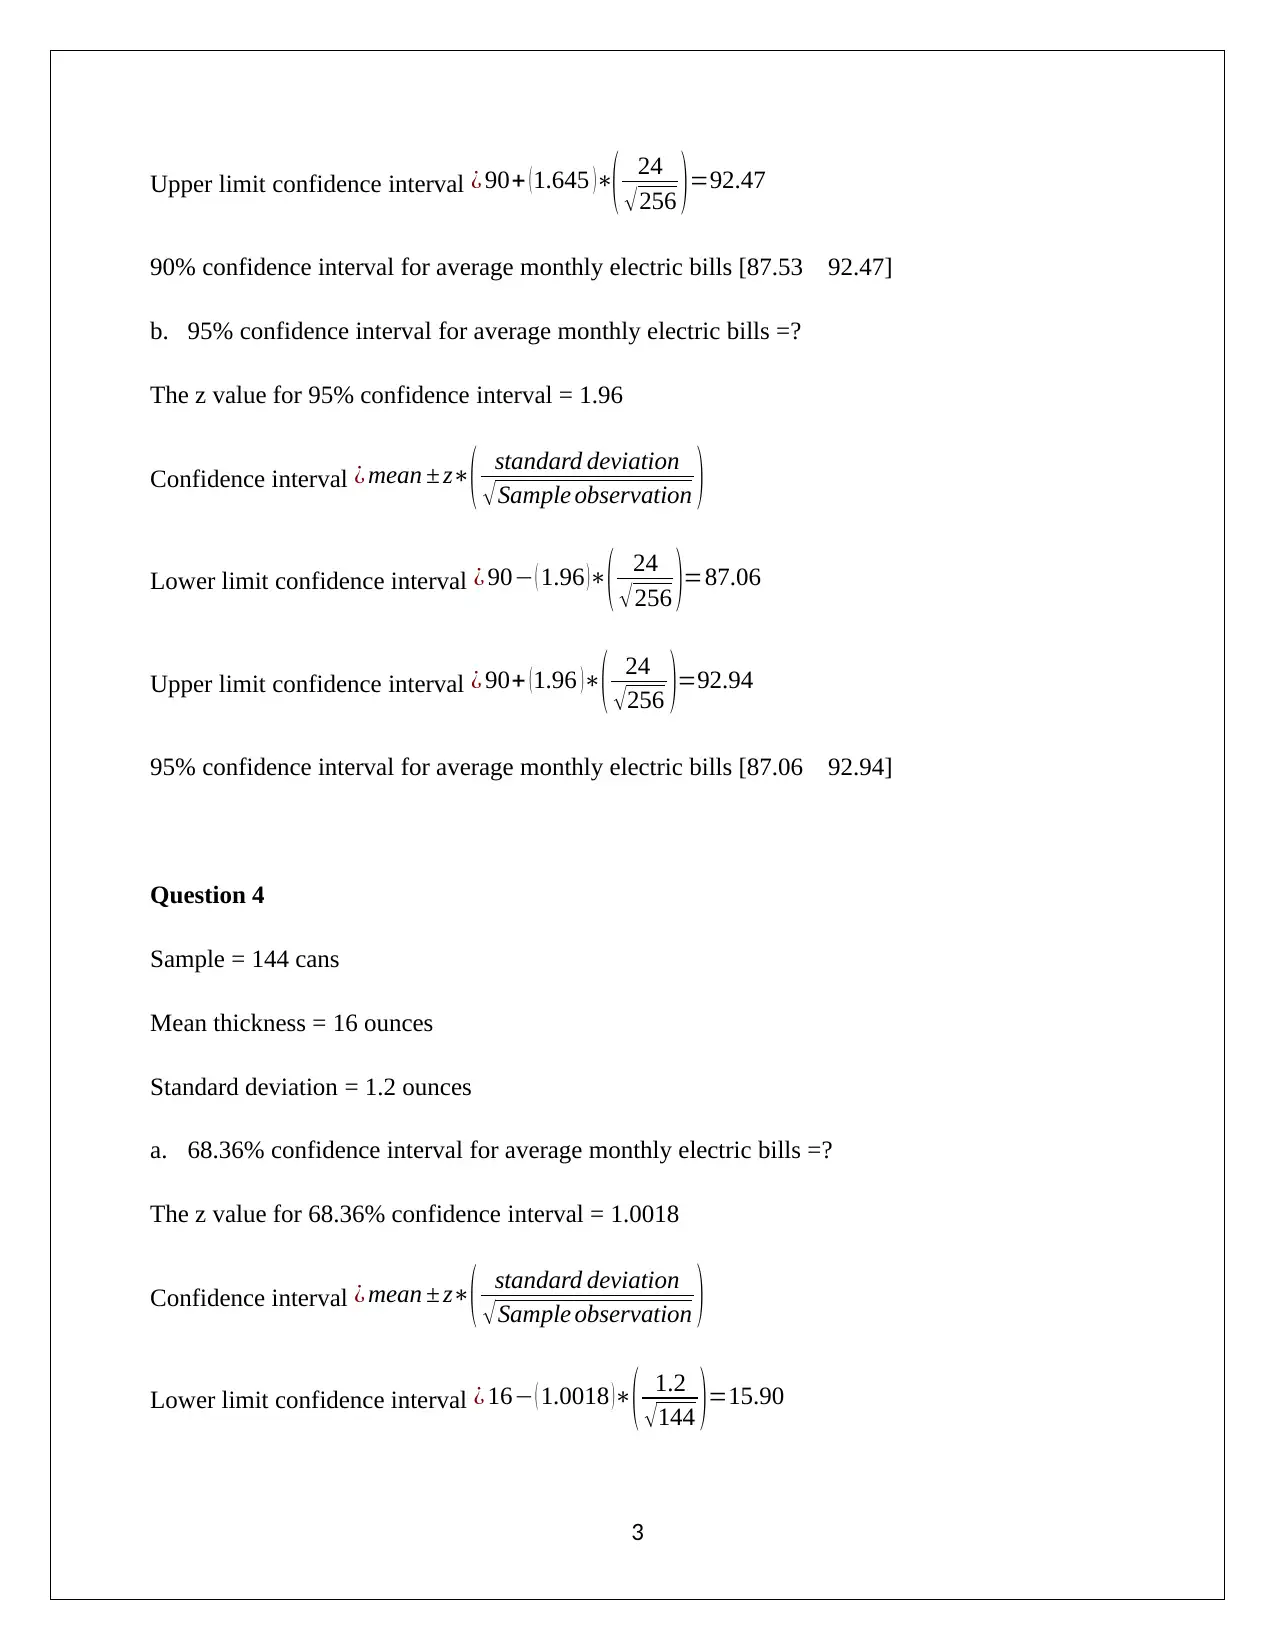
This document presents a comprehensive solution to an interval estimation assignment, likely for a statistics course. It covers various problems involving the calculation of confidence intervals using both t-distributions and z-scores. The solution includes detailed calculations for different confidence levels (e.g., 98%, 95%, 90%, 80%, and 68.36%) applied to different scenarios, such as sample observations, mean thickness, and average monthly electric bills. The assignment also addresses the area under the standard normal curve and the probability calculations related to a normal distribution, including finding the score for a specific percentile. This resource is valuable for students seeking to understand and solve interval estimation problems in statistics.

STATISTICS FOR MGMT DECISIONS
Assignment
[Pick the date]
Student Name
Assignment
[Pick the date]
Student Name
Paraphrase This Document
Need a fresh take? Get an instant paraphrase of this document with our AI Paraphraser

SECTION A
INTERVAL ESTIMATION
Question 1
Sample observation = 5
{94, 72, 93, 54, 77}
Normal distribution
Sample mean = 78
Sample standard deviation = 16.54
98% confidence interval for mean of population =?
Confidence interval ¿ mean ±t∗
( standard deviation
√Sample observation )
Hence,
Degree of freedom = 5-1 = 4
The t value for 98% confidence interval = 3.75
Lower limit confidence interval ¿ 78− ( 3.75 )∗(16.54
√5 )=50.26
Upper limit confidence interval ¿ 78+ ( 3.75 )∗
( 16.54
√ 5 )=105.74
Therefore,
98% confidence interval for mean of population [50.26 105.74]
Question 2
1

Sample = 256 cuts
Mean thickness = 30.3 mils
Standard deviation = 4 mils
95% confidence interval for the mean thickness of population =?
The z value for 95% confidence interval = 1.96
Confidence interval ¿ mean ± z∗
( standard deviation
√Sample observation )
Lower limit confidence interval ¿ 30.3− ( 1.96 )∗
( 4
√256 )=29.81
Upper limit confidence interval ¿ 30.3+ ( 1.96 )∗
( 4
√256 )=30.79
95% confidence interval for mean thickness of population [29.81 30.79]
Question 3
Sample = 256 residents
Mean thickness = $90
Standard deviation = $24
a. 90% confidence interval for average monthly electric bills =?
The z value for 90% confidence interval = 1.645
Confidence interval ¿ mean ± z∗
( standard deviation
√Sample observation )
Lower limit confidence interval ¿ 90− ( 1.645 )∗( 24
√256 )=87.53
2
⊘ This is a preview!⊘
Do you want full access?
Subscribe today to unlock all pages.

Trusted by 1+ million students worldwide

Upper limit confidence interval ¿ 90+ ( 1.645 )∗( 24
√ 256 ) =92.47
90% confidence interval for average monthly electric bills [87.53 92.47]
b. 95% confidence interval for average monthly electric bills =?
The z value for 95% confidence interval = 1.96
Confidence interval ¿ mean ± z∗
( standard deviation
√Sample observation )
Lower limit confidence interval ¿ 90− ( 1.96 )∗
( 24
√ 256 )=87.06
Upper limit confidence interval ¿ 90+ (1.96 )∗( 24
√256 )=92.94
95% confidence interval for average monthly electric bills [87.06 92.94]
Question 4
Sample = 144 cans
Mean thickness = 16 ounces
Standard deviation = 1.2 ounces
a. 68.36% confidence interval for average monthly electric bills =?
The z value for 68.36% confidence interval = 1.0018
Confidence interval ¿ mean ± z∗( standard deviation
√Sample observation )
Lower limit confidence interval ¿ 16− ( 1.0018 )∗
( 1.2
√144 )=15.90
3
Paraphrase This Document
Need a fresh take? Get an instant paraphrase of this document with our AI Paraphraser

Upper limit confidence interval ¿ 16+ ( 1.0018 )∗( 1.2
√144 )=16.10
68.36% confidence interval [5.90 16.10]
b. 95% confidence interval for average monthly electric bills =?
The z value for 95% confidence interval = 1.96
Lower limit confidence interval ¿ 16− ( 1.96 )∗
( 1.2
√ 144 )=15.80
Upper limit confidence interval ¿ 16+ ( 1.96 )∗
( 1.2
√144 )=16.20
95% confidence interval [15.80 16.20]
PART B
Area under the Standard Normal Curve
(a) Area between z =0 and z = 2.5
Area ¿ P ( 0<Z<2.5 )
From standard normal table:
P ( z ≤ 2.5 )=0.99379
P ( z ≤ 0 )=0.5
Area ¿ P ( 0<Z<2.5 )=P ( z ≤ 2.5 )−P ( z ≤ 0 ) =0.99379−0.5=0.49379
4

Therefore, the area between z =0 and z = 2.5 is 0.49379.
(b) Area between z =0 and z = 2.58
Area ¿ P ( 0<Z<2.5 )
From standard normal table:
P ( z ≤ 2.5 )=0.99506
P ( z ≤ 0 )=0.5
Area ¿ P ( 0<Z<2.58 )=P ( z ≤ 2.58 )−P ( z ≤ 0 ) =0.99506−0.5=0.49506
Therefore, the area between z =0 and z = 2.58 is 0.49506.
5
(b) Area between z =0 and z = 2.58
Area ¿ P ( 0<Z<2.5 )
From standard normal table:
P ( z ≤ 2.5 )=0.99506
P ( z ≤ 0 )=0.5
Area ¿ P ( 0<Z<2.58 )=P ( z ≤ 2.58 )−P ( z ≤ 0 ) =0.99506−0.5=0.49506
Therefore, the area between z =0 and z = 2.58 is 0.49506.
5
⊘ This is a preview!⊘
Do you want full access?
Subscribe today to unlock all pages.

Trusted by 1+ million students worldwide

(c) Mean μ= 270 points
Standard deviationσ = 35 points
Probability that a randomly chosen student will score between 200 and 340 points =?
P ( 200< x<340 )=P ( 200−270< x−μ<340−270 )
¿ P ( 200−270
35 < x−μ
σ < 340−270
35 )
¿ P ( −2< z< 2 )
From standard normal table:
P ( z ≤ 2¿¿ 0.97725 )
P ( z ≤−2 )=0.02275
¿ P (−2< z<2 )=P ( z< ¿ 2 )−P ( z <¿−2 )=0.97725−0.02275=0.9545
Hence, probability that a randomly chosen student will score between 200 and 340 points is
0.9545.
(d) Mean score μ = 270 points
Standard deviation σ = 35 points
Normal distribution
Let the score that put a student in 95th percentile is x.
The z score for 95th percentile = 1.644854
Hence,
z= x−μ
σ
6
Paraphrase This Document
Need a fresh take? Get an instant paraphrase of this document with our AI Paraphraser

1.644854= x −270
35
x=327.57
Thus, the score that put a student in 95th percentile is 327.57.
Hence, the minimum cut-off score would be 327.57.
INTERVAL ESTIMATION
Question 1
Sample = 225 phones
Sample mean = 6.5 min
Standard deviation = 1.5 min
99% confidence interval =?
Degree of freedom = 225-1 = 224
The t value for 99% confidence interval = 2.6
Confidence interval ¿ mean ±t∗
( standard deviation
√Sample observation )
Lower limit confidence interval ¿ 6.5− ( 2.6 )∗
( 1.5
√225 )=6.24
Upper limit confidence interval ¿ 6.5+ ( 2.6 )∗( 1.5
√225 )=6.76
7

99% confidence interval [6.24 6.76]
Question 2
Sample = 16 cars
Sample mean = 63.6 mph
Standard deviation = 4.8 mph
99% confidence interval =?
Degree of freedom = 16-1 = 15
The t value for 95% confidence interval = 2.13
Confidence interval ¿ mean ±t∗
( standard deviation
√Sample observation )
Lower limit confidence interval ¿ 63.6− ( 2.13 )∗
( 4.8
√16 )=61.04
Upper limit confidence interval ¿ 63.6+ ( 2.13 )∗( 4.8
√16 )=66.15
95% confidence interval [61.04 66.15]
Question 3
Sample = 36 days
Sample mean = 53.8 gallons
Standard deviation = 4.2 gallons
85% confidence interval =?
8
⊘ This is a preview!⊘
Do you want full access?
Subscribe today to unlock all pages.

Trusted by 1+ million students worldwide

Degree of freedom = 36-1 = 35
The t value for 85% confidence interval = 1.471
Confidence interval ¿ mean ±t∗( standard deviation
√Sample observation )
Lower limit confidence interval ¿ 53.8− ( 1.471 )∗
( 4.2
√36 )=57.77
Upper limit confidence interval ¿ 53.8+ ( 1.471 )∗
( 4.2
√ 36 )=54.83
85% confidence interval [57.77 54.83]
Question 4
Sample = 25 customers
Sample mean = $35.50
Standard deviation = $6.25
80% confidence interval =?
Degree of freedom = 25-1 = 24
The t value for 80% confidence interval = 1.317
Confidence interval ¿ mean ±t∗
( standard deviation
√Sample observation )
Lower limit confidence interval ¿ 35.50− ( 1.317 )∗( 6.25
√25 )=33.85
Upper limit confidence interval¿ 35.50+ ( 1.317 )∗
( 6.25
√25 )=37.15
80% confidence interval [33.85 37.15]
9
Paraphrase This Document
Need a fresh take? Get an instant paraphrase of this document with our AI Paraphraser

10
1 out of 11
Related Documents

Your All-in-One AI-Powered Toolkit for Academic Success.
+13062052269
info@desklib.com
Available 24*7 on WhatsApp / Email
Unlock your academic potential
Copyright © 2020–2025 A2Z Services. All Rights Reserved. Developed and managed by ZUCOL.