Statistics for Management: KCB School, EOQ, and Data Insights
VerifiedAdded on 2020/06/06
|20
|3380
|304
Report
AI Summary
This report delves into the application of statistical tools for management decision-making. It begins with an analysis of income levels in both public and private sectors, employing hypothesis testing and T-tests to compare male and female earnings, alongside the creation of earnings-time charts and annual growth rate calculations. The report then shifts focus to KCB School, presenting a pictorial representation and data analysis of student marks, calculating mean, mode, and standard deviation to assess performance. Measures of dispersion are explained, and a report is presented to the school director. Section B explores line charts, beta and intercept values, and their relationship to baby weight. Finally, the report examines delivery calculations and discusses the Economic Order Quantity (EOQ) model for inventory management, including its benefits. The report concludes with an analysis of the relationship between prices and the number of bedrooms. The report demonstrates the practical application of statistical methods in various business and educational contexts, providing insights into data analysis, hypothesis testing, and the use of statistical models for effective management.
Statistics For management
Paraphrase This Document
Need a fresh take? Get an instant paraphrase of this document with our AI Paraphraser
TABLE OF CONTENTS
INTRODUCTION...........................................................................................................................1
TASK 1............................................................................................................................................1
A) Hypothesis testing on income of employees in public sector...........................................1
B) Producing T test on income of workers in private entities...............................................2
C) Enumerating Earnings–Time chart based on income level...............................................3
D) Annual growth rate...........................................................................................................3
TASK 2............................................................................................................................................4
2.1 Presenting pictorial form of data......................................................................................4
2.2 Presenting data analysis....................................................................................................5
B) Explaining measures of dispersion....................................................................................7
2.3 Presentation of report to director of School.....................................................................7
SECTION B.....................................................................................................................................8
2.4 Line chart..........................................................................................................................8
..........................................................................................................................................................9
..........................................................................................................................................................9
..........................................................................................................................................................9
TASK 3..........................................................................................................................................10
A) Calculating deliveries made in each trips........................................................................10
B) Presenting computation of deliveries..............................................................................10
C) Discussing EOQ..............................................................................................................10
TASK 4..........................................................................................................................................12
4.1 Data analysis...................................................................................................................12
........................................................................................................................................................14
........................................................................................................................................................14
4.2 Determining relationship between prices and bedrooms................................................15
CONCLUSION..............................................................................................................................16
REFERENCES..............................................................................................................................17
INTRODUCTION
Statistics is quite useful tool used by management and statisticians for collecting
necessary information to draw out concrete solutions. The present report deals with importance
of statistics for management to draw effective conclusions by posing several problems. It also
discusses how income level of men and women in private and public sector differs from each
other. Moreover, it also explains importance of mean, mode and standard deviation for analysing
marks scored by students of KCB School. Measures of dispersion is also enumerated quite
effectively. The report also highlights benefits of using EOQ model for purchasing stock in
desired quantity and also number of bedrooms and prices is also discussed assessing how prices
changes. Thus, statistical tools are effective and meaningful to management to interpret
information in the best possible way.
TASK 1
A) Hypothesis testing on income of employees in public sector
Null hypothesis is carried out to assess variations in income level.
H 0 - No difference between income level of male and female
H 1 - Significant difference between income level of male and female in public sector
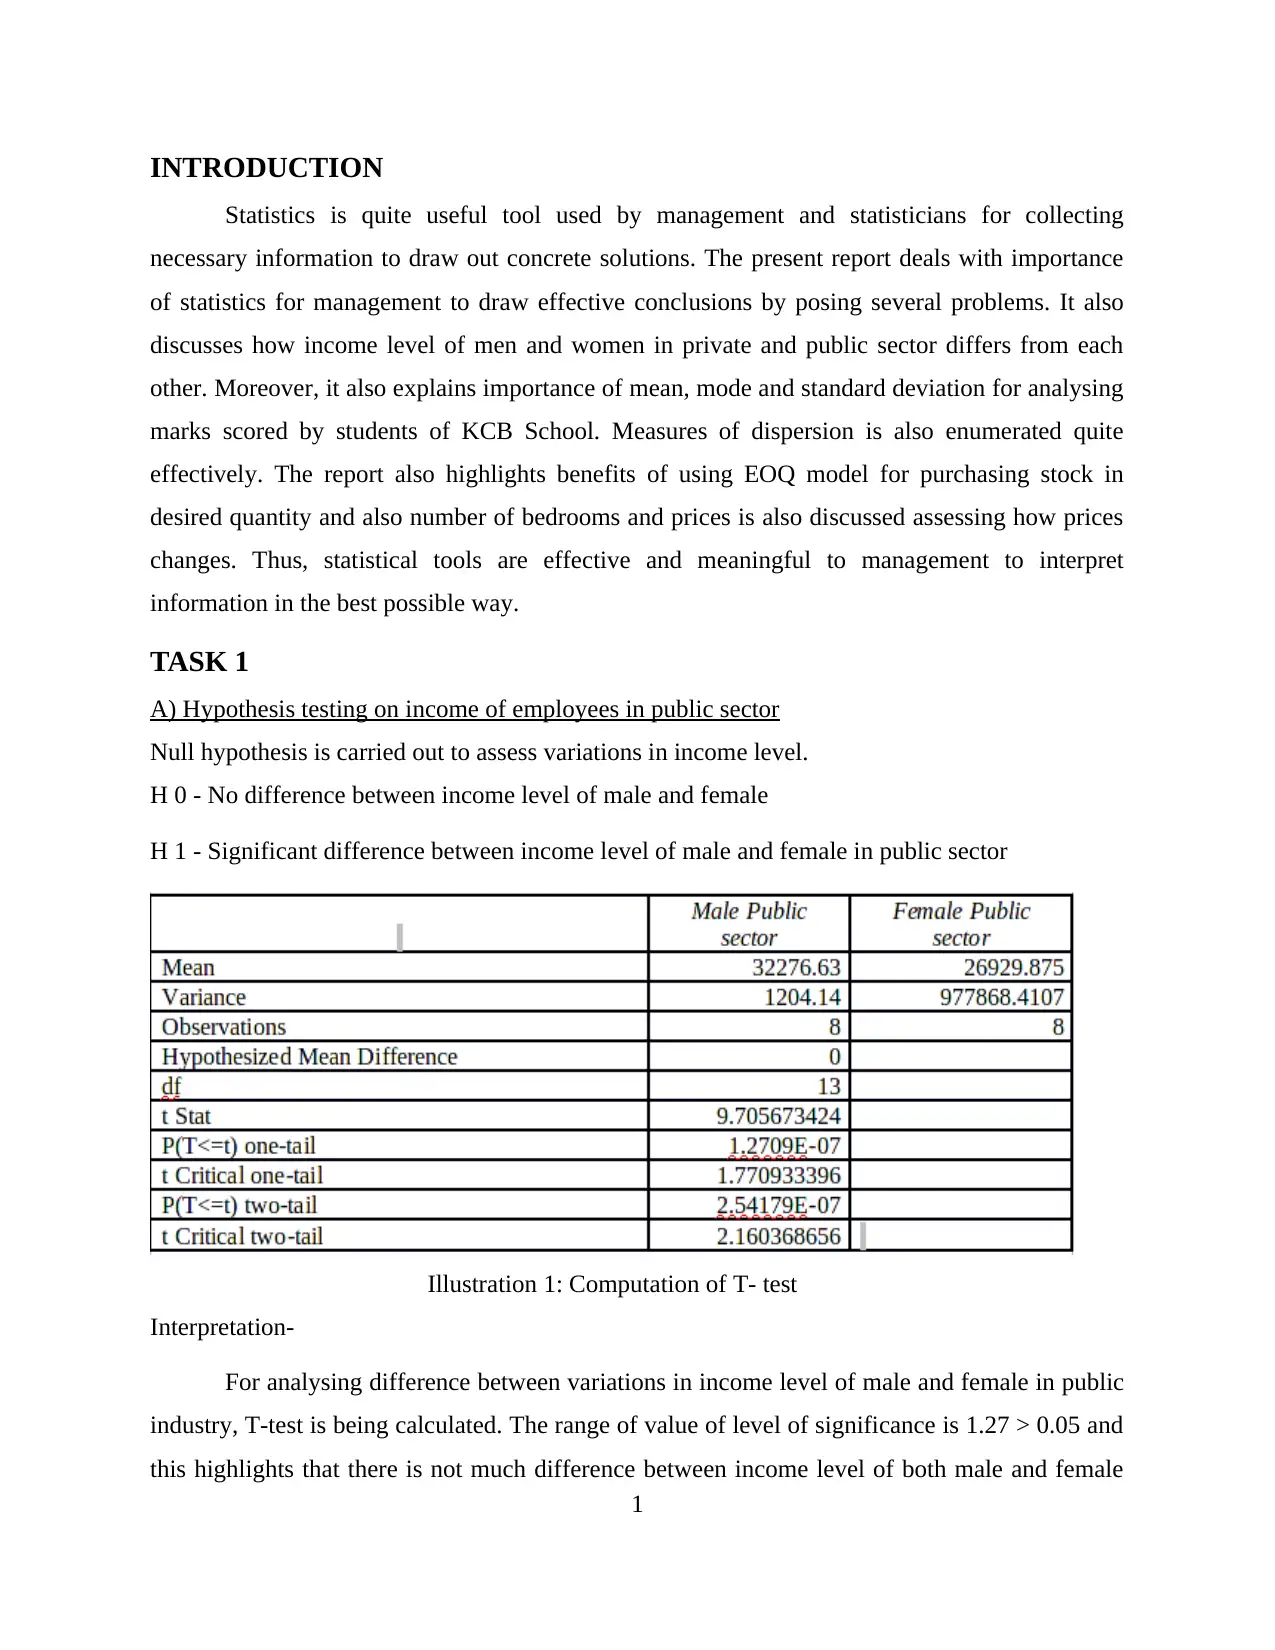
Illustration 1: Computation of T- test
Interpretation-
For analysing difference between variations in income level of male and female in public
industry, T-test is being calculated. The range of value of level of significance is 1.27 > 0.05 and
this highlights that there is not much difference between income level of both male and female
1
Statistics is quite useful tool used by management and statisticians for collecting
necessary information to draw out concrete solutions. The present report deals with importance
of statistics for management to draw effective conclusions by posing several problems. It also
discusses how income level of men and women in private and public sector differs from each
other. Moreover, it also explains importance of mean, mode and standard deviation for analysing
marks scored by students of KCB School. Measures of dispersion is also enumerated quite
effectively. The report also highlights benefits of using EOQ model for purchasing stock in
desired quantity and also number of bedrooms and prices is also discussed assessing how prices
changes. Thus, statistical tools are effective and meaningful to management to interpret
information in the best possible way.
TASK 1
A) Hypothesis testing on income of employees in public sector
Null hypothesis is carried out to assess variations in income level.
H 0 - No difference between income level of male and female
H 1 - Significant difference between income level of male and female in public sector
Illustration 1: Computation of T- test
Interpretation-
For analysing difference between variations in income level of male and female in public
industry, T-test is being calculated. The range of value of level of significance is 1.27 > 0.05 and
this highlights that there is not much difference between income level of both male and female
1
⊘ This is a preview!⊘
Do you want full access?
Subscribe today to unlock all pages.
Trusted by 1+ million students worldwide
workers. This is conveyed by calculations that income of men is 32276 while of women is 26929
which shows little variations or difference between them and with little difference, men is ahead.
This means that no gender biasness is prevailing in public sector and government is promoting
women quite effectively with men as well. T- test is drawn which shows that difference between
value of variance and that of mean. The table shows that no such difference is observed in
income level of men and women.
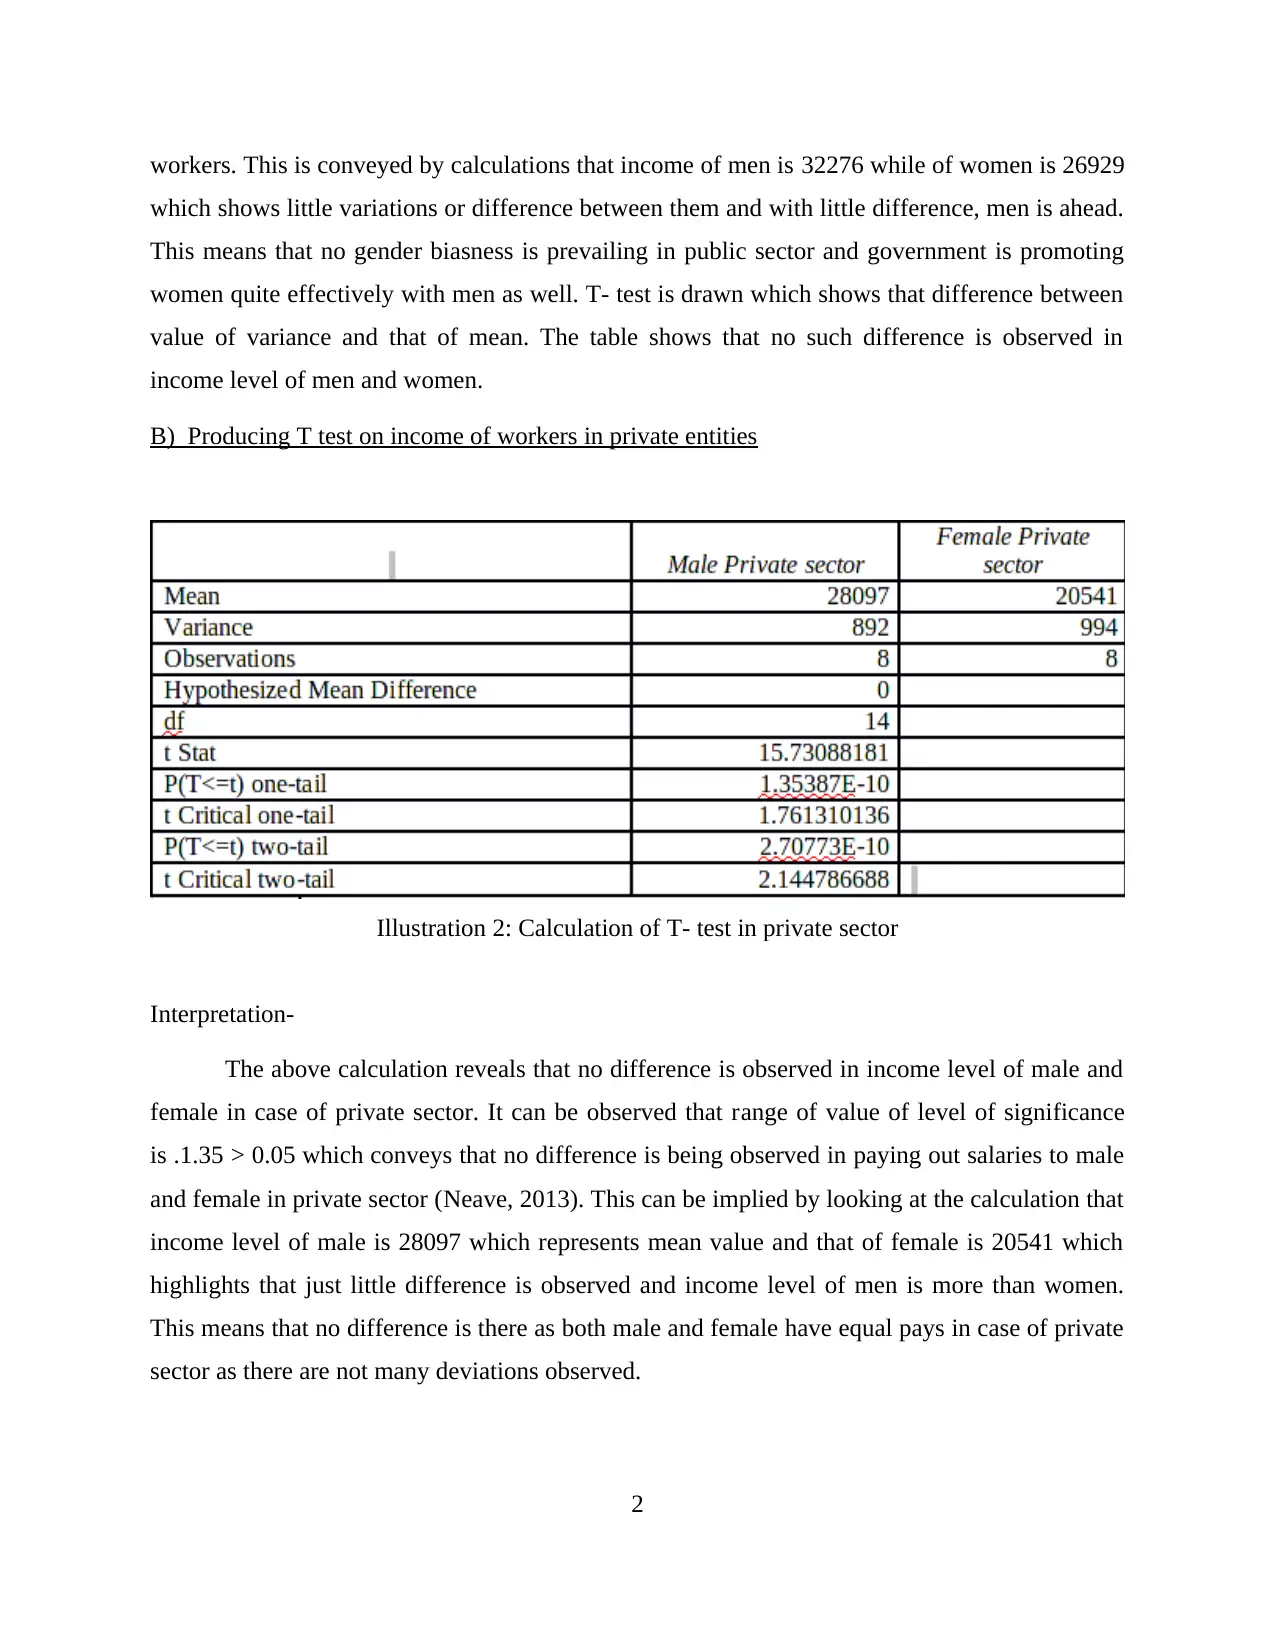
B) Producing T test on income of workers in private entities
Illustration 2: Calculation of T- test in private sector
Interpretation-
The above calculation reveals that no difference is observed in income level of male and
female in case of private sector. It can be observed that range of value of level of significance
is .1.35 > 0.05 which conveys that no difference is being observed in paying out salaries to male
and female in private sector (Neave, 2013). This can be implied by looking at the calculation that
income level of male is 28097 which represents mean value and that of female is 20541 which
highlights that just little difference is observed and income level of men is more than women.
This means that no difference is there as both male and female have equal pays in case of private
sector as there are not many deviations observed.
2
which shows little variations or difference between them and with little difference, men is ahead.
This means that no gender biasness is prevailing in public sector and government is promoting
women quite effectively with men as well. T- test is drawn which shows that difference between
value of variance and that of mean. The table shows that no such difference is observed in
income level of men and women.
B) Producing T test on income of workers in private entities
Illustration 2: Calculation of T- test in private sector
Interpretation-
The above calculation reveals that no difference is observed in income level of male and
female in case of private sector. It can be observed that range of value of level of significance
is .1.35 > 0.05 which conveys that no difference is being observed in paying out salaries to male
and female in private sector (Neave, 2013). This can be implied by looking at the calculation that
income level of male is 28097 which represents mean value and that of female is 20541 which
highlights that just little difference is observed and income level of men is more than women.
This means that no difference is there as both male and female have equal pays in case of private
sector as there are not many deviations observed.
2
Paraphrase This Document
Need a fresh take? Get an instant paraphrase of this document with our AI Paraphraser
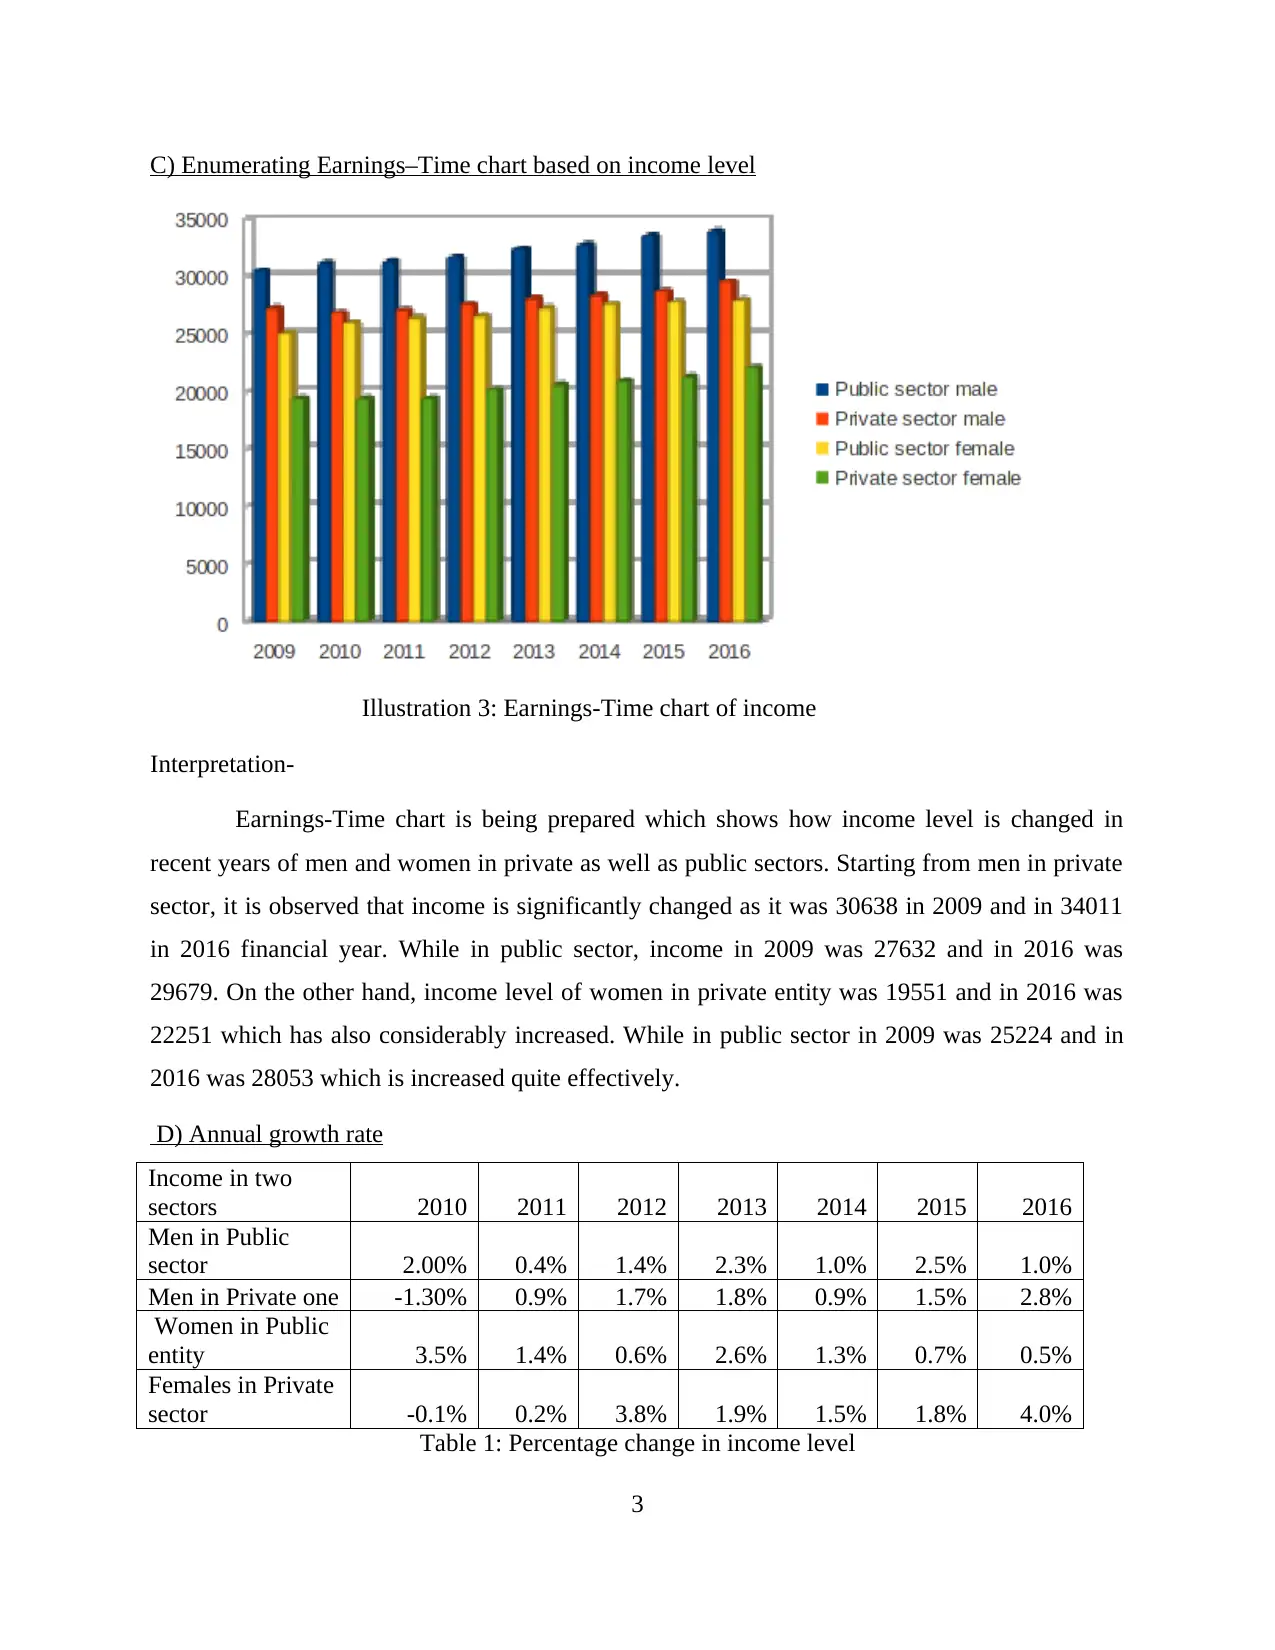
C) Enumerating Earnings–Time chart based on income level
Illustration 3: Earnings-Time chart of income
Interpretation-
Earnings-Time chart is being prepared which shows how income level is changed in
recent years of men and women in private as well as public sectors. Starting from men in private
sector, it is observed that income is significantly changed as it was 30638 in 2009 and in 34011
in 2016 financial year. While in public sector, income in 2009 was 27632 and in 2016 was
29679. On the other hand, income level of women in private entity was 19551 and in 2016 was
22251 which has also considerably increased. While in public sector in 2009 was 25224 and in
2016 was 28053 which is increased quite effectively.
D) Annual growth rate
Income in two
sectors 2010 2011 2012 2013 2014 2015 2016
Men in Public
sector 2.00% 0.4% 1.4% 2.3% 1.0% 2.5% 1.0%
Men in Private one -1.30% 0.9% 1.7% 1.8% 0.9% 1.5% 2.8%
Women in Public
entity 3.5% 1.4% 0.6% 2.6% 1.3% 0.7% 0.5%
Females in Private
sector -0.1% 0.2% 3.8% 1.9% 1.5% 1.8% 4.0%
Table 1: Percentage change in income level
3
Interpretation-
It can be analysed that significant changes have been occurred in the context of income
level of both men and women which is shown by table. Starting with income of male in public
sector which is gone to 1 % to 2 % and is highly deviated. While, private sector shows
percentage change which is 1.5 % to 2.5 % and this implies that income level is more in public
sector (Luft and Back, 2013). On the other hand, female income in private entity is 3.5 % to 0.5
% which is significantly declined and in public sector is 0.2 % to 4 % which is maximum as
compared to private sector. Income level shows much variations.
TASK 2
2.1 Presenting pictorial form of data
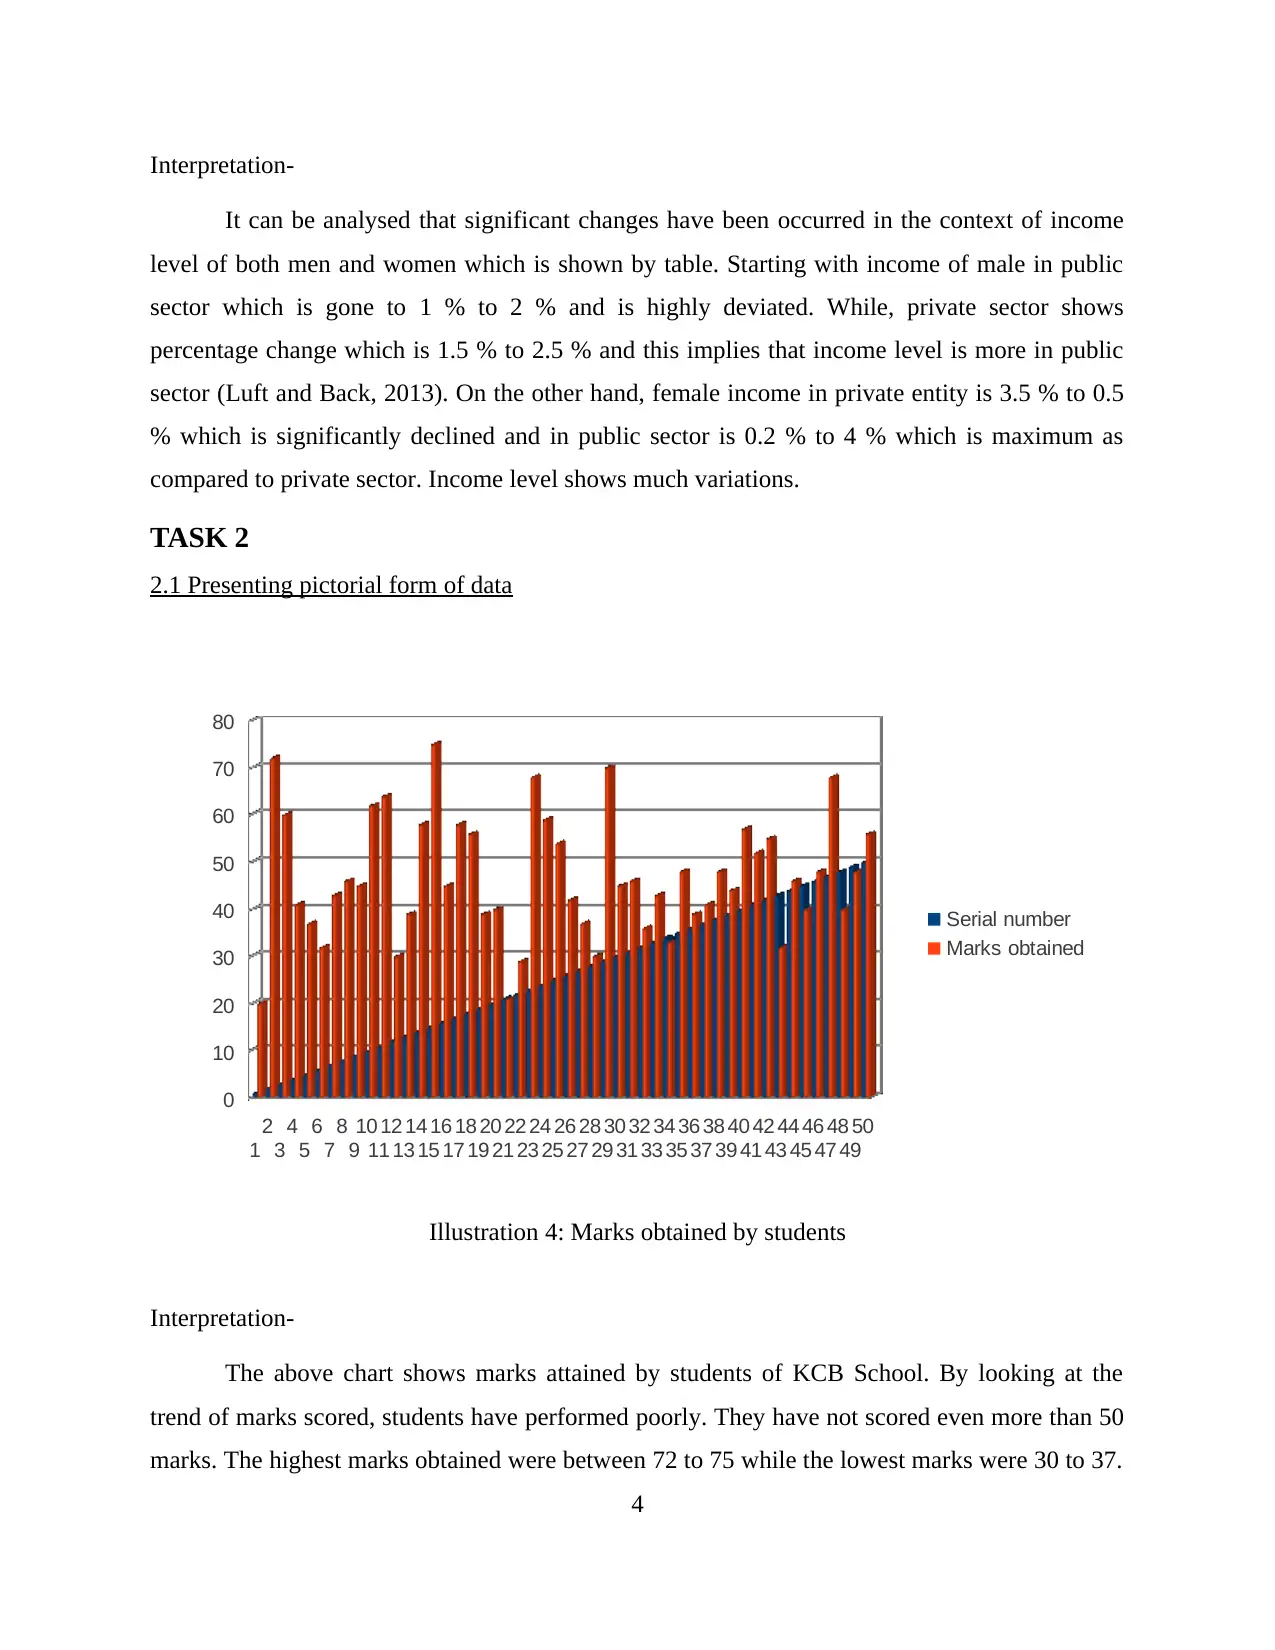
Interpretation-
The above chart shows marks attained by students of KCB School. By looking at the
trend of marks scored, students have performed poorly. They have not scored even more than 50
marks. The highest marks obtained were between 72 to 75 while the lowest marks were 30 to 37.
4
1
2
3
4
5
6
7
8
9
10
11
12
13
14
15
16
17
18
19
20
21
22
23
24
25
26
27
28
29
30
31
32
33
34
35
36
37
38
39
40
41
42
43
44
45
46
47
48
49
50
0
10
20
30
40
50
60
70
80
Serial number
Marks obtained
Illustration 4: Marks obtained by students
It can be analysed that significant changes have been occurred in the context of income
level of both men and women which is shown by table. Starting with income of male in public
sector which is gone to 1 % to 2 % and is highly deviated. While, private sector shows
percentage change which is 1.5 % to 2.5 % and this implies that income level is more in public
sector (Luft and Back, 2013). On the other hand, female income in private entity is 3.5 % to 0.5
% which is significantly declined and in public sector is 0.2 % to 4 % which is maximum as
compared to private sector. Income level shows much variations.
TASK 2
2.1 Presenting pictorial form of data
Interpretation-
The above chart shows marks attained by students of KCB School. By looking at the
trend of marks scored, students have performed poorly. They have not scored even more than 50
marks. The highest marks obtained were between 72 to 75 while the lowest marks were 30 to 37.
4
1
2
3
4
5
6
7
8
9
10
11
12
13
14
15
16
17
18
19
20
21
22
23
24
25
26
27
28
29
30
31
32
33
34
35
36
37
38
39
40
41
42
43
44
45
46
47
48
49
50
0
10
20
30
40
50
60
70
80
Serial number
Marks obtained
Illustration 4: Marks obtained by students
⊘ This is a preview!⊘
Do you want full access?
Subscribe today to unlock all pages.
Trusted by 1+ million students worldwide
This shows that lot of improvement need to be done by students so that they may score at least
more than 50 marks in the subjects. For this, teachers need to follow strict policies so that marks
can be enhanced quite effectively. Such as concentration power of students may be improved by
asking questions in between ongoing classes. Furthermore, staff should insist to students to write
notes so that they may grasp and understand things quite easily. Apart from this, parent should
also have the main role in enhancing marks of students by insisting them to follow guidelines of
teachers and as such, overall grades may be effectively improved.
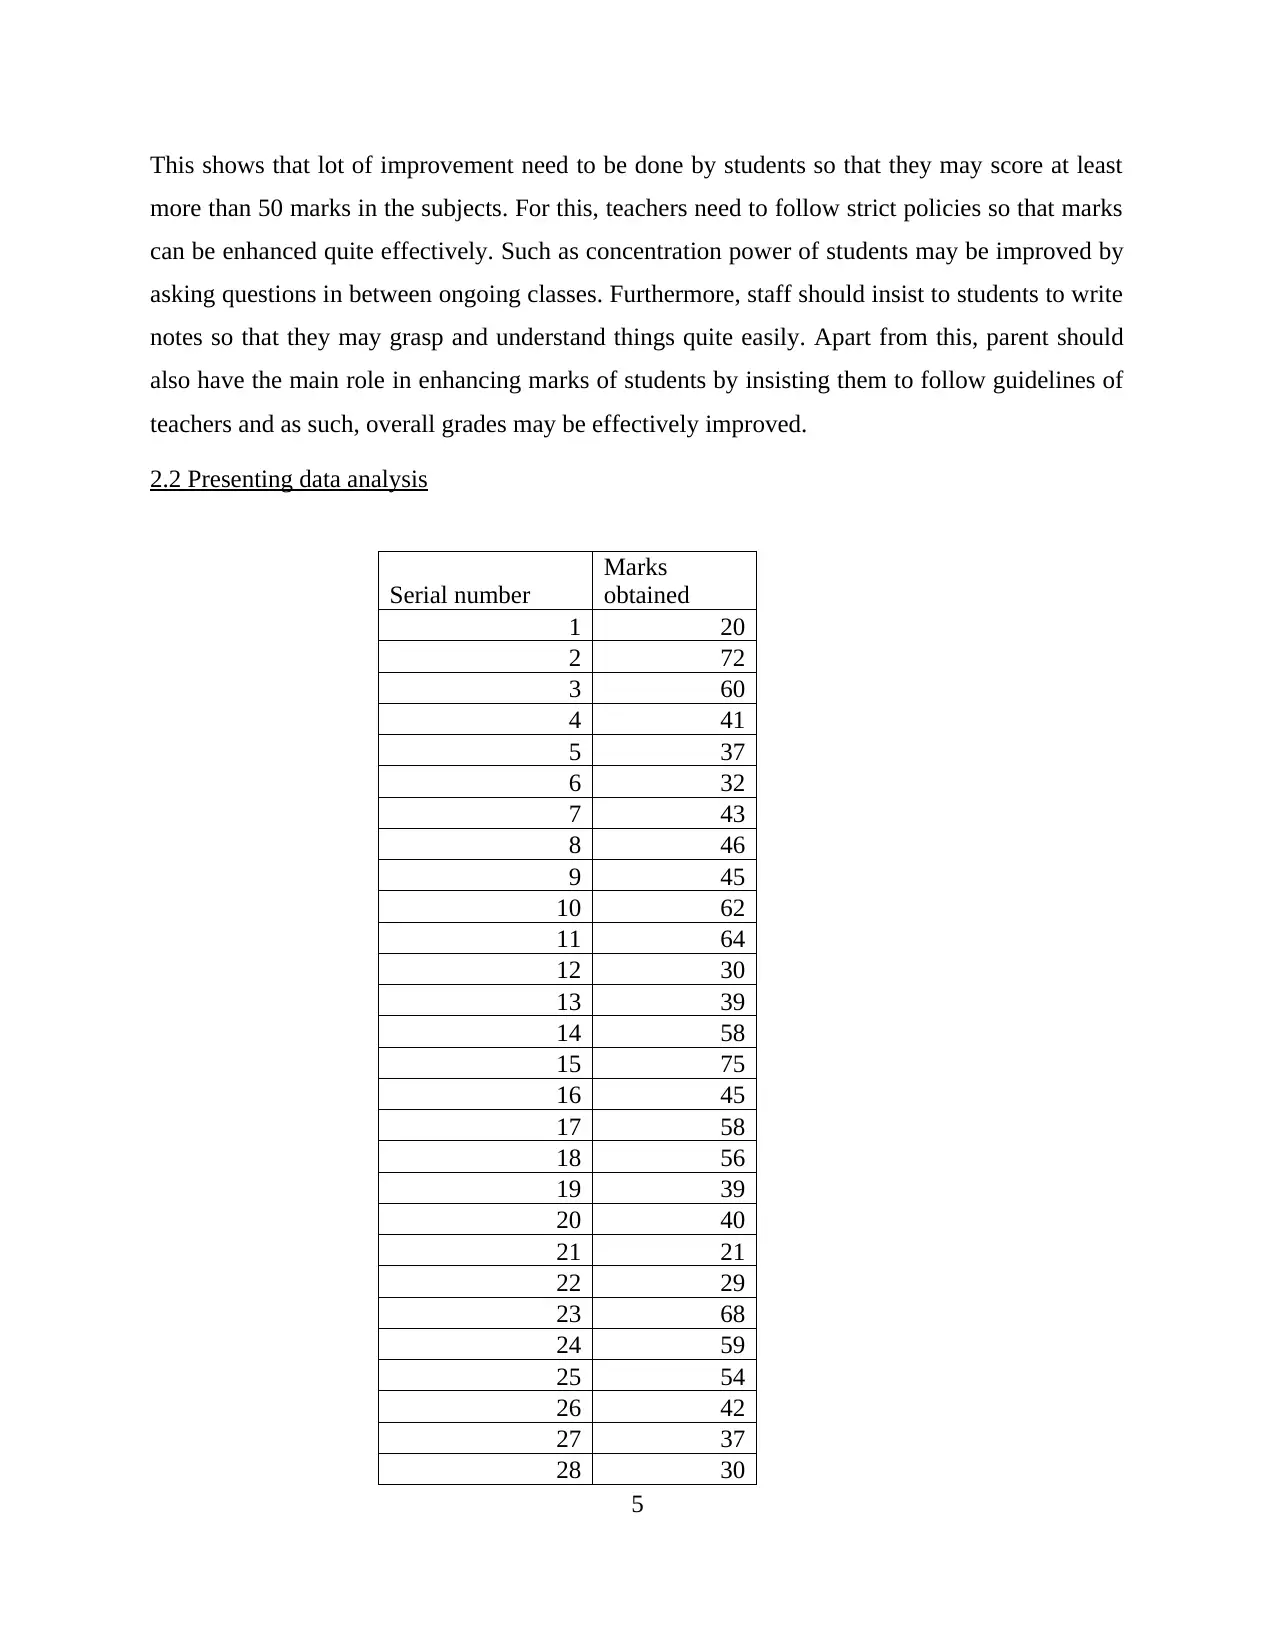
2.2 Presenting data analysis
Serial number
Marks
obtained
1 20
2 72
3 60
4 41
5 37
6 32
7 43
8 46
9 45
10 62
11 64
12 30
13 39
14 58
15 75
16 45
17 58
18 56
19 39
20 40
21 21
22 29
23 68
24 59
25 54
26 42
27 37
28 30
5
more than 50 marks in the subjects. For this, teachers need to follow strict policies so that marks
can be enhanced quite effectively. Such as concentration power of students may be improved by
asking questions in between ongoing classes. Furthermore, staff should insist to students to write
notes so that they may grasp and understand things quite easily. Apart from this, parent should
also have the main role in enhancing marks of students by insisting them to follow guidelines of
teachers and as such, overall grades may be effectively improved.
2.2 Presenting data analysis
Serial number
Marks
obtained
1 20
2 72
3 60
4 41
5 37
6 32
7 43
8 46
9 45
10 62
11 64
12 30
13 39
14 58
15 75
16 45
17 58
18 56
19 39
20 40
21 21
22 29
23 68
24 59
25 54
26 42
27 37
28 30
5
Paraphrase This Document
Need a fresh take? Get an instant paraphrase of this document with our AI Paraphraser
29 70
30 45
31 46
32 36
33 43
34 33
35 48
36 39
37 41
38 48
39 44
40 57
41 52
42 55
43 32
44 46
45 40
46 48
47 68
48 40
49 48
50 56
Mean 46.74
Mode 48
Standard
Deviation 12.82187226
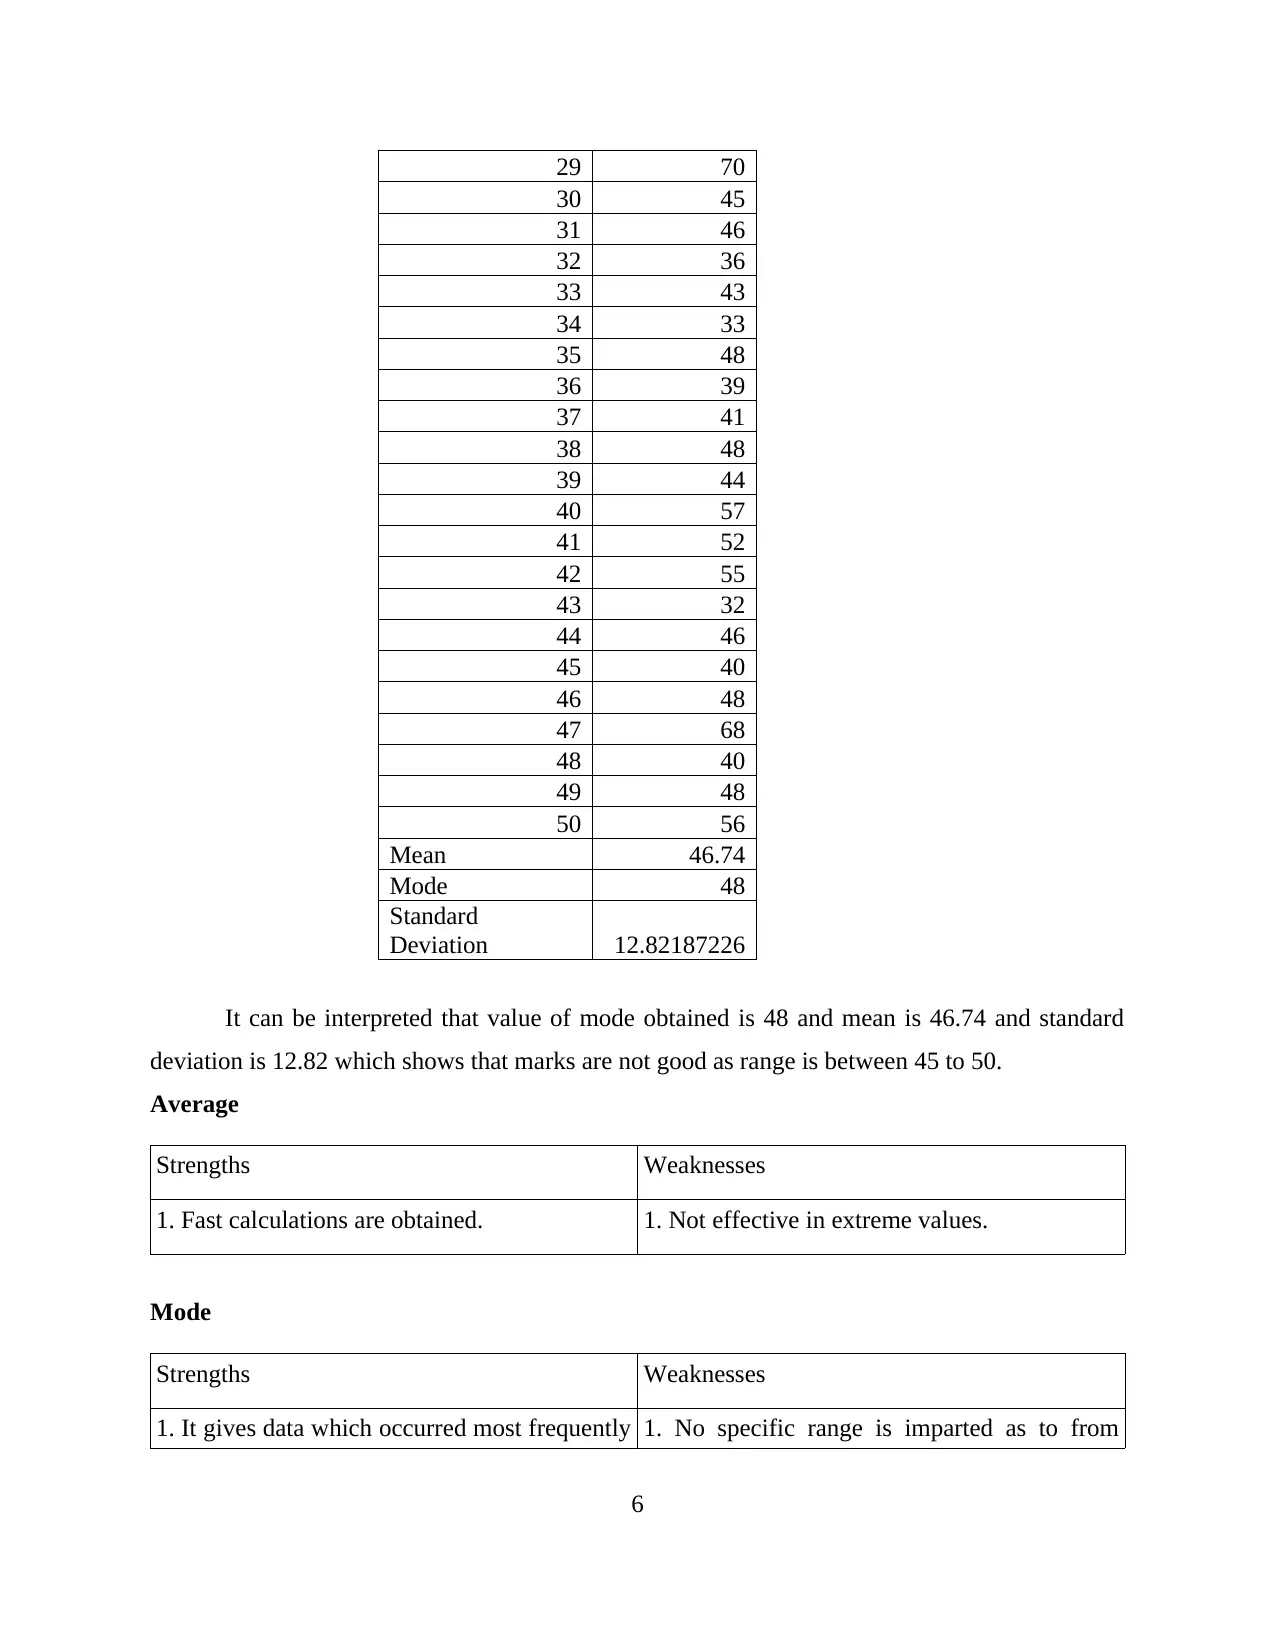
It can be interpreted that value of mode obtained is 48 and mean is 46.74 and standard
deviation is 12.82 which shows that marks are not good as range is between 45 to 50.
Average
Strengths Weaknesses
1. Fast calculations are obtained. 1. Not effective in extreme values.
Mode
Strengths Weaknesses
1. It gives data which occurred most frequently 1. No specific range is imparted as to from
6
30 45
31 46
32 36
33 43
34 33
35 48
36 39
37 41
38 48
39 44
40 57
41 52
42 55
43 32
44 46
45 40
46 48
47 68
48 40
49 48
50 56
Mean 46.74
Mode 48
Standard
Deviation 12.82187226
It can be interpreted that value of mode obtained is 48 and mean is 46.74 and standard
deviation is 12.82 which shows that marks are not good as range is between 45 to 50.
Average
Strengths Weaknesses
1. Fast calculations are obtained. 1. Not effective in extreme values.
Mode
Strengths Weaknesses
1. It gives data which occurred most frequently 1. No specific range is imparted as to from
6
in the whole data set and helpful in case of
large data.
where data has been occurred.
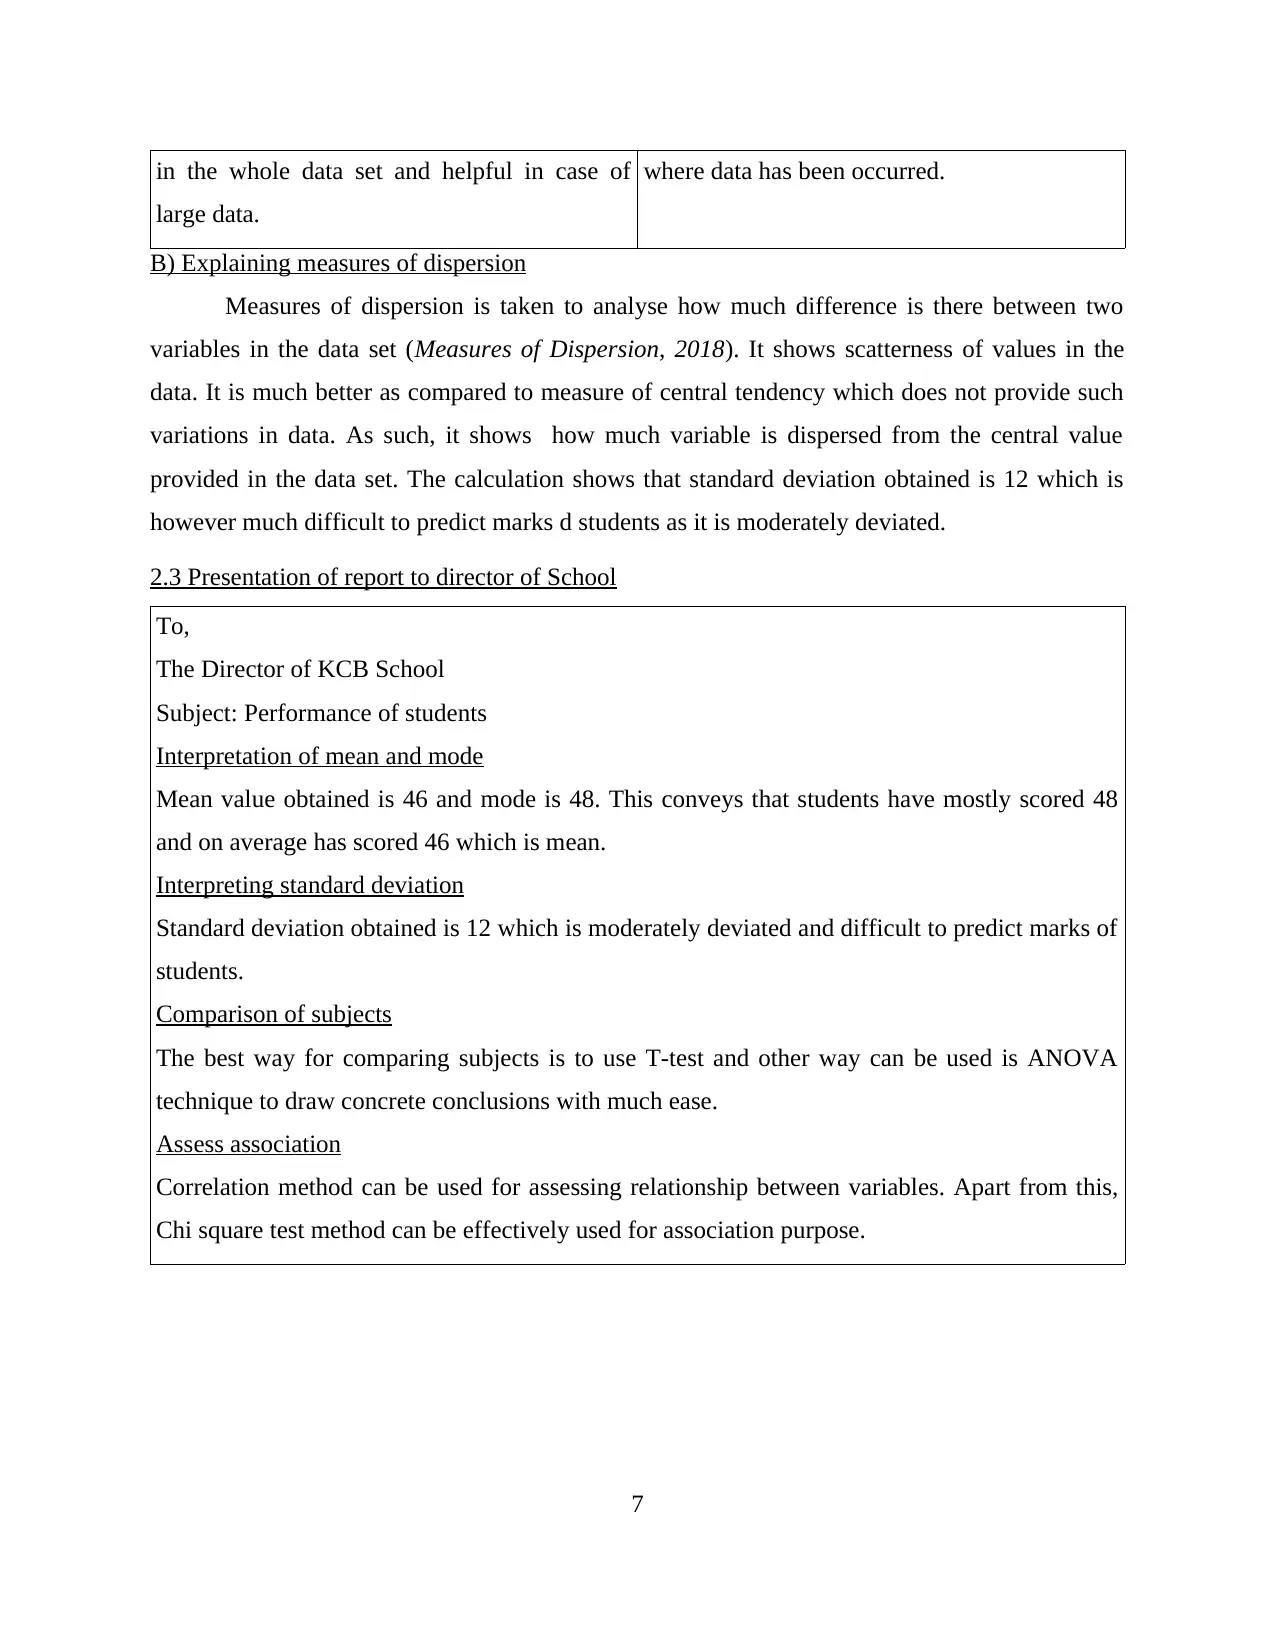
B) Explaining measures of dispersion
Measures of dispersion is taken to analyse how much difference is there between two
variables in the data set (Measures of Dispersion, 2018). It shows scatterness of values in the
data. It is much better as compared to measure of central tendency which does not provide such
variations in data. As such, it shows how much variable is dispersed from the central value
provided in the data set. The calculation shows that standard deviation obtained is 12 which is
however much difficult to predict marks d students as it is moderately deviated.
2.3 Presentation of report to director of School
To,
The Director of KCB School
Subject: Performance of students
Interpretation of mean and mode
Mean value obtained is 46 and mode is 48. This conveys that students have mostly scored 48
and on average has scored 46 which is mean.
Interpreting standard deviation
Standard deviation obtained is 12 which is moderately deviated and difficult to predict marks of
students.
Comparison of subjects
The best way for comparing subjects is to use T-test and other way can be used is ANOVA
technique to draw concrete conclusions with much ease.
Assess association
Correlation method can be used for assessing relationship between variables. Apart from this,
Chi square test method can be effectively used for association purpose.
7
large data.
where data has been occurred.
B) Explaining measures of dispersion
Measures of dispersion is taken to analyse how much difference is there between two
variables in the data set (Measures of Dispersion, 2018). It shows scatterness of values in the
data. It is much better as compared to measure of central tendency which does not provide such
variations in data. As such, it shows how much variable is dispersed from the central value
provided in the data set. The calculation shows that standard deviation obtained is 12 which is
however much difficult to predict marks d students as it is moderately deviated.
2.3 Presentation of report to director of School
To,
The Director of KCB School
Subject: Performance of students
Interpretation of mean and mode
Mean value obtained is 46 and mode is 48. This conveys that students have mostly scored 48
and on average has scored 46 which is mean.
Interpreting standard deviation
Standard deviation obtained is 12 which is moderately deviated and difficult to predict marks of
students.
Comparison of subjects
The best way for comparing subjects is to use T-test and other way can be used is ANOVA
technique to draw concrete conclusions with much ease.
Assess association
Correlation method can be used for assessing relationship between variables. Apart from this,
Chi square test method can be effectively used for association purpose.
7
⊘ This is a preview!⊘
Do you want full access?
Subscribe today to unlock all pages.
Trusted by 1+ million students worldwide
SECTION B
2.4 Line chart
Illustration 5: Line chart
8
2.4 Line chart
Illustration 5: Line chart
8
Paraphrase This Document
Need a fresh take? Get an instant paraphrase of this document with our AI Paraphraser
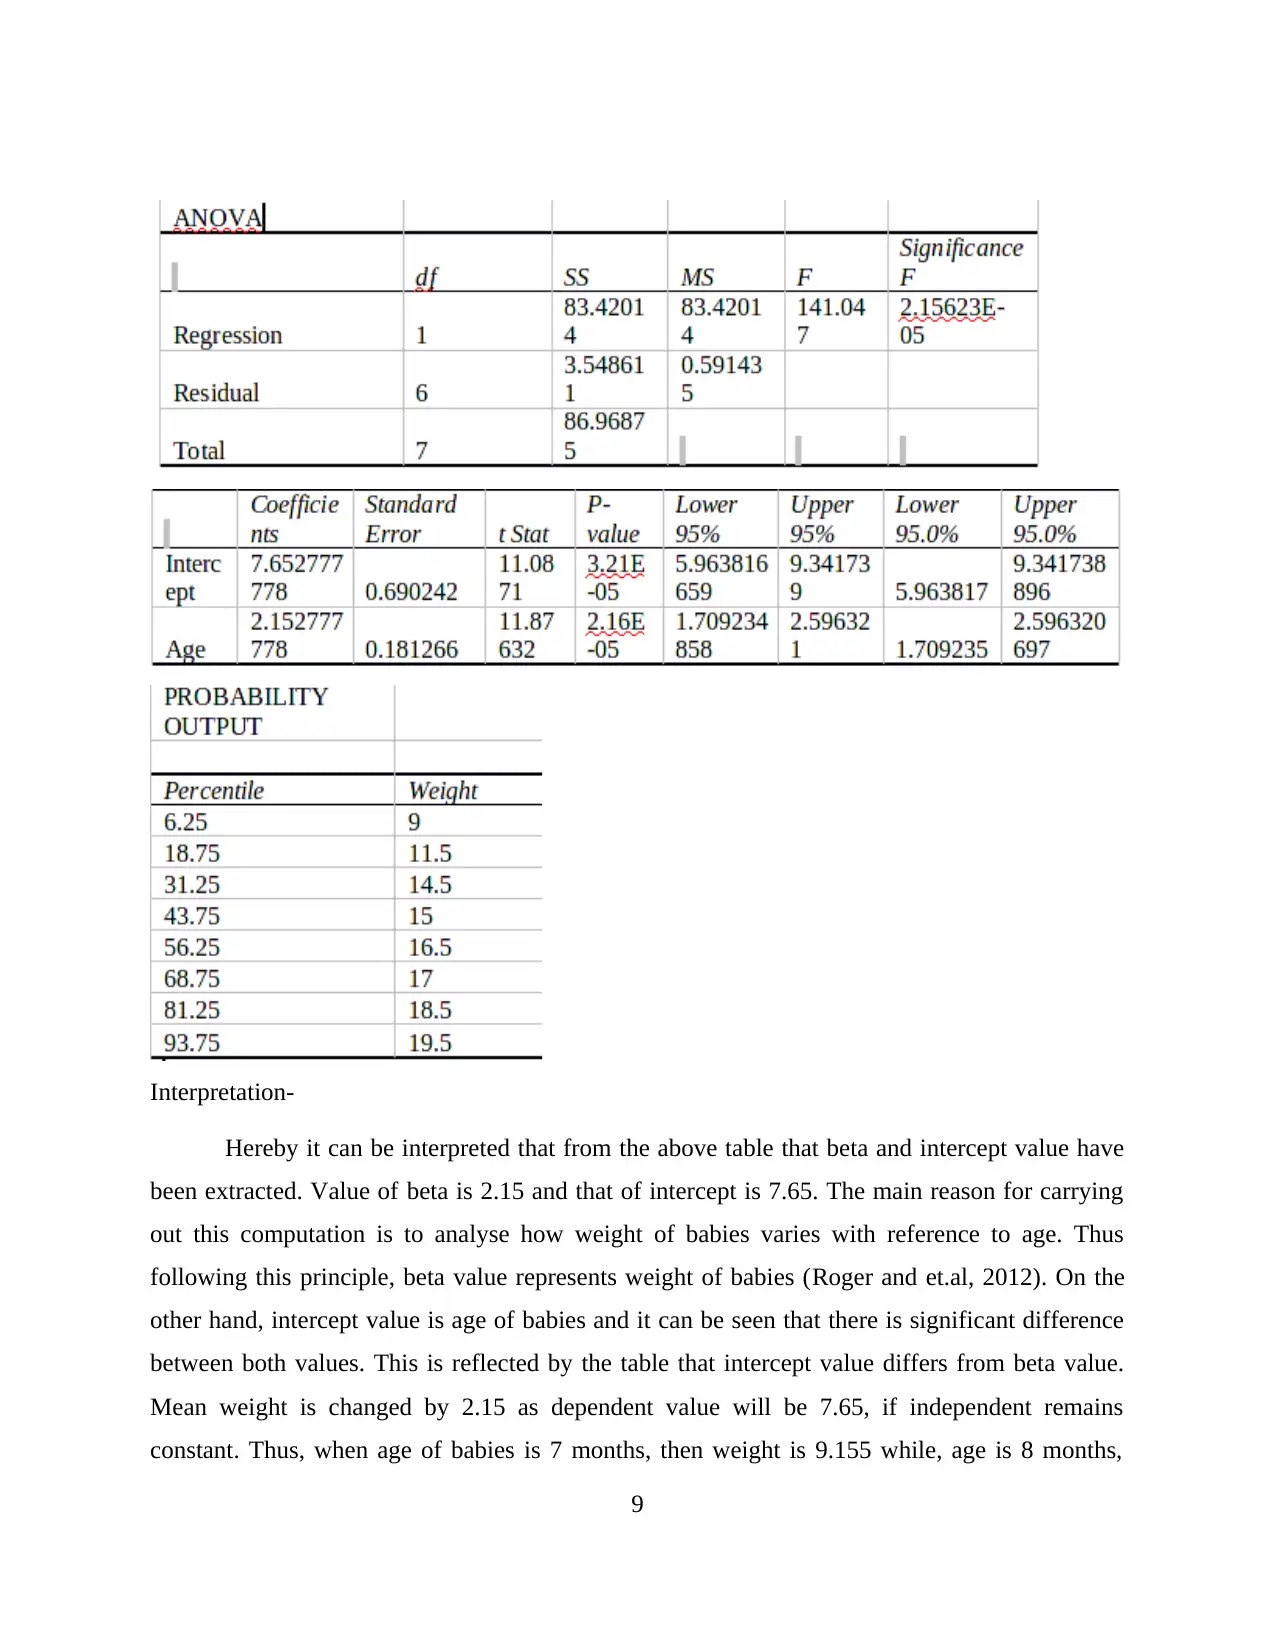
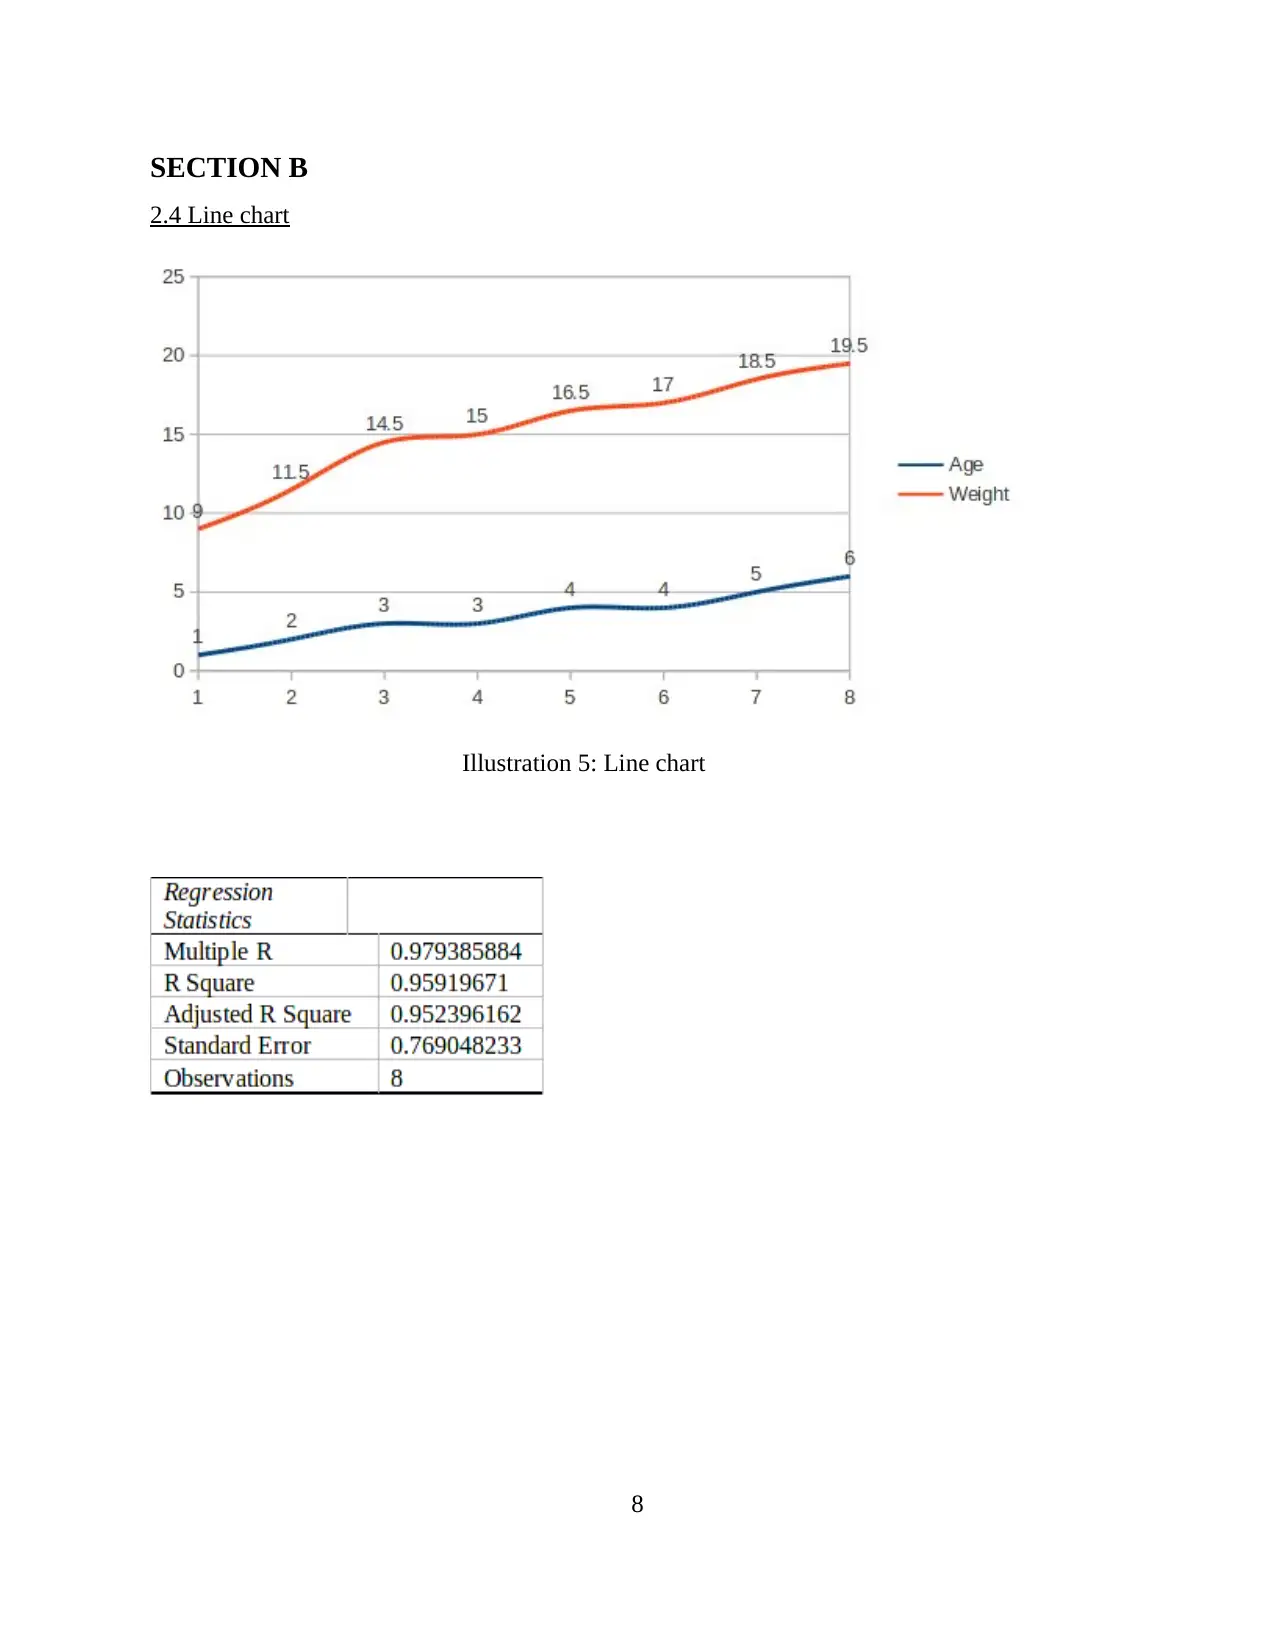
Interpretation-
Hereby it can be interpreted that from the above table that beta and intercept value have
been extracted. Value of beta is 2.15 and that of intercept is 7.65. The main reason for carrying
out this computation is to analyse how weight of babies varies with reference to age. Thus
following this principle, beta value represents weight of babies (Roger and et.al, 2012). On the
other hand, intercept value is age of babies and it can be seen that there is significant difference
between both values. This is reflected by the table that intercept value differs from beta value.
Mean weight is changed by 2.15 as dependent value will be 7.65, if independent remains
constant. Thus, when age of babies is 7 months, then weight is 9.155 while, age is 8 months,
9
weight is 9.37 months, and in case of age of 9 months, then weight of babies is 9.58. The level of
significance is 2.15 > 0.05 which implies no significant difference is there. Apart from this,
value of R obtained is 0.95 and that of multiple R is 0.97.
TASK 3
A) Calculating deliveries made in each trips
The deliveries made in several rounds are total amount of 450000. Thus, it can be
interpreted that sales amount is based on just estimated value and the same is taken for producing
results.
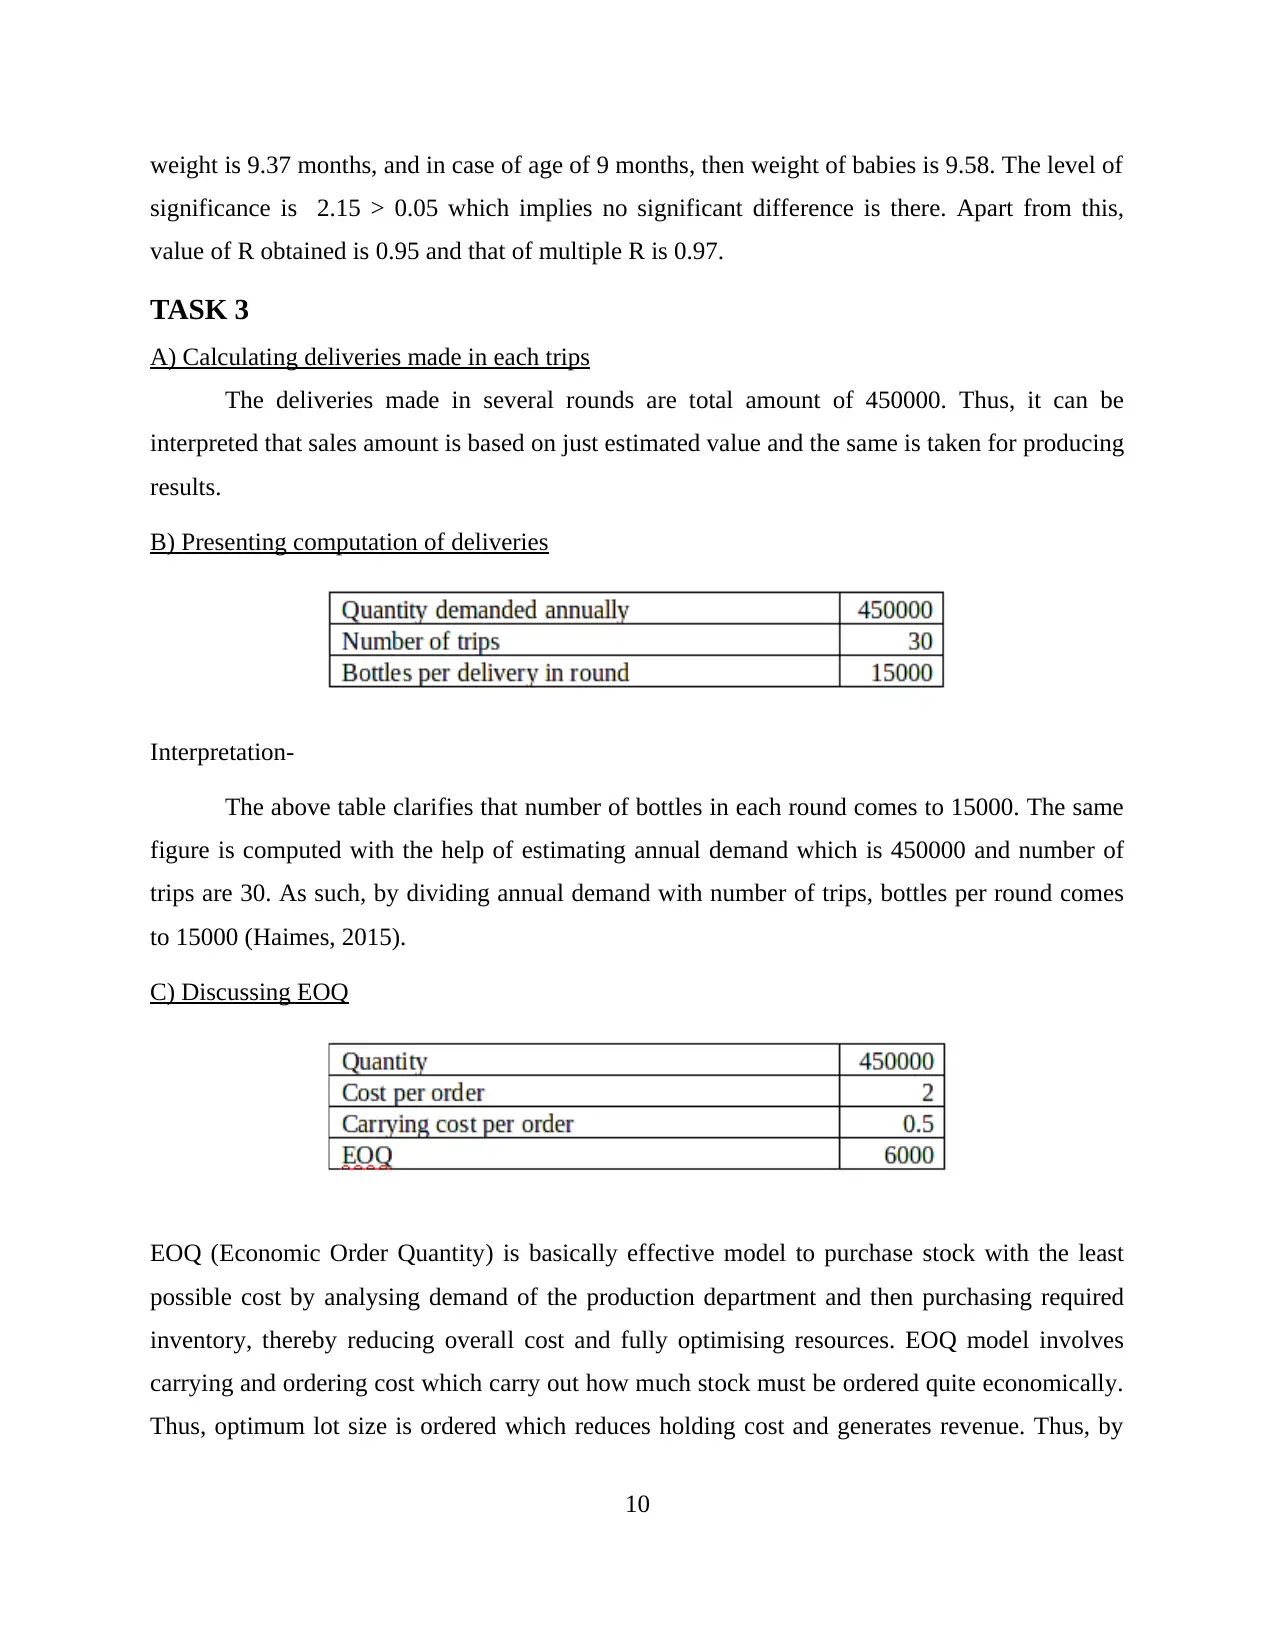
B) Presenting computation of deliveries
Interpretation-
The above table clarifies that number of bottles in each round comes to 15000. The same
figure is computed with the help of estimating annual demand which is 450000 and number of
trips are 30. As such, by dividing annual demand with number of trips, bottles per round comes
to 15000 (Haimes, 2015).
C) Discussing EOQ
EOQ (Economic Order Quantity) is basically effective model to purchase stock with the least
possible cost by analysing demand of the production department and then purchasing required
inventory, thereby reducing overall cost and fully optimising resources. EOQ model involves
carrying and ordering cost which carry out how much stock must be ordered quite economically.
Thus, optimum lot size is ordered which reduces holding cost and generates revenue. Thus, by
10
significance is 2.15 > 0.05 which implies no significant difference is there. Apart from this,
value of R obtained is 0.95 and that of multiple R is 0.97.
TASK 3
A) Calculating deliveries made in each trips
The deliveries made in several rounds are total amount of 450000. Thus, it can be
interpreted that sales amount is based on just estimated value and the same is taken for producing
results.
B) Presenting computation of deliveries
Interpretation-
The above table clarifies that number of bottles in each round comes to 15000. The same
figure is computed with the help of estimating annual demand which is 450000 and number of
trips are 30. As such, by dividing annual demand with number of trips, bottles per round comes
to 15000 (Haimes, 2015).
C) Discussing EOQ
EOQ (Economic Order Quantity) is basically effective model to purchase stock with the least
possible cost by analysing demand of the production department and then purchasing required
inventory, thereby reducing overall cost and fully optimising resources. EOQ model involves
carrying and ordering cost which carry out how much stock must be ordered quite economically.
Thus, optimum lot size is ordered which reduces holding cost and generates revenue. Thus, by
10
⊘ This is a preview!⊘
Do you want full access?
Subscribe today to unlock all pages.
Trusted by 1+ million students worldwide
1 out of 20
Related Documents


Your All-in-One AI-Powered Toolkit for Academic Success.
+13062052269
info@desklib.com
Available 24*7 on WhatsApp / Email
![[object Object]](/_next/static/media/star-bottom.7253800d.svg)
Unlock your academic potential
Copyright © 2020–2026 A2Z Services. All Rights Reserved. Developed and managed by ZUCOL.