Statistics for Management: Deliveroo Data Analysis & Interpretation
VerifiedAdded on 2023/06/16
|13
|2765
|148
Report
AI Summary
This report provides a comprehensive statistical analysis of Deliveroo's data, covering various aspects of management including quality, inventory, and capacity. It begins with an evaluation and interpretation of two data sources related to Deliveroo, followed by an analysis of qualitative and quantitative raw business data using appropriate statistical methods such as mean, median, mode, and chi-square tests. The report applies a range of statistical methods used in business planning, focusing on quality control, inventory management using ABC and XYZ analysis, and capacity management. Furthermore, it uses charts and tables to communicate findings for given variables, providing clear visualizations of the data. The analysis includes hypothesis testing and interpretations based on significance levels, concluding with insights into how statistical tools can improve business operations and decision-making within Deliveroo. Desklib provides students access to similar solved assignments and past papers.

Statistics for
Management
Management
Paraphrase This Document
Need a fresh take? Get an instant paraphrase of this document with our AI Paraphraser
Contents
Contents...........................................................................................................................................2
INTRODUCTION...........................................................................................................................1
TASK 1............................................................................................................................................1
P1: You must produce a report, which contains an evaluation AND an interpretation of TWO
sources of data relating to Deliveroo...........................................................................................1
P2: Evaluate data from a variety of sources using different methods of analysis.......................2
TASK 2............................................................................................................................................4
P3: Analyze and evaluate qualitative and quantitative raw business data from a range of
examples using appropriate statistical methods...........................................................................4
TASK 3............................................................................................................................................6
P4: Apply range of statistical methods used in business planning for quality, inventory and
capacity management...................................................................................................................6
TASK 4............................................................................................................................................7
P5: Using appropriate charts/tables communicate findings for a number of given variables.....7
CONCLUSION................................................................................................................................9
REFERENCES..............................................................................................................................10

⊘ This is a preview!⊘
Do you want full access?
Subscribe today to unlock all pages.
Trusted by 1+ million students worldwide
INTRODUCTION
Analytics are useful in almost each sector of marketing. Someone who has a massive
volume of information under their management appear being more advanced in their corporate
strategy in this time of information technology (Bolino, Long and Turnley, 2016).
Administration makes choices about many company elements by examining information and
employing multiple mathematical methodologies. Companies can discover and achieve its
predefined targets by utilising numerous statistics machine learning and information processing,
giving them an edge over its rivals. In this report there is a detailed evaluation of the company
named Deliveroo. Different analytical methodologies aid in corporate efficiency, stock, and
production schedules. Quantitative tools could be used by companies to predict. In a nutshell,
numbers have improved company operations simpler and more efficient, gaining a competitive
advantage.
TASK 1
P1: You must produce a report, which contains an evaluation AND an interpretation of TWO
sources of data relating to Deliveroo
Statistical data are information and numbers that are quantitative in nature. It is a branch of
knowledge which deals with the collecting, categorization, examination, and interpretation of
quantitative records about everything in order to make inferences based on its measurable
probability. This could handle tallies of data that are too large to be comprehended by ordinary
sight, because such data tends to behave in regular ways (Donnez and Dolmans, 2016). The
company that is Deliveroo does all the related aspects and that too in a detailed manner and thus
it is one of the reason for its huge success in the market as compared to its competitors in the
long run. It could be broken into 2 halves. The first is describing, whereas the second is
interpretive.
Data have the following features: Deliveroo does a lot of data analysis and thus all of them are
evaluated in a precise manner below-
Data are provided as numerical numbers so that facts could be tallied or estimated. It
means that the data or findings must be accessible to be expressed within several
numerical frameworks in order to be considered metrics. Statistical data could include
Paraphrase This Document
Need a fresh take? Get an instant paraphrase of this document with our AI Paraphraser
things like the amount of staff workers in a specific sector in multiple companies or the
yearly income of a corporation, such as $10000, $20000, and so on.
For analytics to be considered statistically, the observations must be aggregated. Metrics
cannot be defined as a set of statistical procedures. Instead, it ought to be a collection of
related events (Homburg, Jozić and Kuehnl, 2017).
Figures should be collected in a systematic manner. The material acquired in an
irresponsibility manner would pose difficulties in the methodology and lead to erroneous
conclusions.
Metrics should be gathered for a clearly defined goal. In the instance of a firm, if yearly
profit figures are gathered, the goals of gathering this information must be clearly
established prior to the sampling techniques.
Metrics are discovered or assessed using reasonable precision standards.
The value of quantitative information in achieving corporate goals: Deliveroo focus on
attaining all of its goals and objectives and thus all of them are described below-
Quantitative information on revenue, expenditures, turnovers, competitiveness, and other
factors assist the company in identifying crucial patterns from year to year.
Numbers aid in the measurement of a company's success.
User analytics aid businesses in becoming more informed of their clients' shifting
tendencies.
It aids firms in forecasting upcoming scenarios and responding appropriately depending
on the outcome (Jafari, Malekjamshidi and Zhu, 2019).
P2: Evaluate data from a variety of sources using different methods of analysis
Original source: Companies may immediately acquire the necessary current factual
analysis on their revenue, income, and other aspects of company operations. Whenever the
relevant information does not available in any format, businesses might likewise utilize
methodological approaches to get the information they need for analyzing and choosing on day-
to-day activities. It can discover forces acting which have an effect on the business, such as
goods sold, everyday expenditures, and so on, using raw data.
Supplementary sources: Deliveroo may obtain factual analysis on their operations from a
variety of journal articles. Reference materials could be used to acquire factual analysis
whenever a company needs to analyse societal factors such as shifting consumer numbers,
demographics, and other factors which have an effect on the company.
Deliveroo must recognize and retrieve many types of information on a daily basis. They
must gather and obtain information so that employees could evaluate and comprehend it later.
Two sorts of quantitative information are available to companies.
Qualitative information refers to statistics on an entity's psychological features.
Whenever information is captured and documented in order to determine the presence or
omission of a specific characteristic in distinct quantities, it is said to be qualitative. It
could be on a notional scale. For instance, categorizing workers operating in Deliveroo
in the identical setting as per their degree of abilities, their type of qualification, or
ranking geodatabases.
Quantitative information could be represented as an integer quantity and assessed using
defined dimensions. Numerical analysis is more beneficial for companies than qualitative
information. All of the relevant information could be represented numerically by
Deliveroo. Quantitative analysis is essential by companies in addition to making day-to-
day changes to increase productivity (Makadok, Burton and Barney, 2018).
Whenever it comes to communicating goals and increasing the market share, quantitative
tests have a lot of benefit. Companies are collecting big quantities of information with the goal of
analysing it if they want to improve their financial efficiency. Deliveroo require information to
analyse its specified goals and to identify possibilities that may be used to gain an upper hand.
The sample selection approach is a quantitative approach which any company's inspection team
and manufacturing management could use to determine item and durability classes. Such
analytical tools aid managers in making proper judgments for day-to-day company activities.
Business analytics consequences of logical and empirical analysis refers to the techniques
and technology used by firms to analyse relevant statistics linked to their operations. For the
examination of company information, firms utilise a variety of induction and deduction
methodologies.
Inferential techniques and their implications is a strategy which works from the beginning to
the end, from the specific observations to broader generalizations. They maintain a real-time
standard for the department or company. As professionals take decisions and provide solutions to
⊘ This is a preview!⊘
Do you want full access?
Subscribe today to unlock all pages.
Trusted by 1+ million students worldwide
challenges, managers are guided by their knowledge of the job, business, sector, and relevant
trends.
The implications of empirical assessment as it is a research methodology develops subjects
that eventually wind up as machine learning because of the generalisations or trends which the
researchers monitor. Workers who really can understand reality while analysing problems and
completing projects, and also those who could detect needs and trends procedures, methods, or
suggestions depending on such proclivities, are valued by employers (Wen-Si and Jia-Long,
2019).
TASK 2
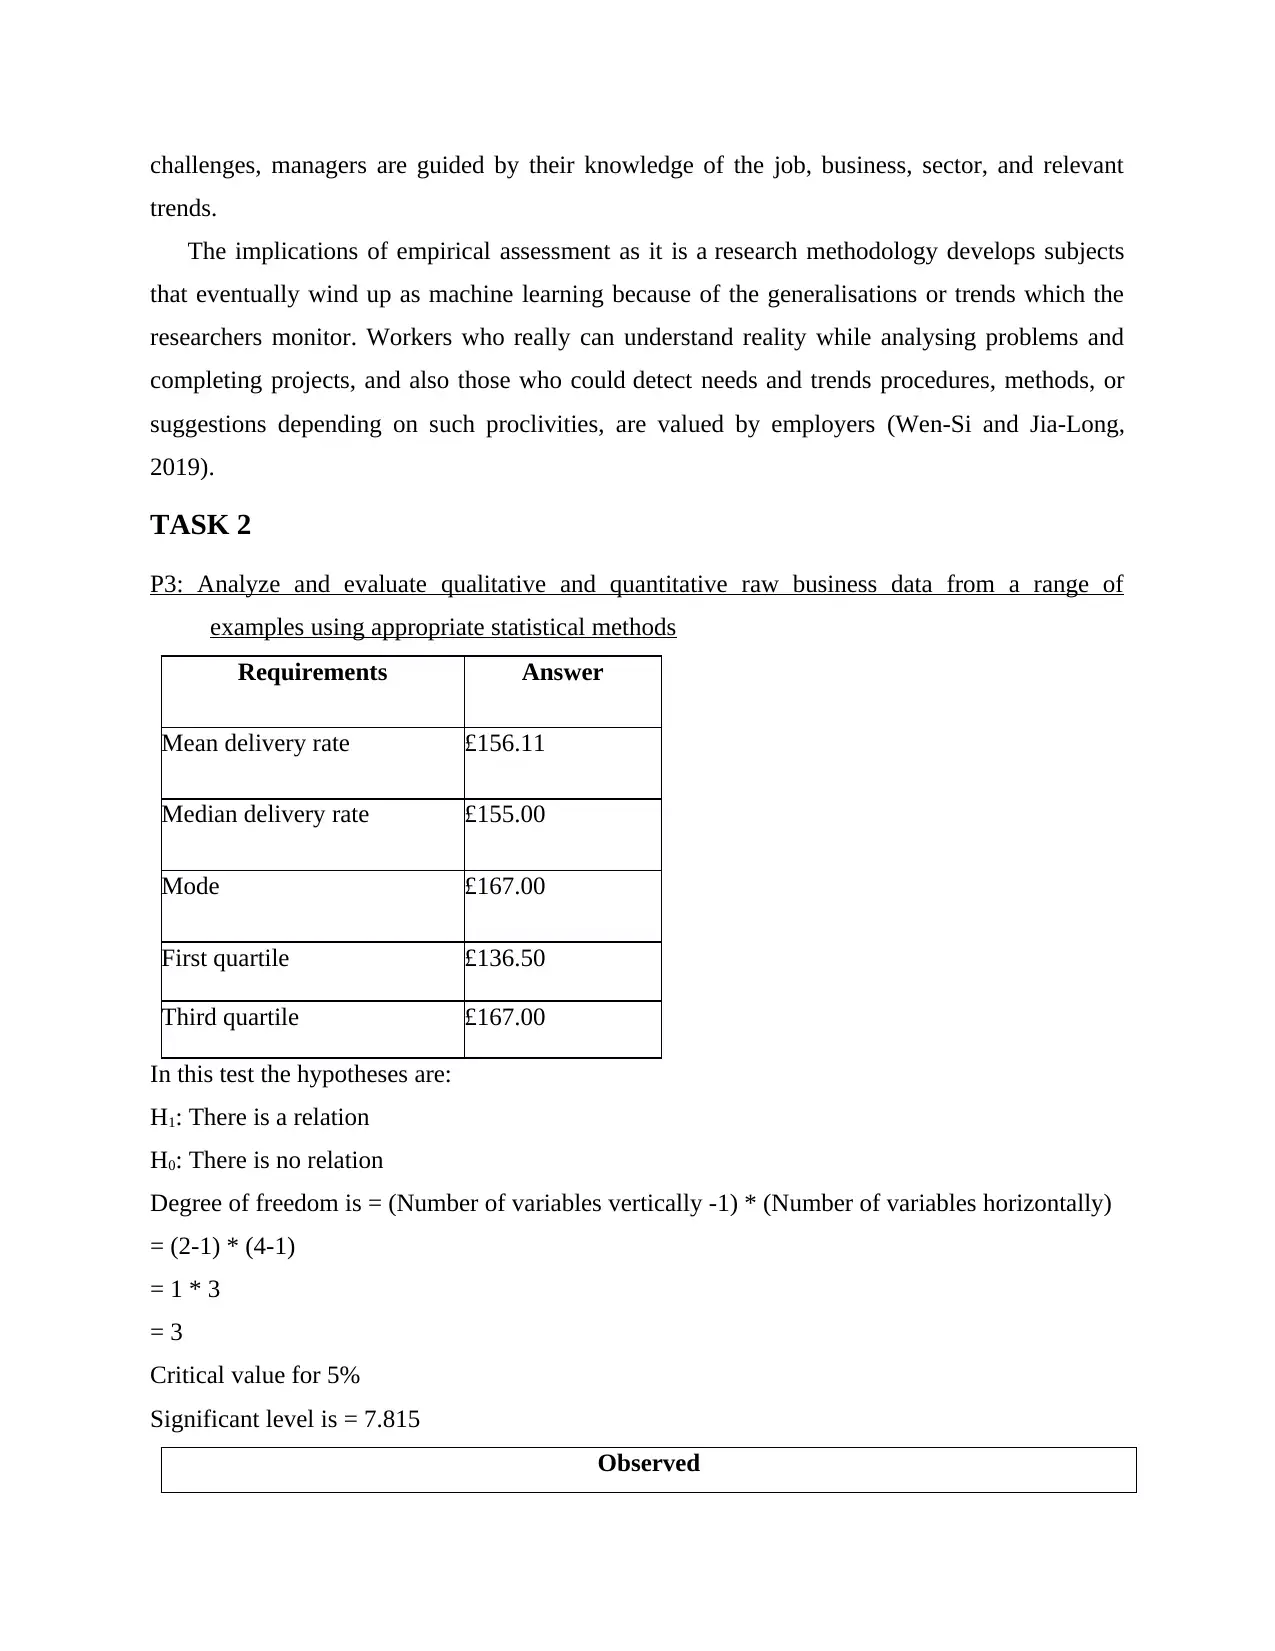
P3: Analyze and evaluate qualitative and quantitative raw business data from a range of
examples using appropriate statistical methods
Requirements Answer
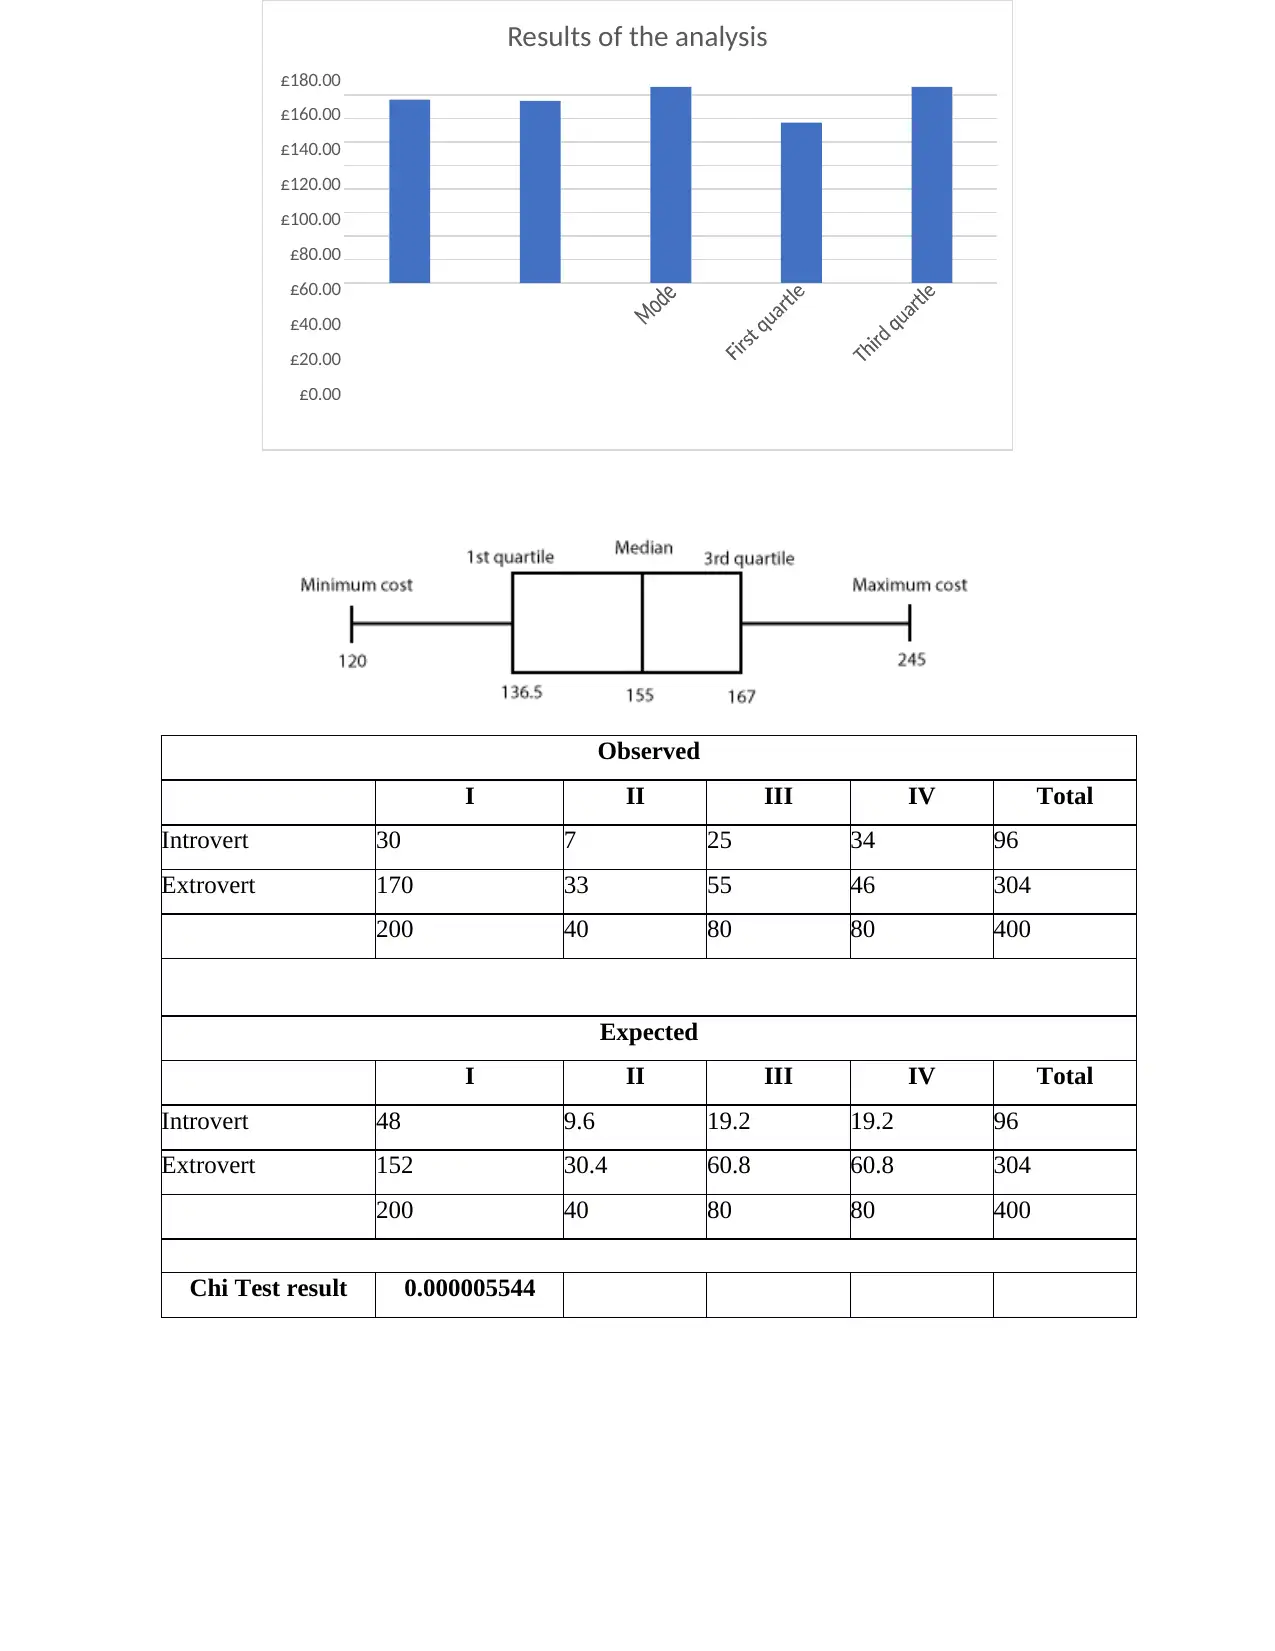
Mean delivery rate £156.11
Median delivery rate £155.00
Mode £167.00
First quartile £136.50
Third quartile £167.00
In this test the hypotheses are:
H1: There is a relation
H0: There is no relation
Degree of freedom is = (Number of variables vertically -1) * (Number of variables horizontally)
= (2-1) * (4-1)
= 1 * 3
= 3
Critical value for 5%
Significant level is = 7.815
Observed
trends.
The implications of empirical assessment as it is a research methodology develops subjects
that eventually wind up as machine learning because of the generalisations or trends which the
researchers monitor. Workers who really can understand reality while analysing problems and
completing projects, and also those who could detect needs and trends procedures, methods, or
suggestions depending on such proclivities, are valued by employers (Wen-Si and Jia-Long,
2019).
TASK 2
P3: Analyze and evaluate qualitative and quantitative raw business data from a range of
examples using appropriate statistical methods
Requirements Answer
Mean delivery rate £156.11
Median delivery rate £155.00
Mode £167.00
First quartile £136.50
Third quartile £167.00
In this test the hypotheses are:
H1: There is a relation
H0: There is no relation
Degree of freedom is = (Number of variables vertically -1) * (Number of variables horizontally)
= (2-1) * (4-1)
= 1 * 3
= 3
Critical value for 5%
Significant level is = 7.815
Observed
Paraphrase This Document
Need a fresh take? Get an instant paraphrase of this document with our AI Paraphraser
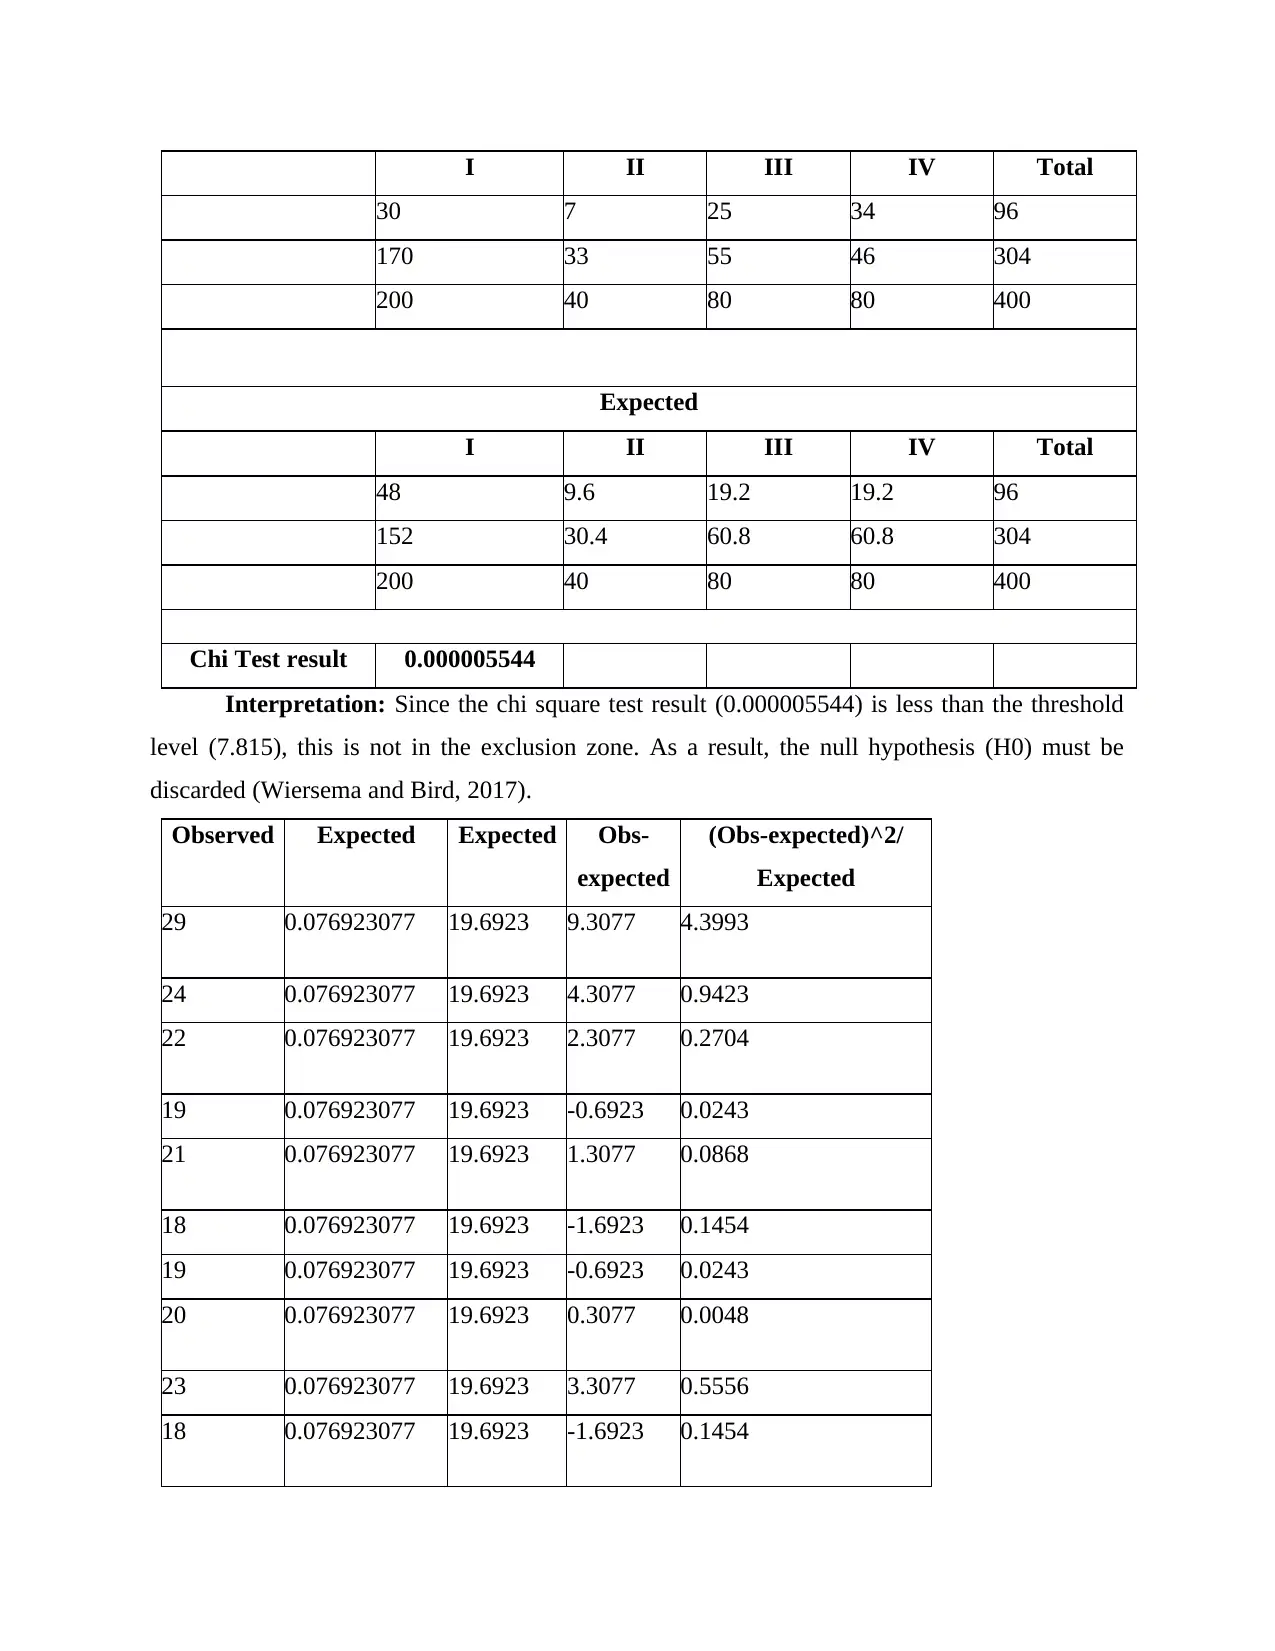
I II III IV Total
30 7 25 34 96
170 33 55 46 304
200 40 80 80 400
Expected
I II III IV Total
48 9.6 19.2 19.2 96
152 30.4 60.8 60.8 304
200 40 80 80 400
Chi Test result 0.000005544
Interpretation: Since the chi square test result (0.000005544) is less than the threshold
level (7.815), this is not in the exclusion zone. As a result, the null hypothesis (H0) must be
discarded (Wiersema and Bird, 2017).
Observed Expected Expected Obs-
expected
(Obs-expected)^2/
Expected
29 0.076923077 19.6923 9.3077 4.3993
24 0.076923077 19.6923 4.3077 0.9423
22 0.076923077 19.6923 2.3077 0.2704
19 0.076923077 19.6923 -0.6923 0.0243
21 0.076923077 19.6923 1.3077 0.0868
18 0.076923077 19.6923 -1.6923 0.1454
19 0.076923077 19.6923 -0.6923 0.0243
20 0.076923077 19.6923 0.3077 0.0048
23 0.076923077 19.6923 3.3077 0.5556
18 0.076923077 19.6923 -1.6923 0.1454
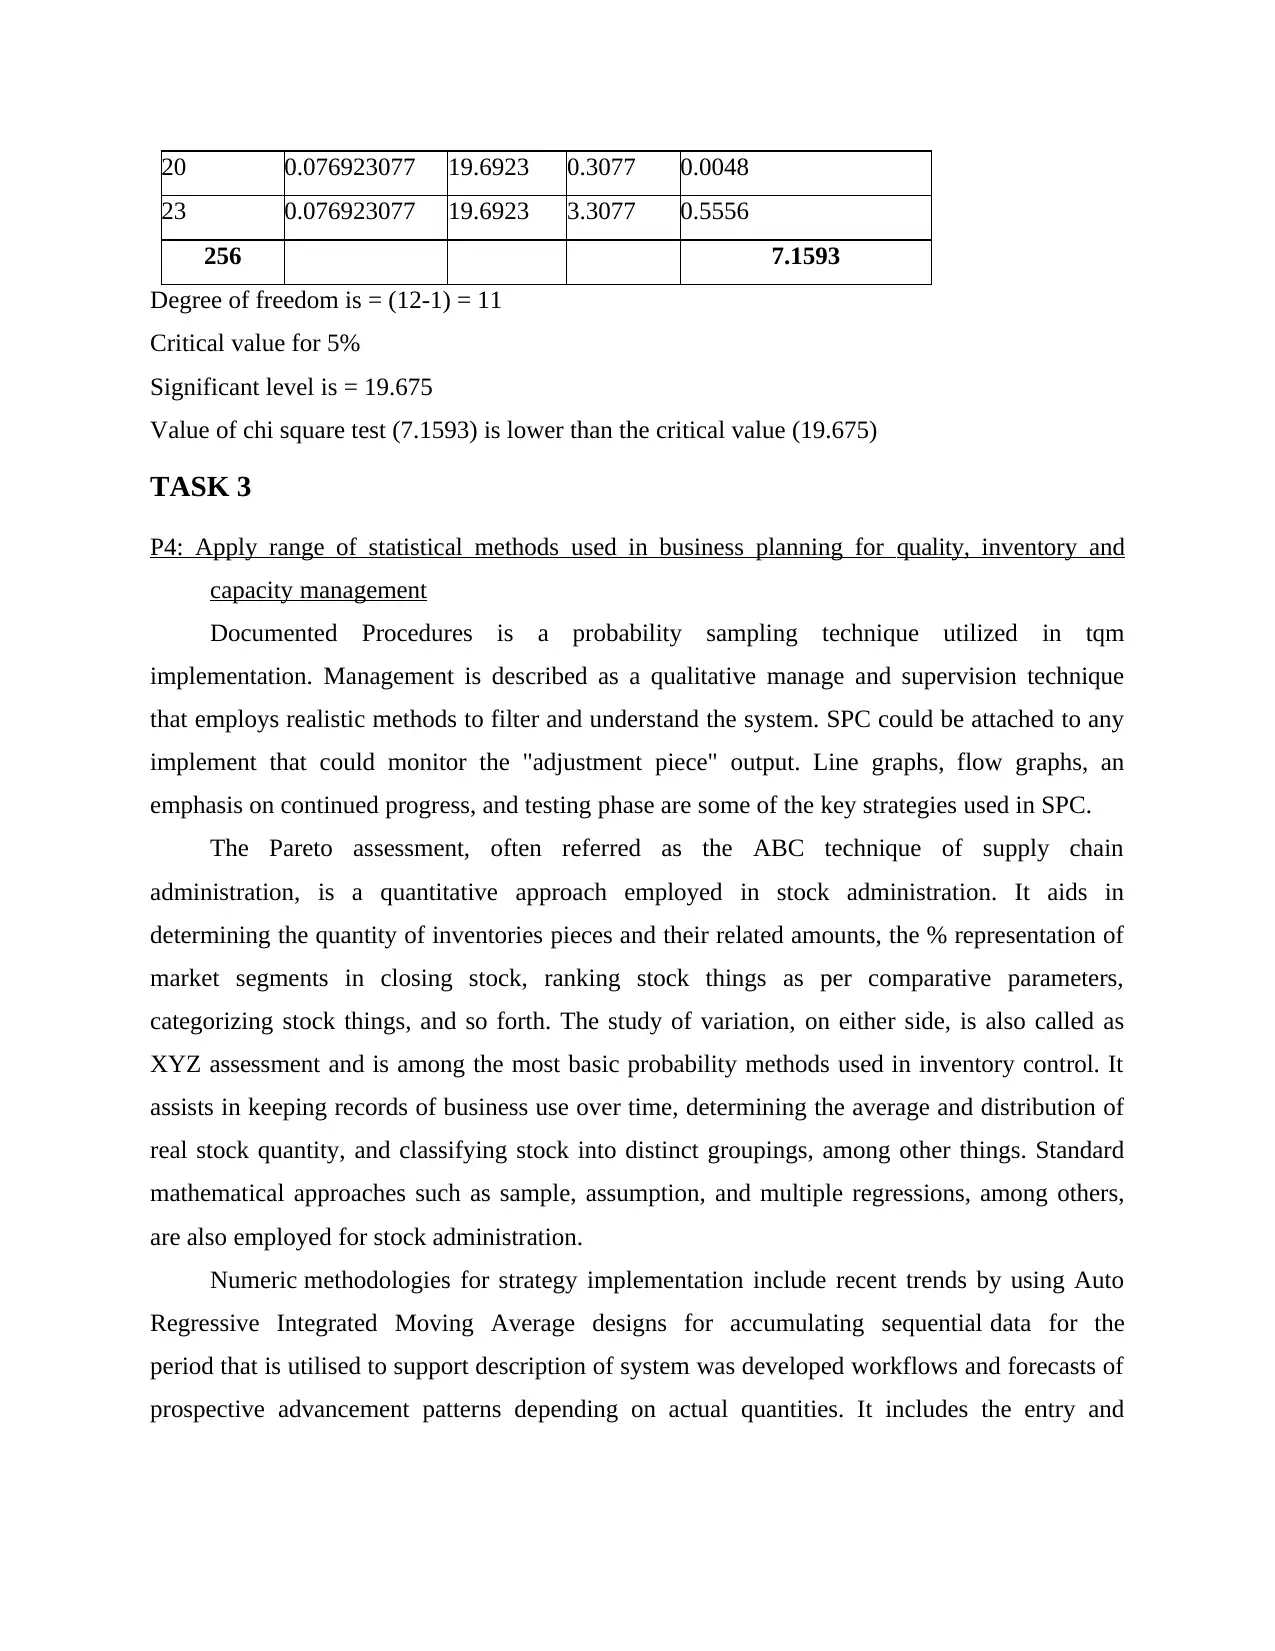
20 0.076923077 19.6923 0.3077 0.0048
23 0.076923077 19.6923 3.3077 0.5556
256 7.1593
Degree of freedom is = (12-1) = 11
Critical value for 5%
Significant level is = 19.675
Value of chi square test (7.1593) is lower than the critical value (19.675)
TASK 3
P4: Apply range of statistical methods used in business planning for quality, inventory and
capacity management
Documented Procedures is a probability sampling technique utilized in tqm
implementation. Management is described as a qualitative manage and supervision technique
that employs realistic methods to filter and understand the system. SPC could be attached to any
implement that could monitor the "adjustment piece" output. Line graphs, flow graphs, an
emphasis on continued progress, and testing phase are some of the key strategies used in SPC.
The Pareto assessment, often referred as the ABC technique of supply chain
administration, is a quantitative approach employed in stock administration. It aids in
determining the quantity of inventories pieces and their related amounts, the % representation of
market segments in closing stock, ranking stock things as per comparative parameters,
categorizing stock things, and so forth. The study of variation, on either side, is also called as
XYZ assessment and is among the most basic probability methods used in inventory control. It
assists in keeping records of business use over time, determining the average and distribution of
real stock quantity, and classifying stock into distinct groupings, among other things. Standard
mathematical approaches such as sample, assumption, and multiple regressions, among others,
are also employed for stock administration.
Numeric methodologies for strategy implementation include recent trends by using Auto
Regressive Integrated Moving Average designs for accumulating sequential data for the
period that is utilised to support description of system was developed workflows and forecasts of
prospective advancement patterns depending on actual quantities. It includes the entry and
⊘ This is a preview!⊘
Do you want full access?
Subscribe today to unlock all pages.
Trusted by 1+ million students worldwide
warehousing of basic resources for works in production and completed products, as well as a
system of mechanisms for connecting with customers.
Diversity in resource chain administration is measured by factors such as rapid shift in
customer habits and preference patterns, modifications in goods offerings investment planning,
variance in factories, shipping, and allocation lead times, modifications in allocation network
equipment needed, and imbalances in output, allocation, and brand and provider prerequisites,
among others. The following are some examples of variance metrics which could be utilised:
Variability and mean variation: It could be utilized to calculate the effect posed by the
distribution network pathways' current and desired standards of achievement. The
discrepancies could be identified using total cost variation, labour effectiveness
variability, time delivery variability, and so on.
Range: It aids in determining how significantly real products manufacturing, storage and
transportation, delivery schedules, and other factors deviate from what is anticipated
depending on previous information.
Probabilistic measurements in supplier network administration- Different estimated
values could be utilised in supplier network administration operations.
Binomial- This dispersion of it, which means it may be implemented to create a yes or no
choice. The logistics management, for instance, could use this dispersion to determine if a
firm's vendor is readily available or otherwise.
Poisson: This dispersion could be utilized in supplier network administration to figure
out how many products are held every day or how many of those are delivered to
customers in a certain time frame (Zhang, Jiang and Wang, 2018).
TASK 4
P5: Using appropriate charts/tables communicate findings for a number of given variables
Paraphrase This Document
Need a fresh take? Get an instant paraphrase of this document with our AI Paraphraser
Results of the analysis
£180.00
£160.00
£140.00
£120.00
£100.00
£80.00
£60.00
£40.00
£20.00
£0.00
Observed
I II III IV Total
Introvert 30 7 25 34 96
Extrovert 170 33 55 46 304
200 40 80 80 400
Expected
I II III IV Total
Introvert 48 9.6 19.2 19.2 96
Extrovert 152 30.4 60.8 60.8 304
200 40 80 80 400
Chi Test result 0.000005544
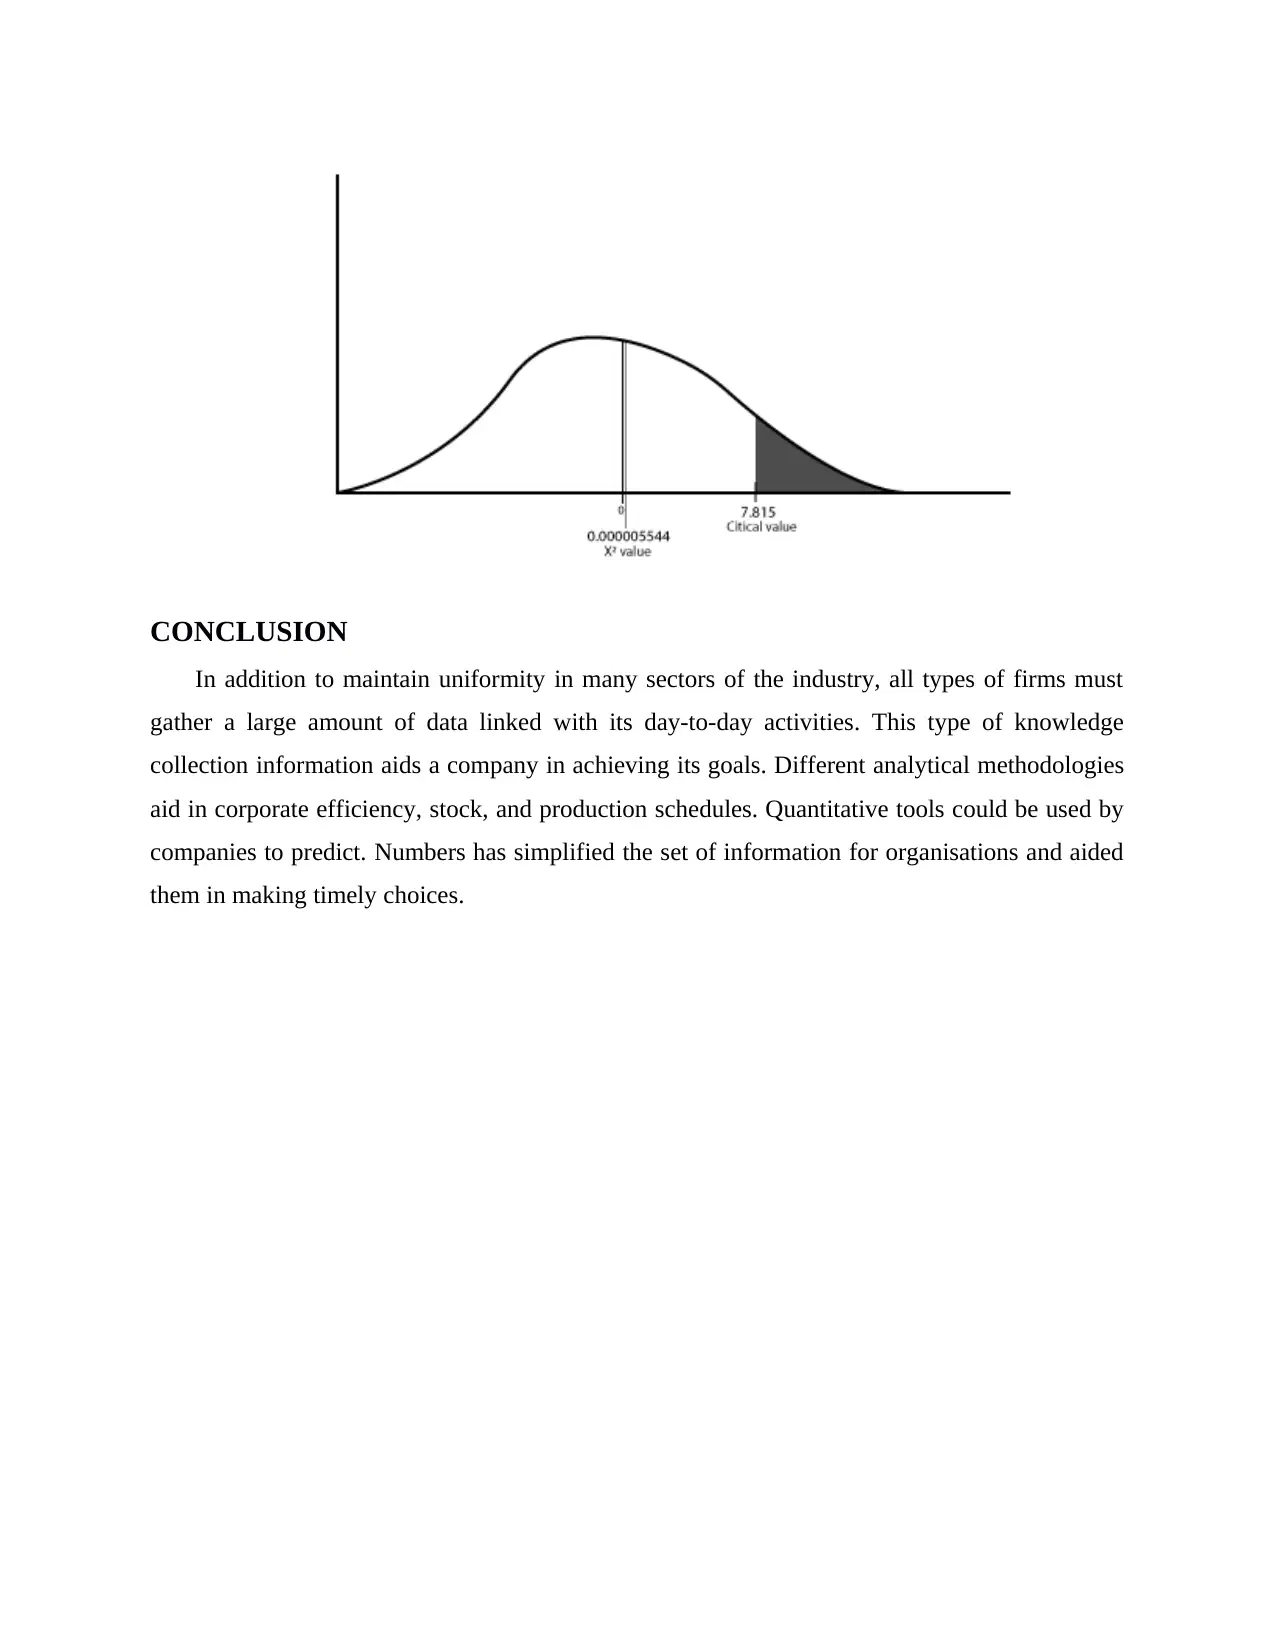
CONCLUSION
In addition to maintain uniformity in many sectors of the industry, all types of firms must
gather a large amount of data linked with its day-to-day activities. This type of knowledge
collection information aids a company in achieving its goals. Different analytical methodologies
aid in corporate efficiency, stock, and production schedules. Quantitative tools could be used by
companies to predict. Numbers has simplified the set of information for organisations and aided
them in making timely choices.
⊘ This is a preview!⊘
Do you want full access?
Subscribe today to unlock all pages.
Trusted by 1+ million students worldwide
1 out of 13
Related Documents


Your All-in-One AI-Powered Toolkit for Academic Success.
+13062052269
info@desklib.com
Available 24*7 on WhatsApp / Email
![[object Object]](/_next/static/media/star-bottom.7253800d.svg)
Unlock your academic potential
Copyright © 2020–2026 A2Z Services. All Rights Reserved. Developed and managed by ZUCOL.