Statistics for Management: Data Analysis, Methods, and Applications
VerifiedAdded on 2023/01/18
|16
|1152
|62
Homework Assignment
AI Summary
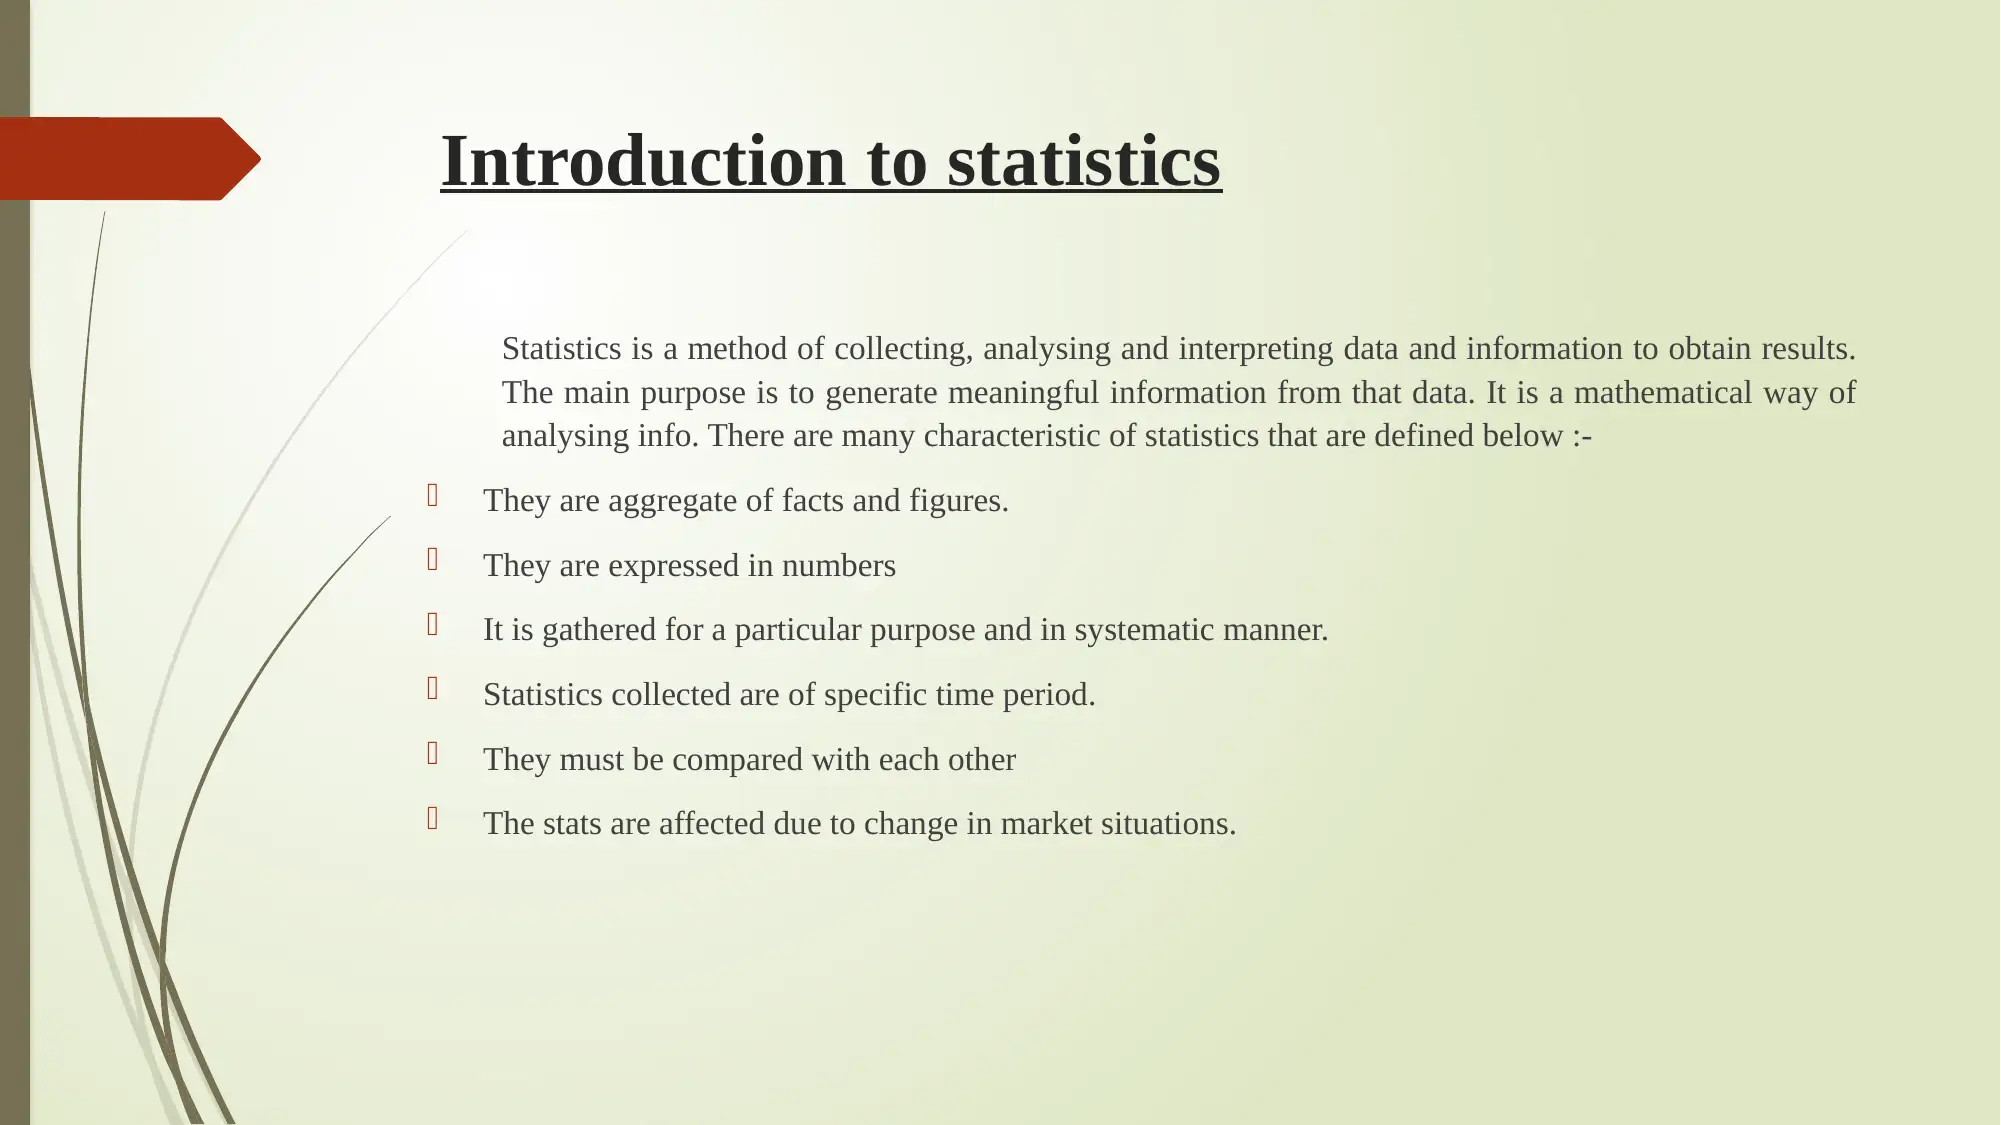
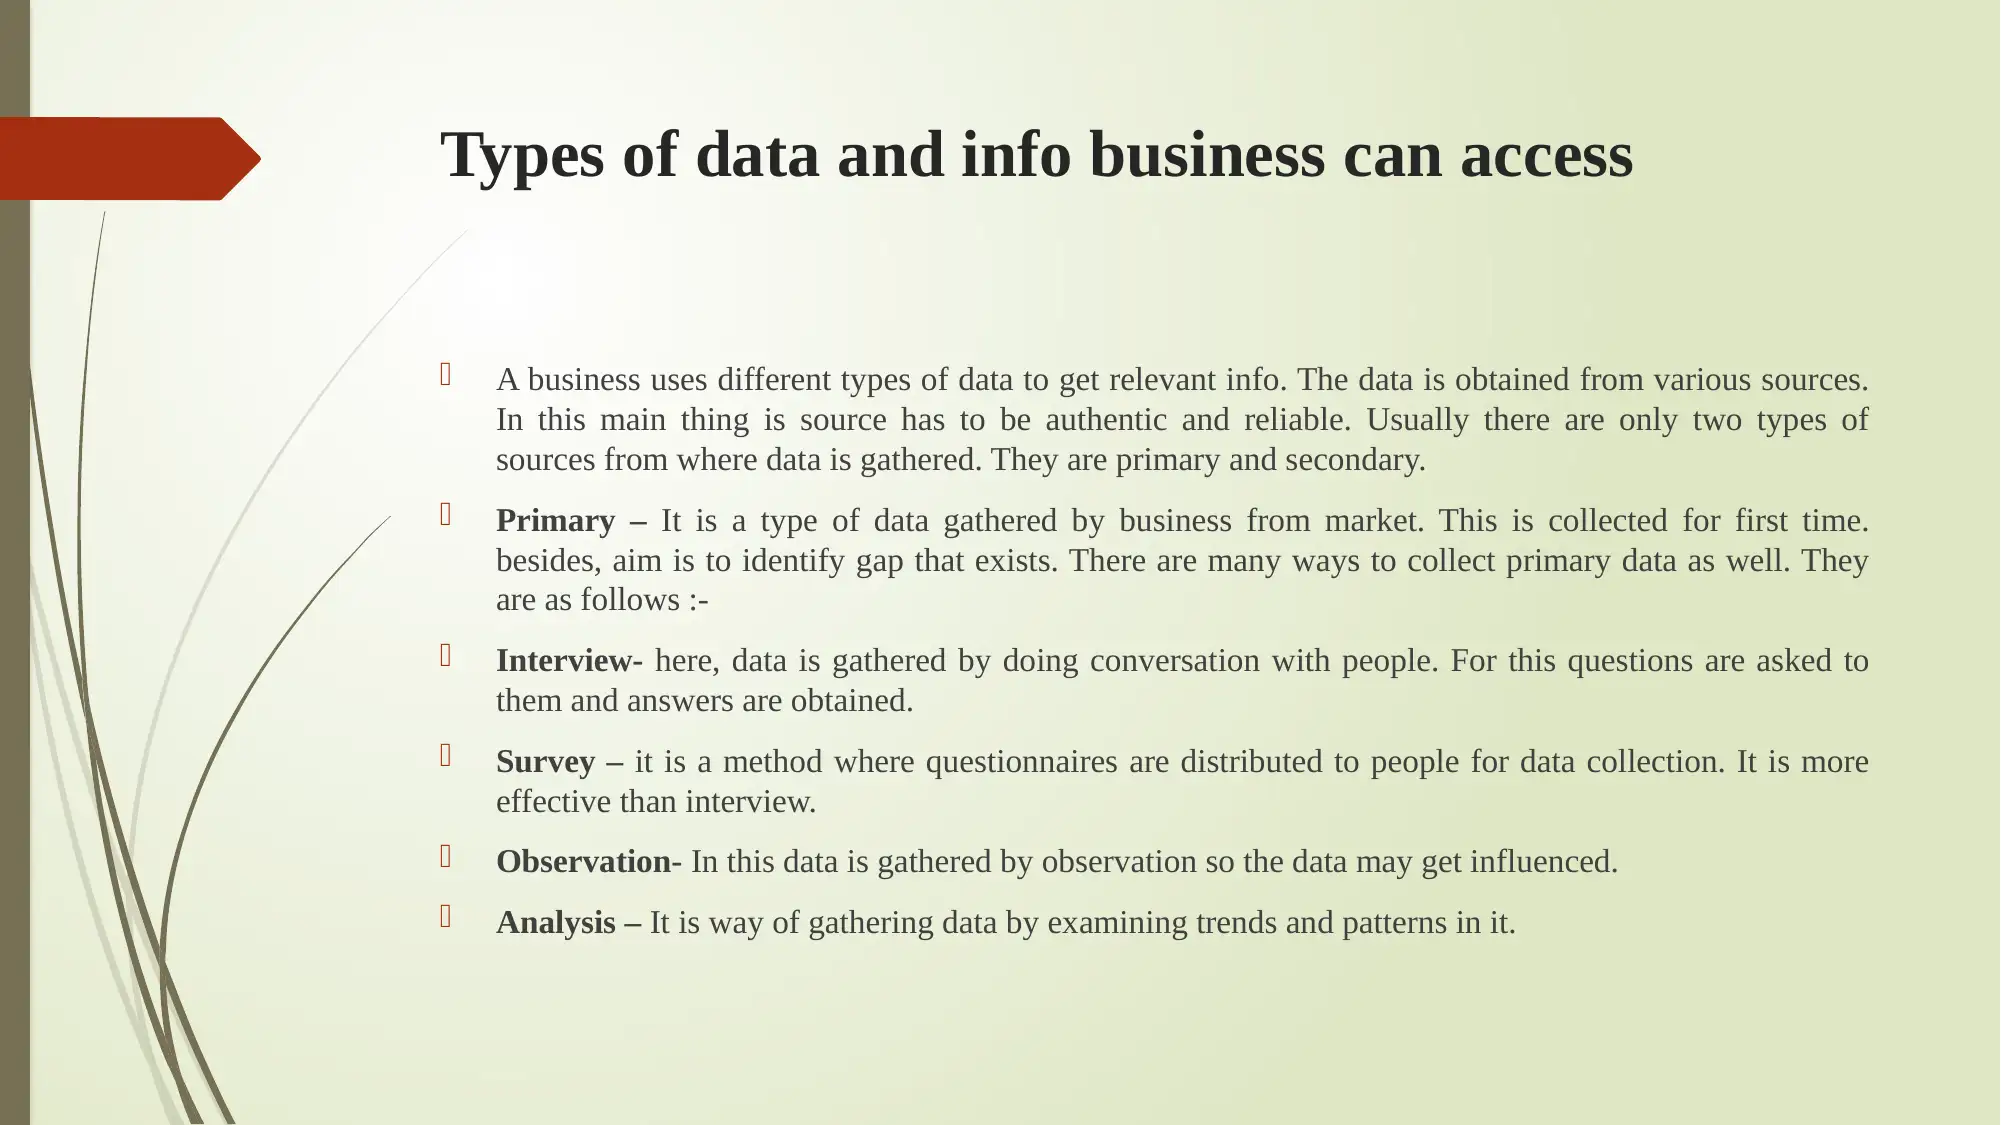
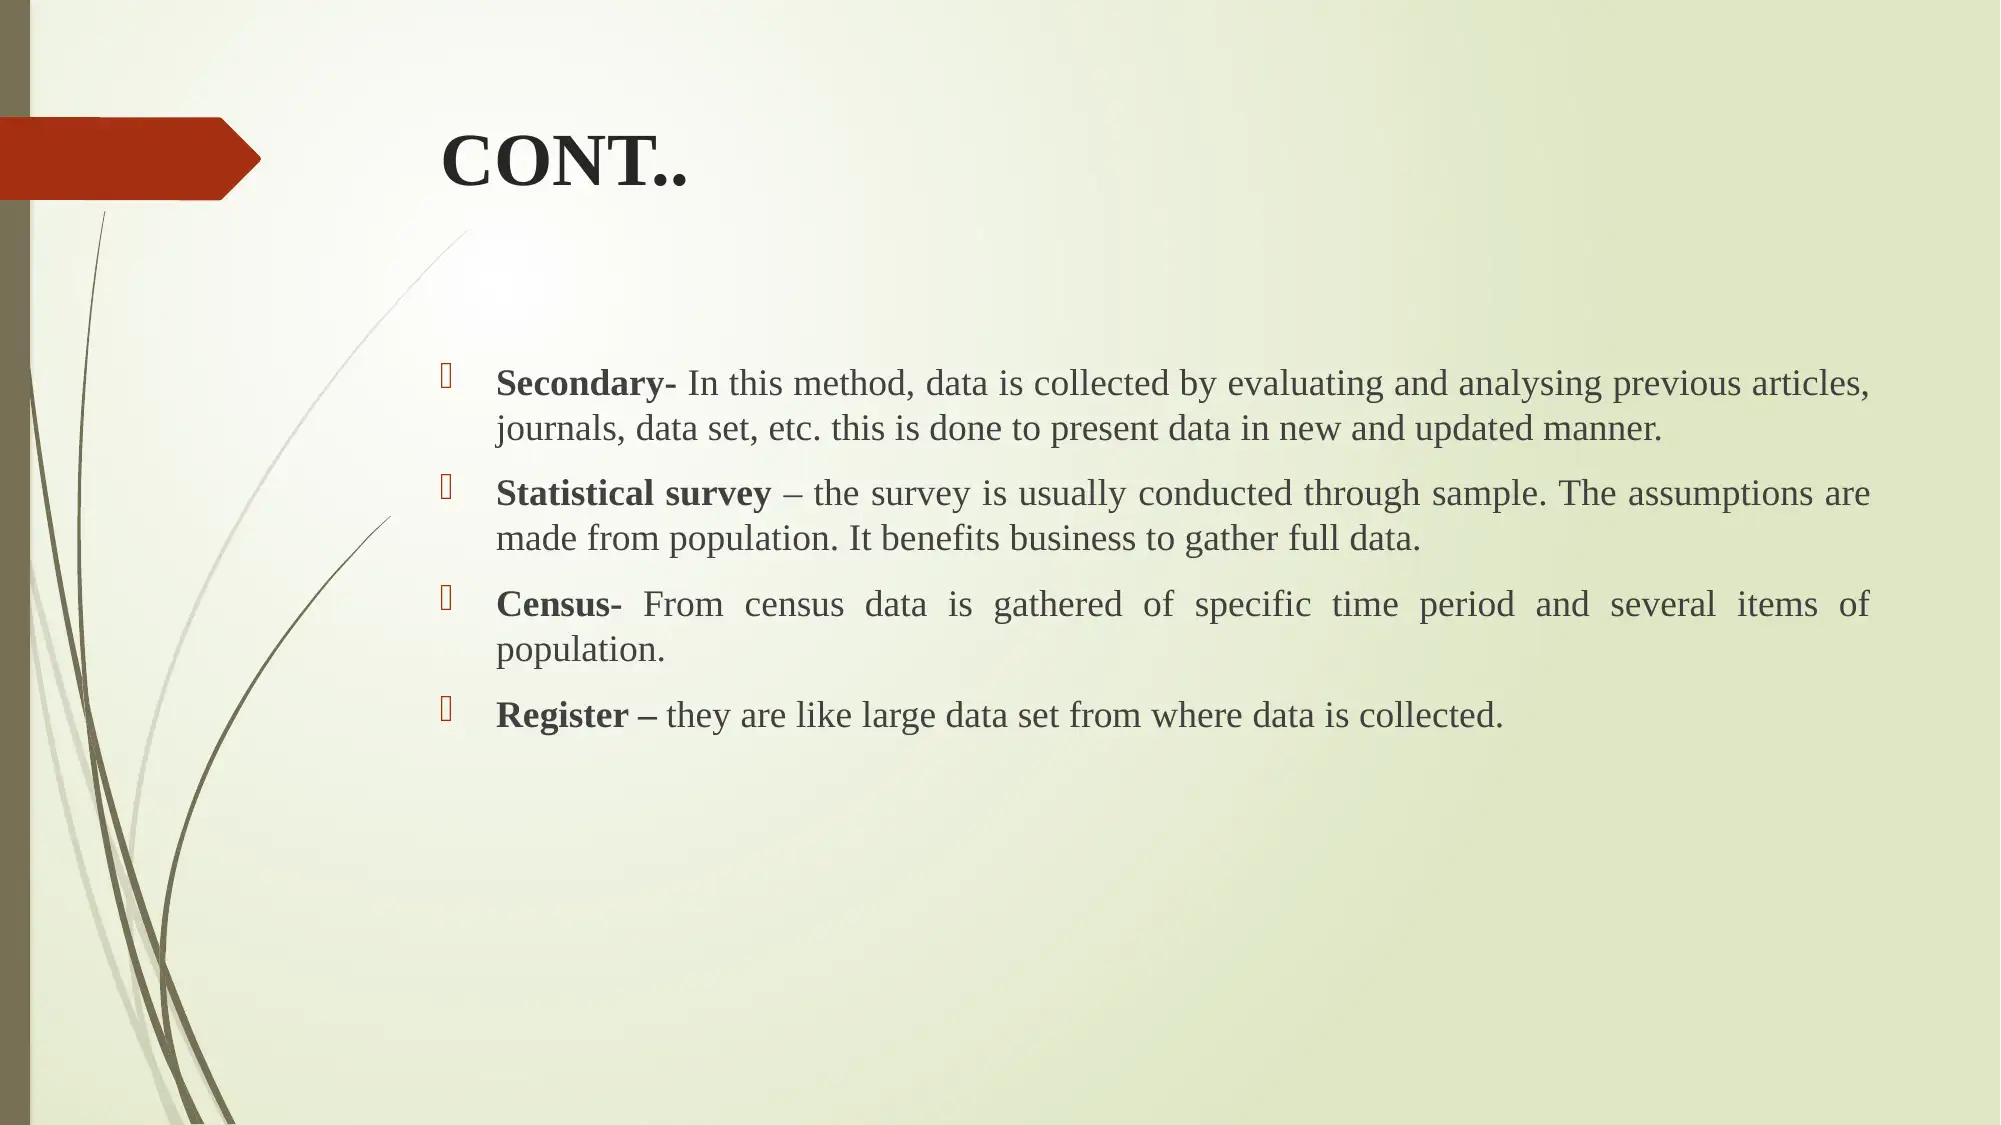
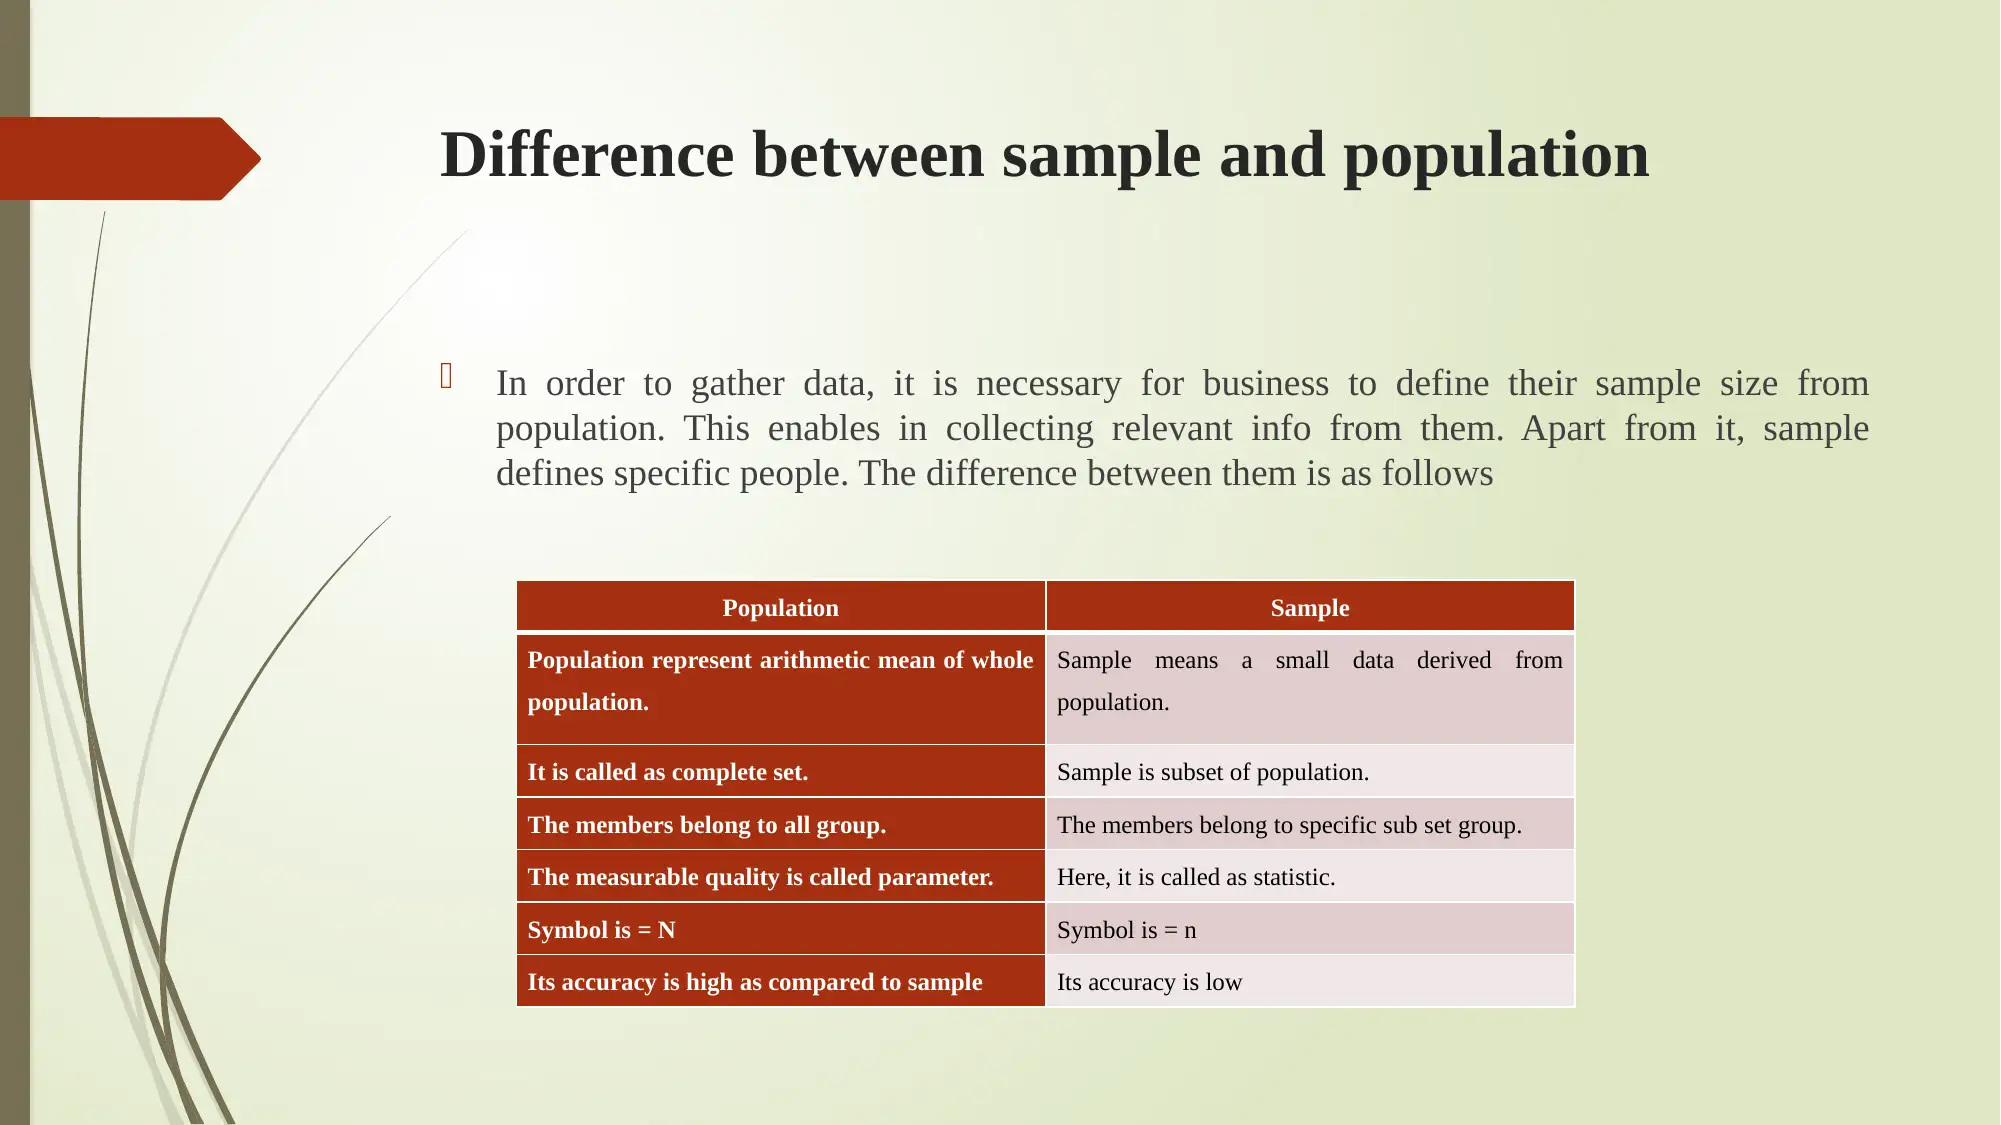
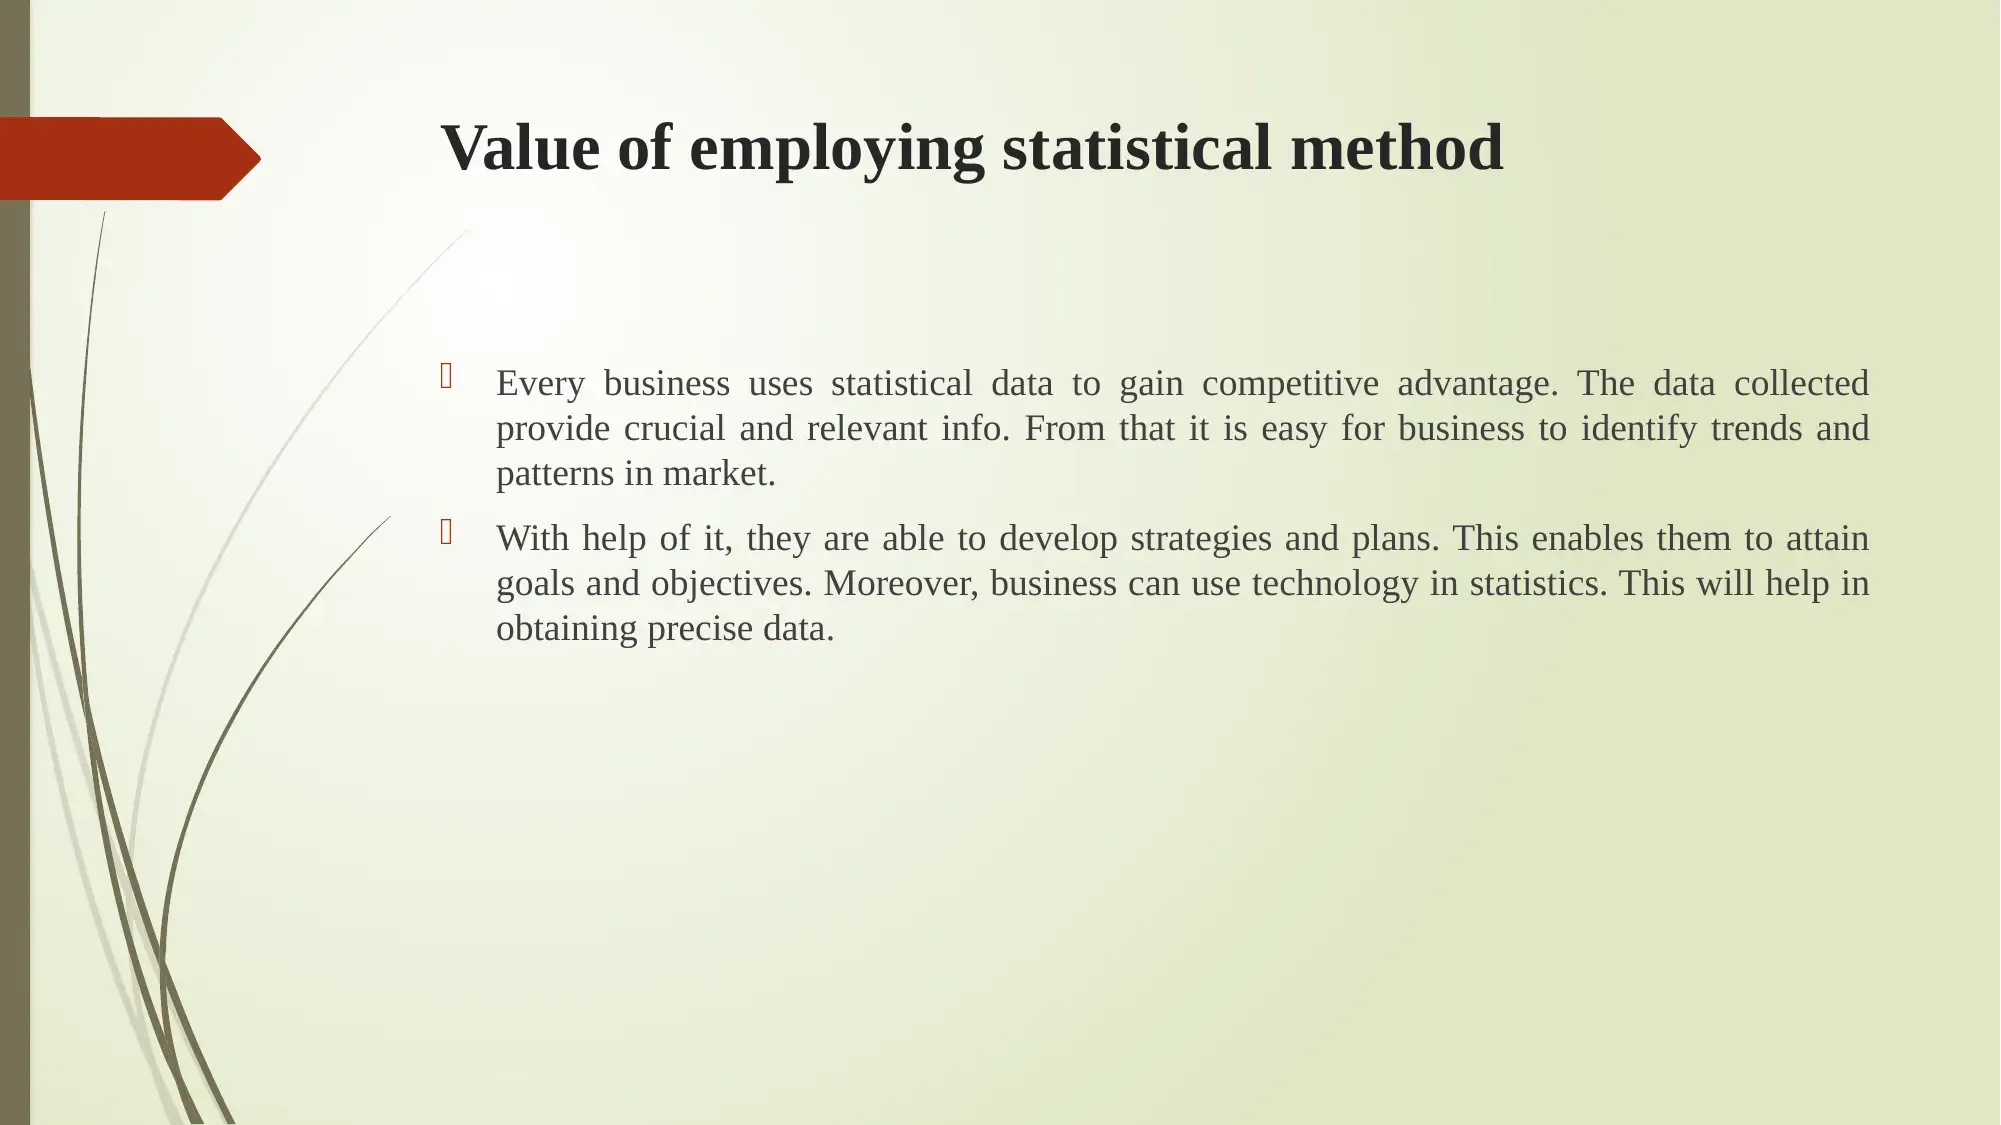
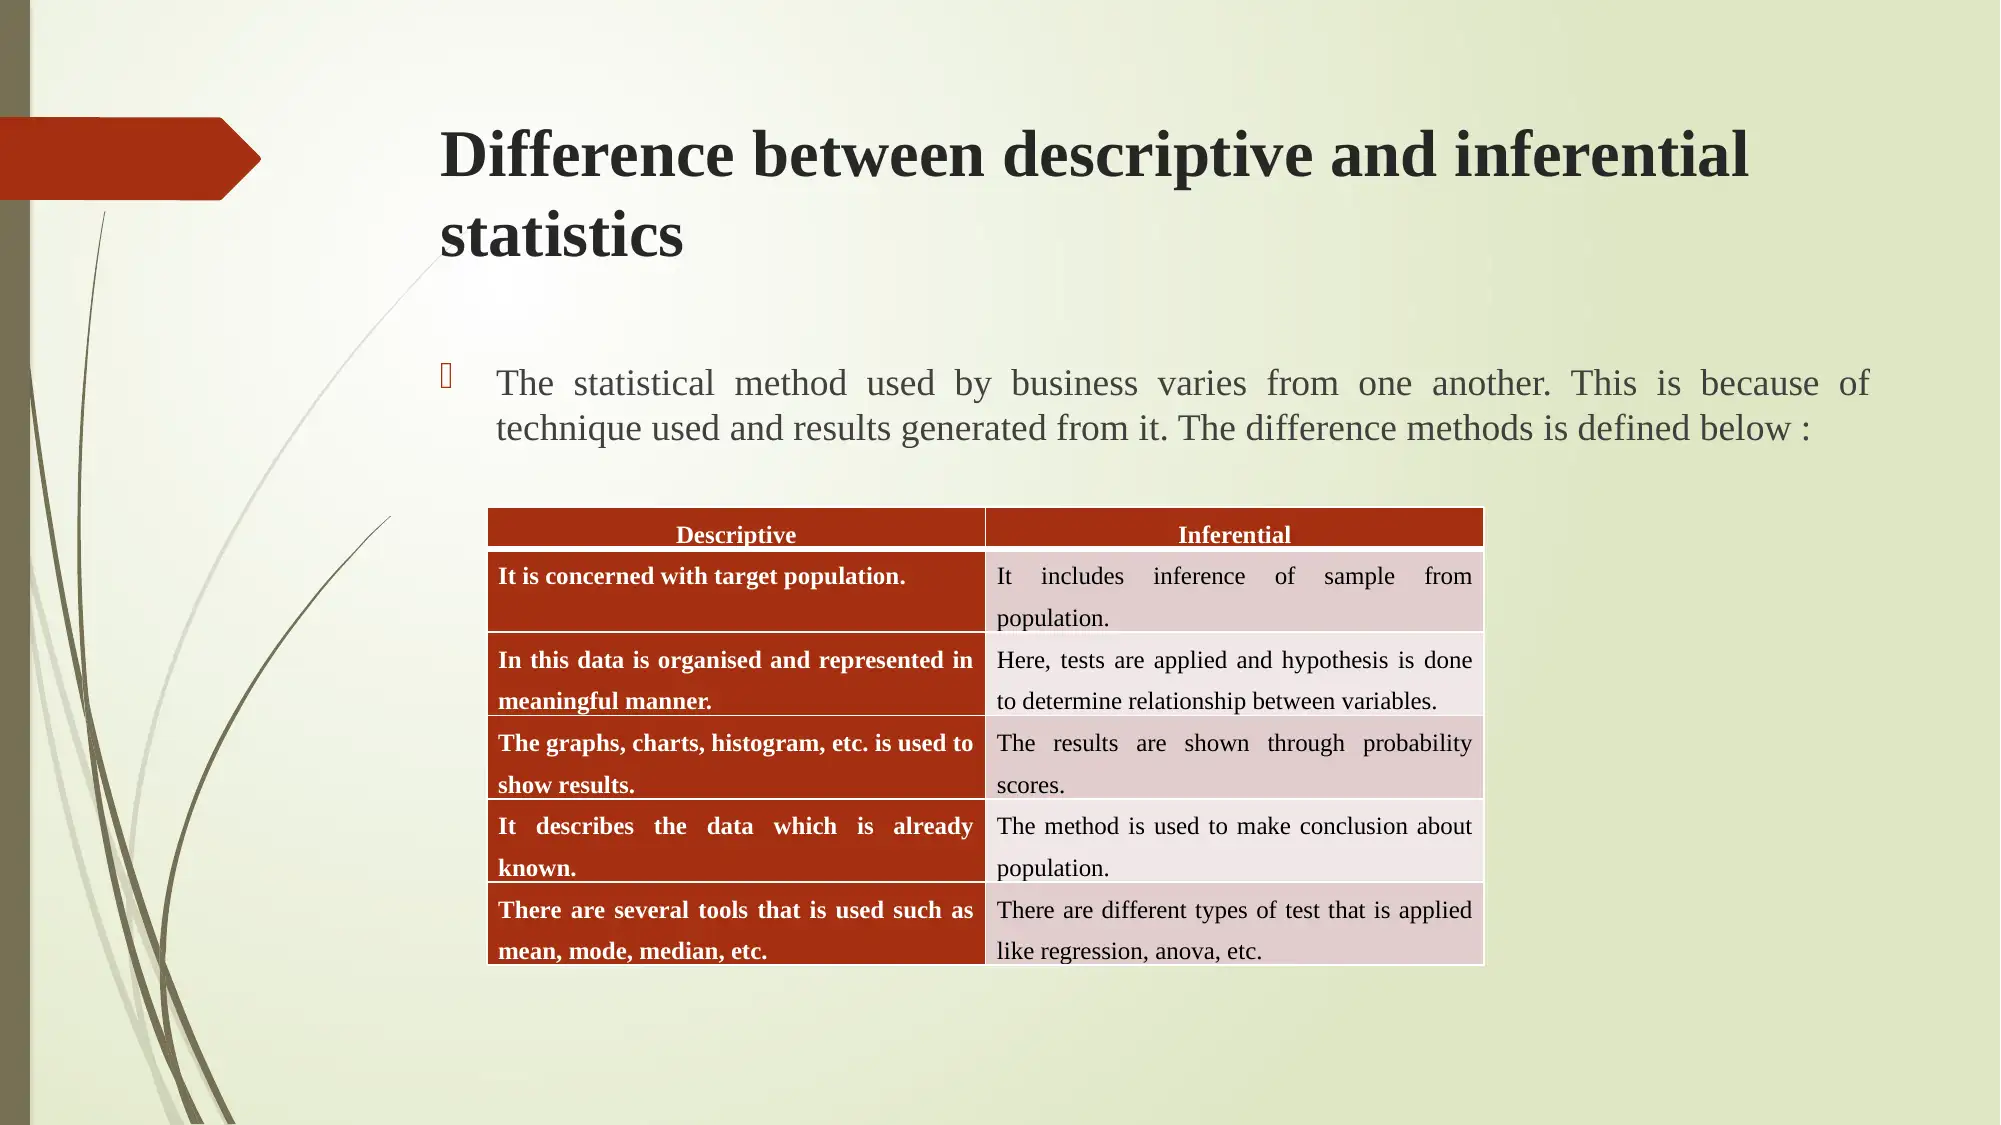
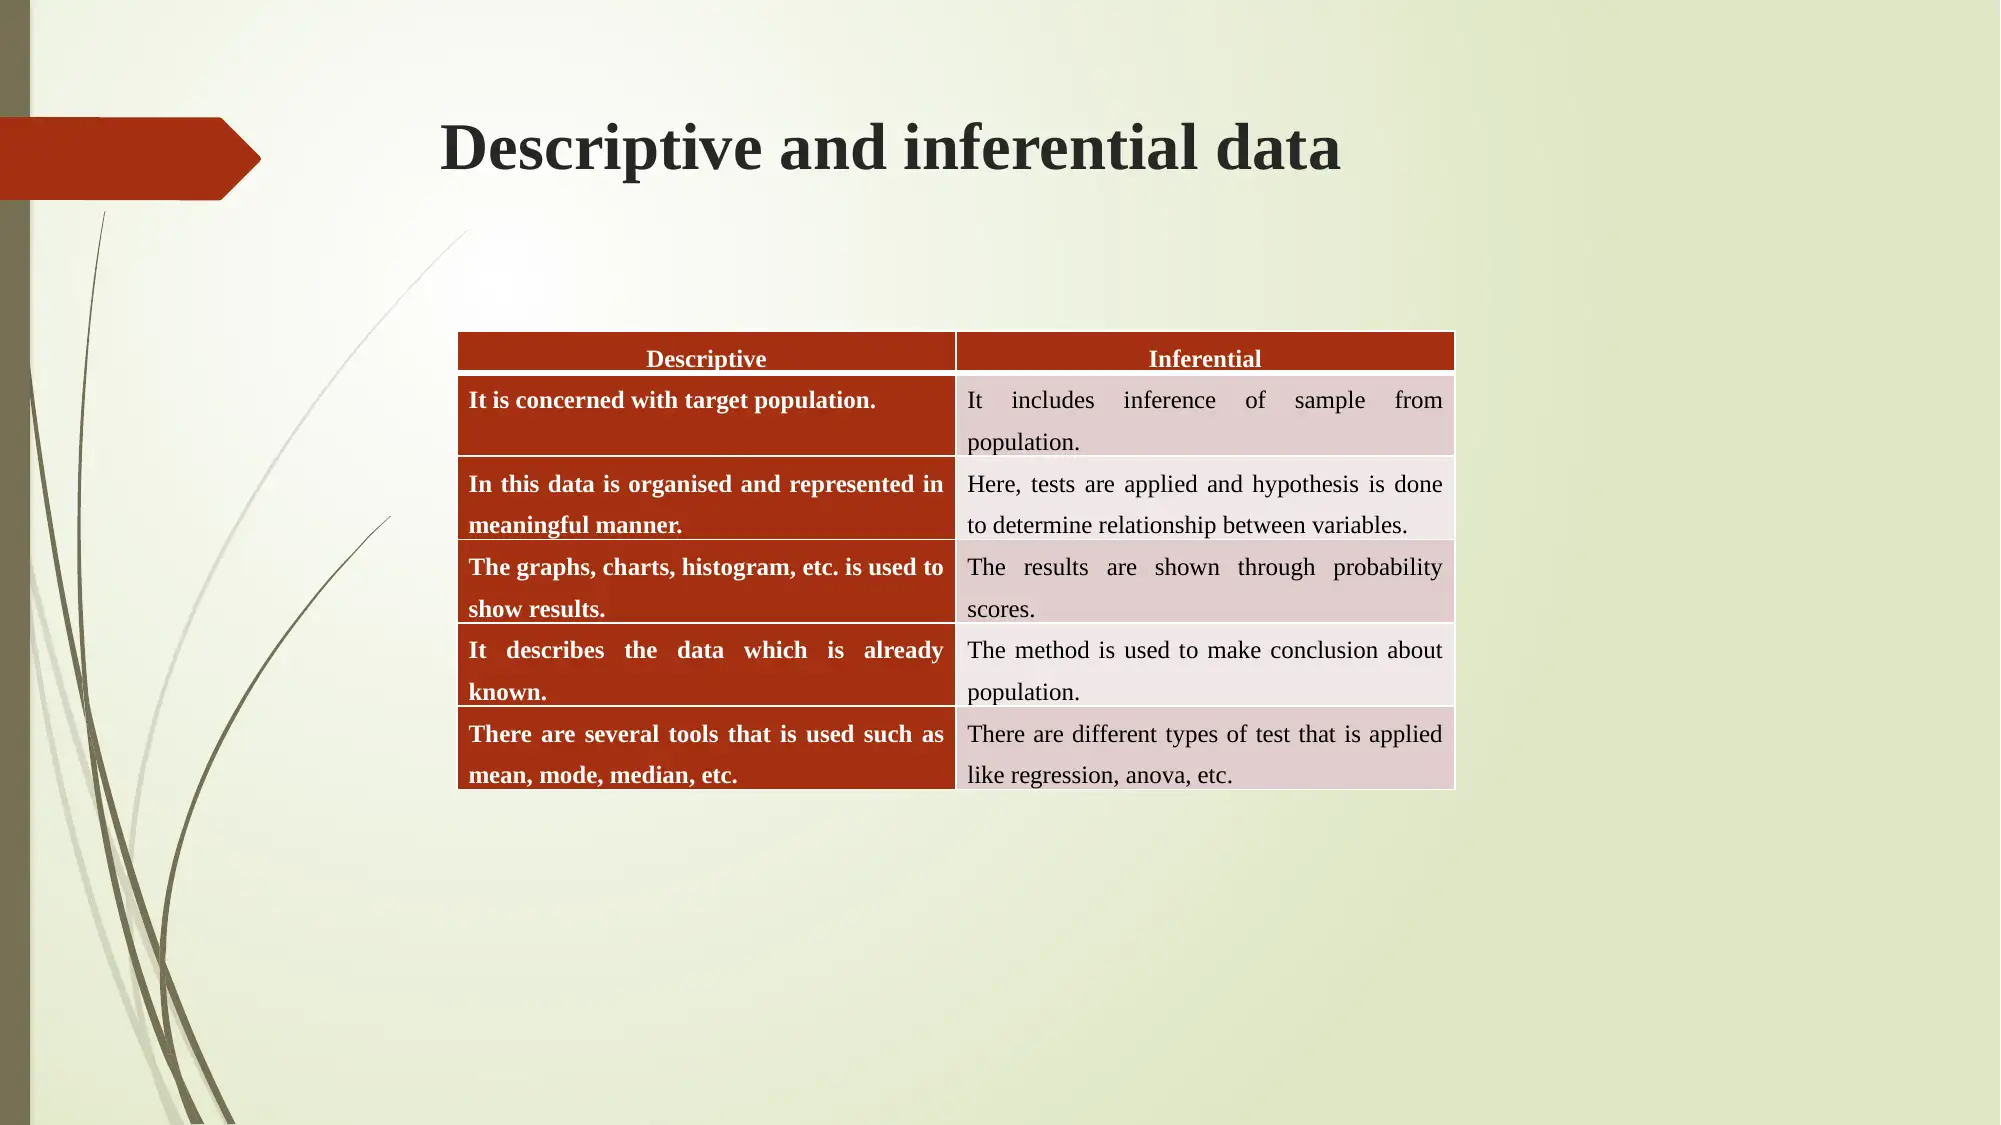
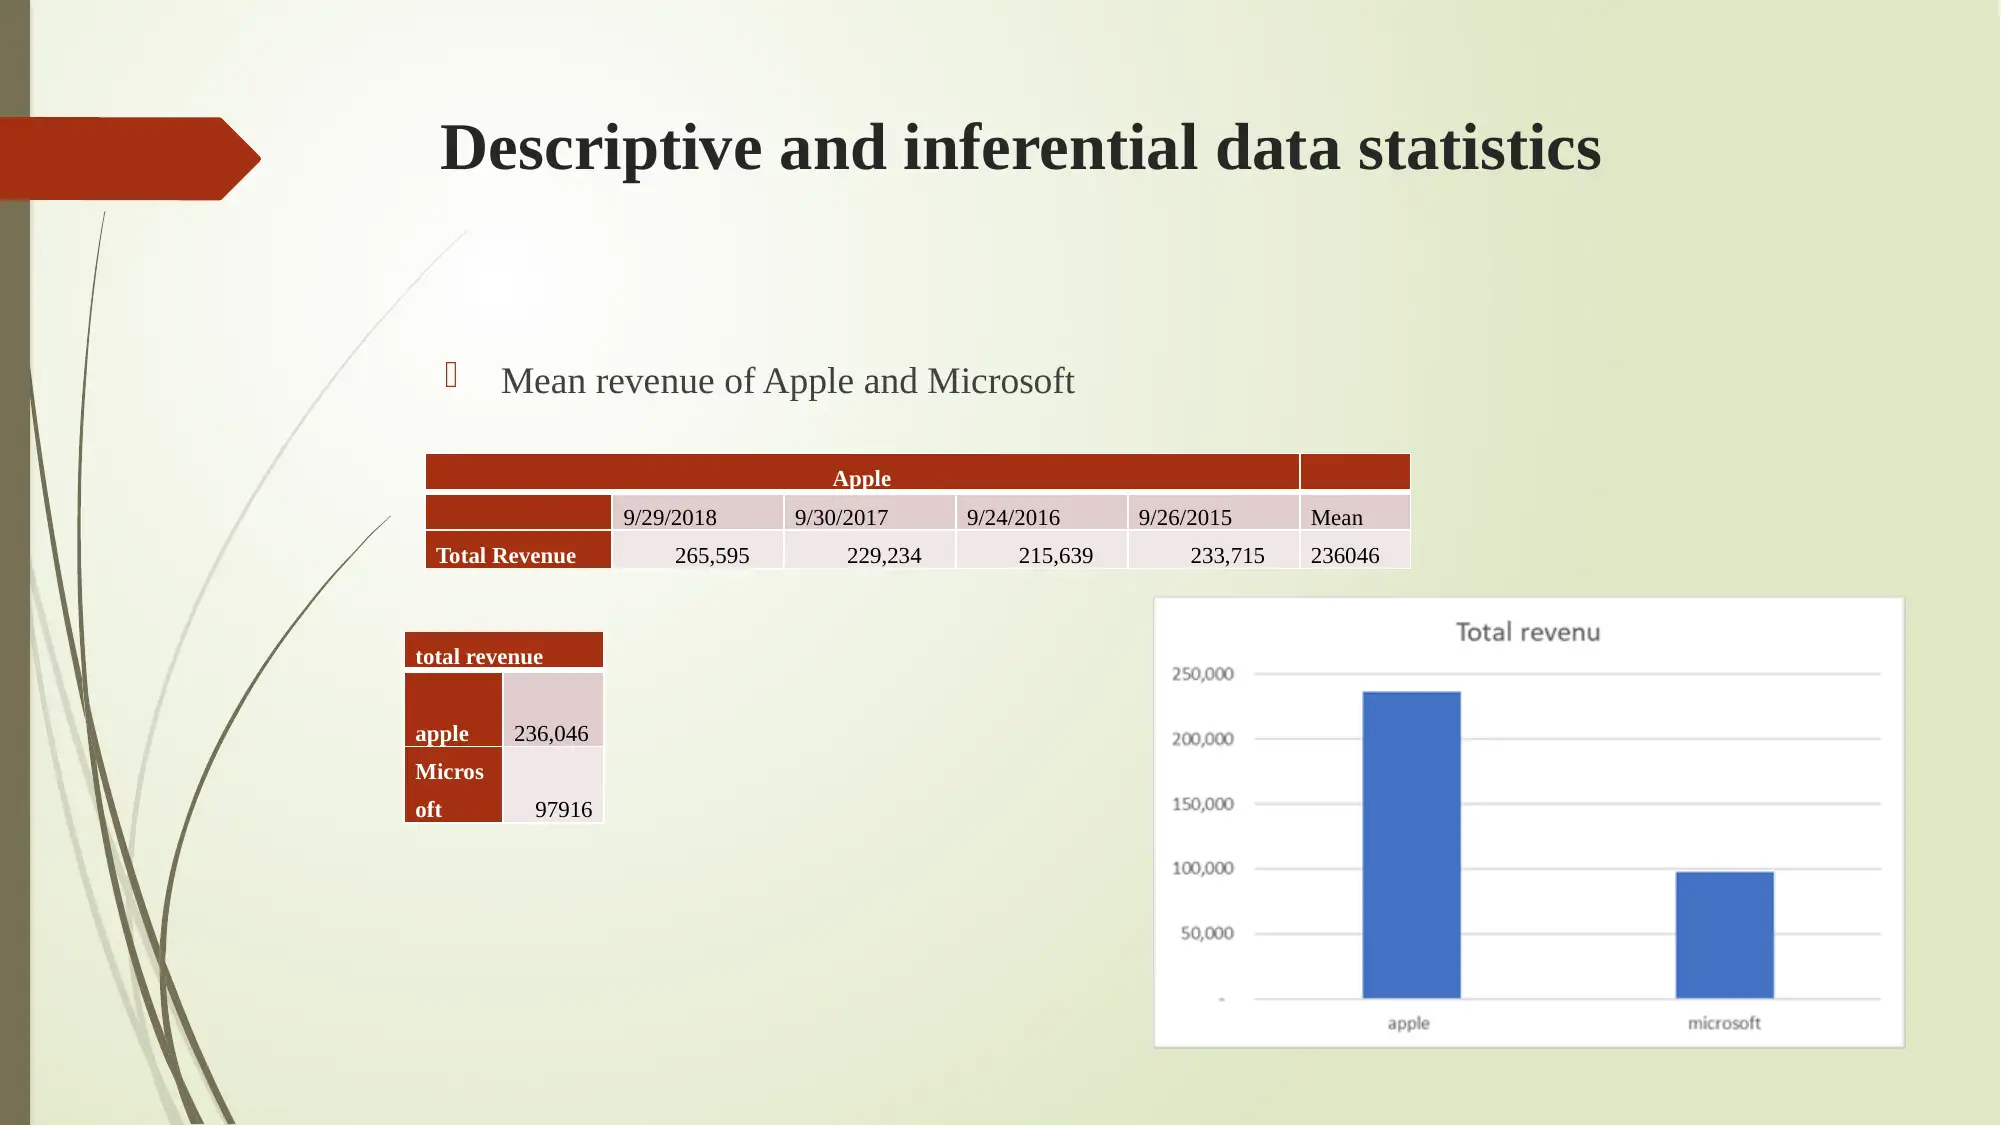
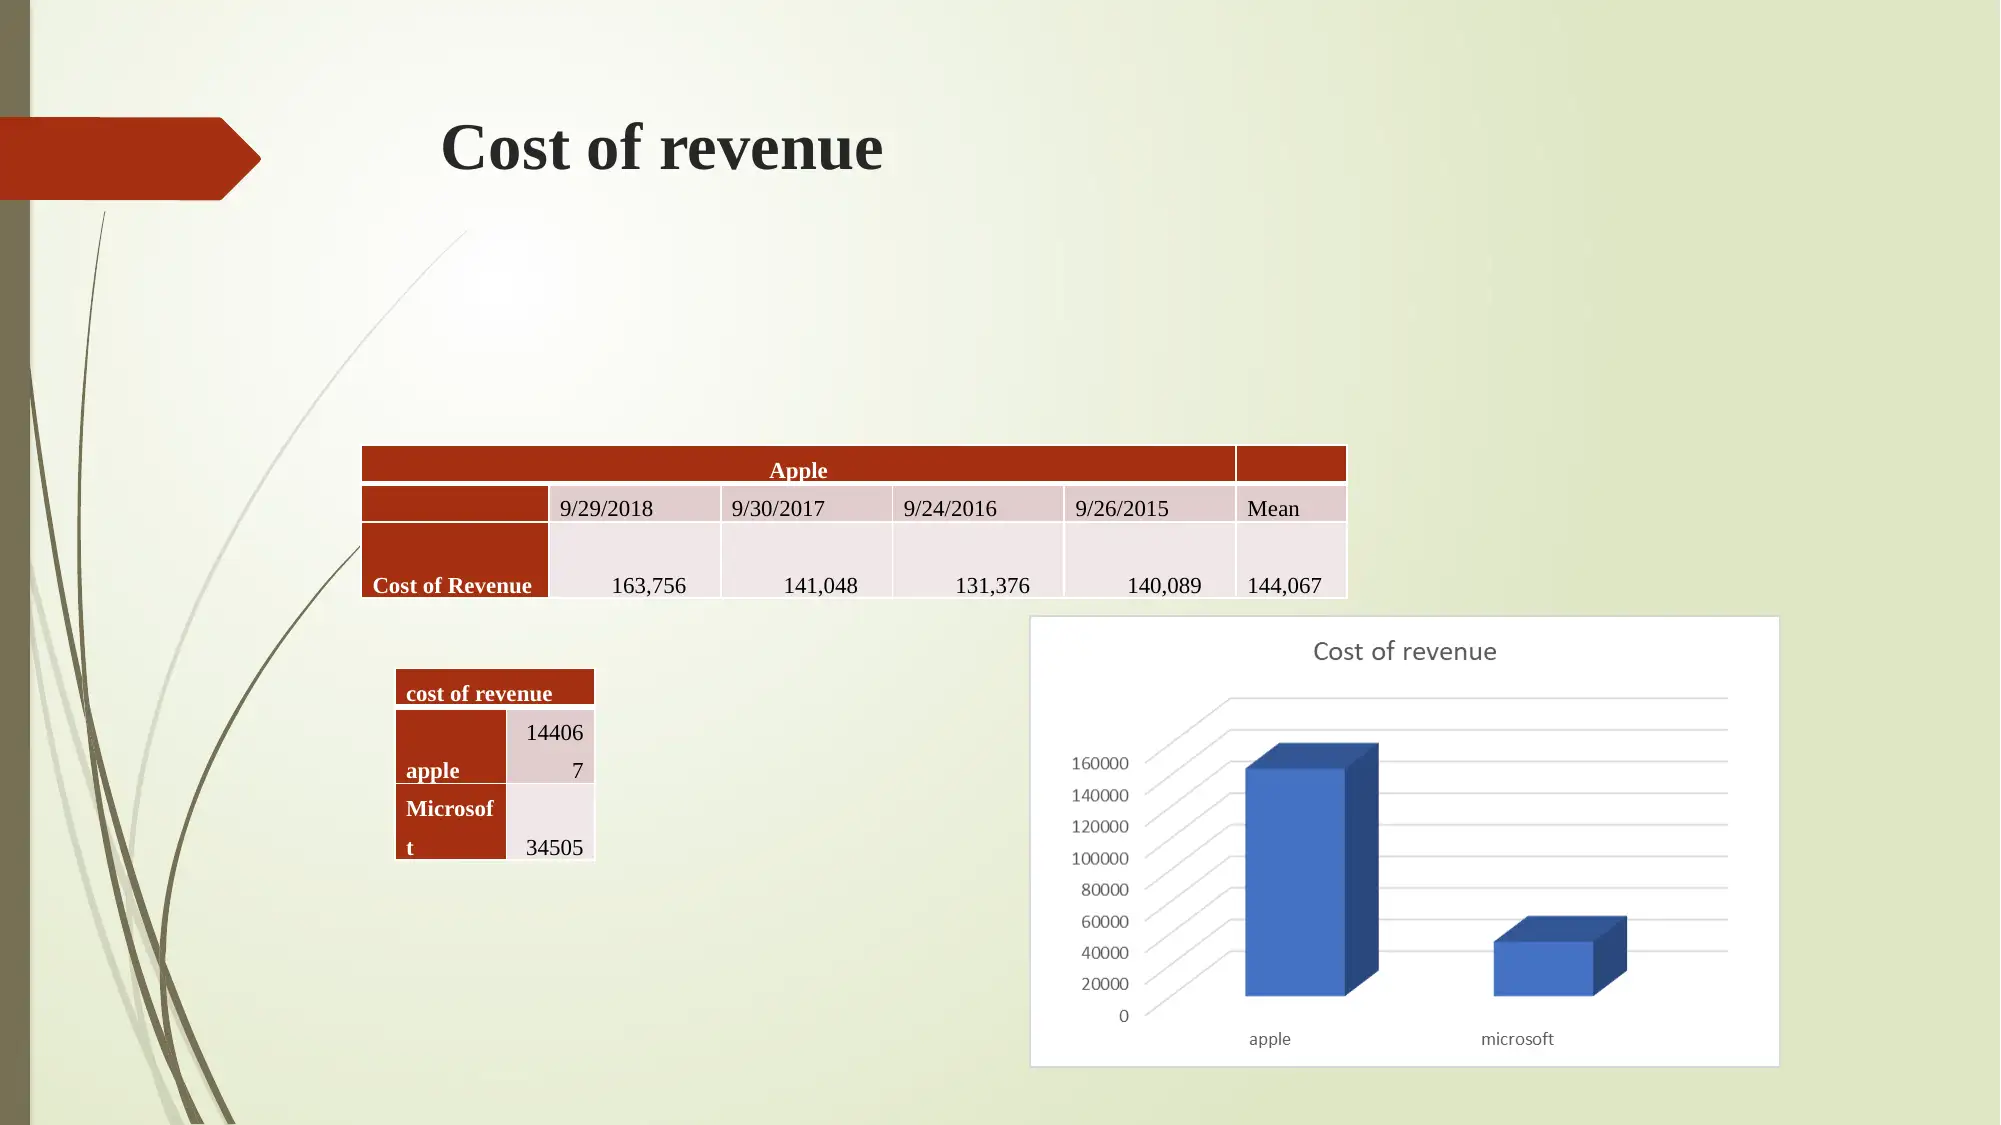
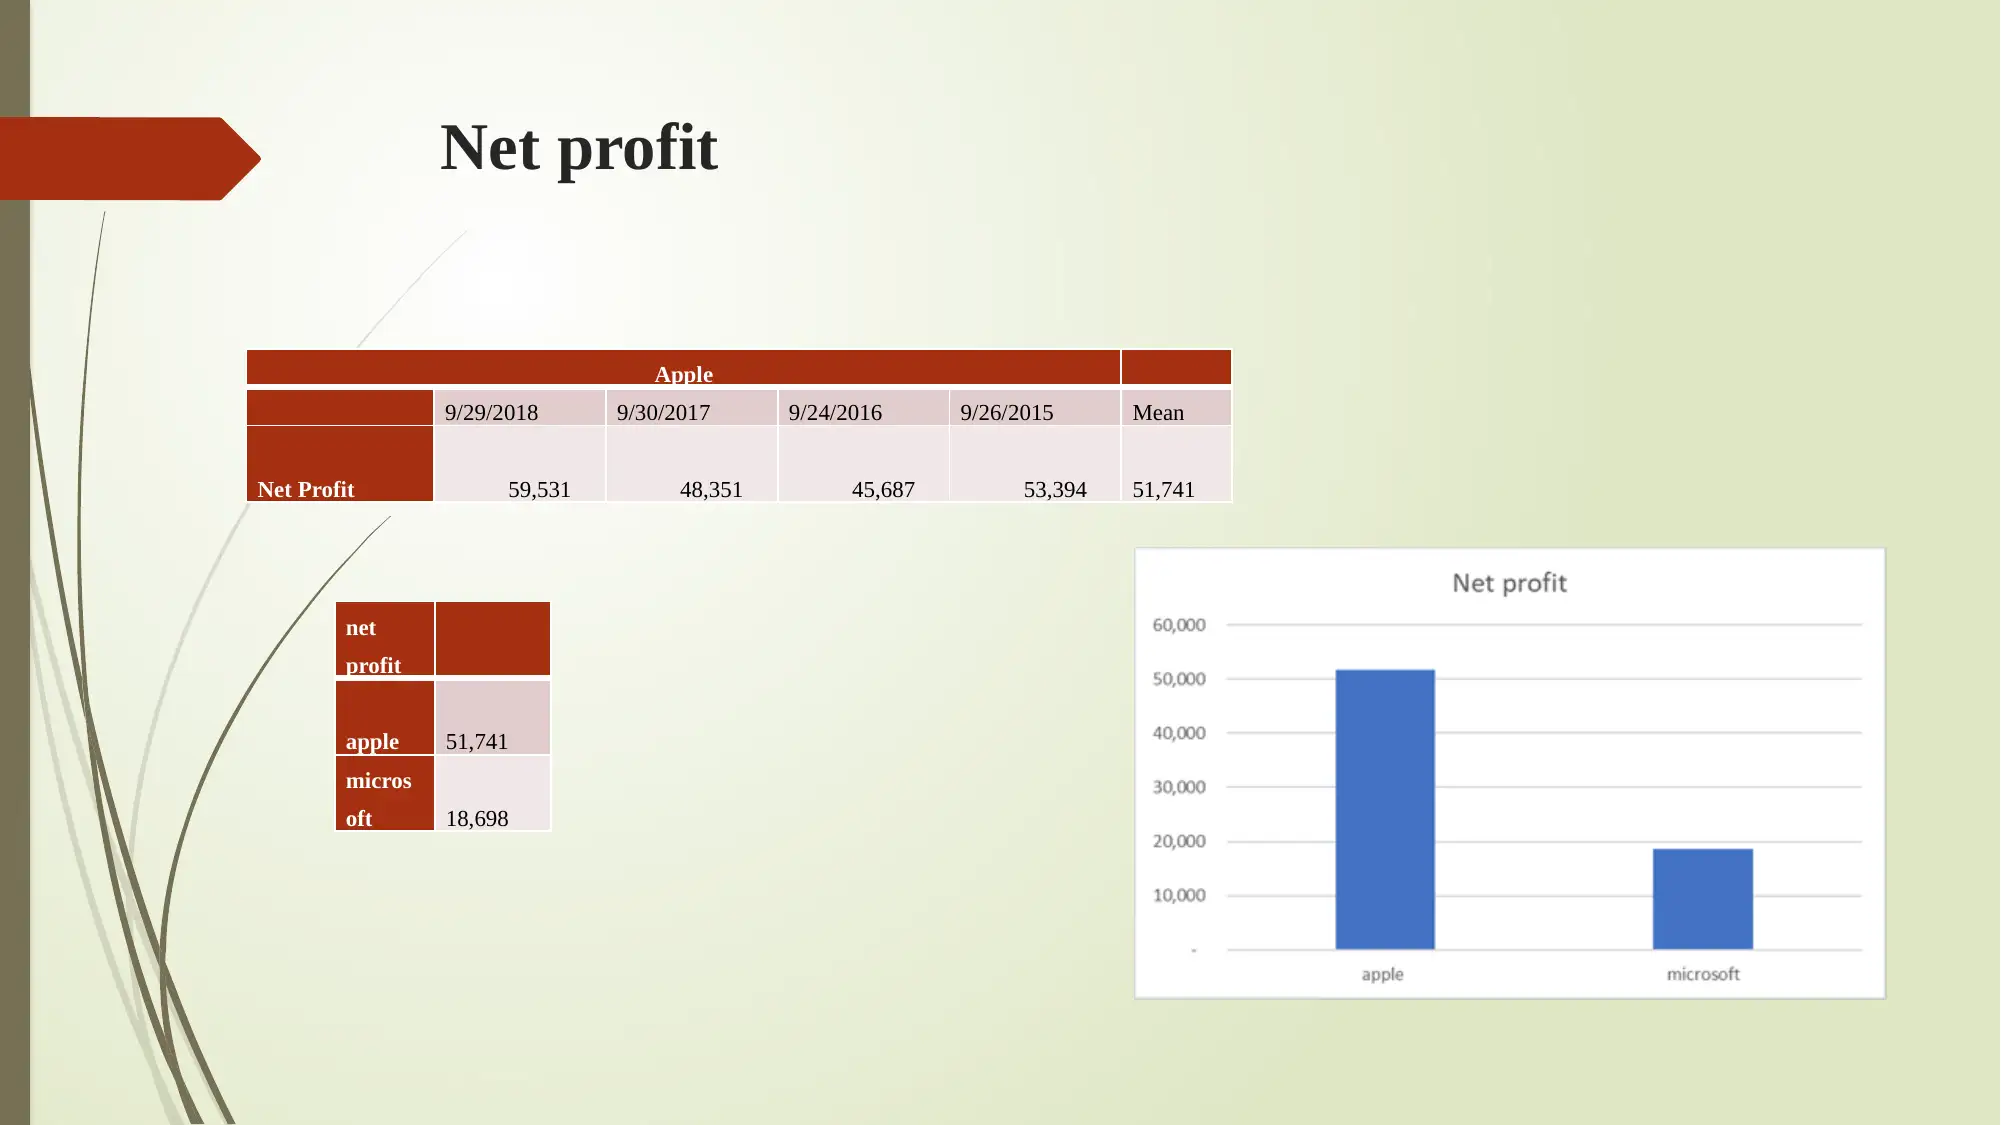
This assignment provides a comprehensive introduction to statistics for management. It begins by defining statistics and its characteristics, emphasizing its role in collecting, analyzing, and interpreting data to generate meaningful information. The assignment then delves into the types of data businesses access, differentiating between primary and secondary sources, and detailing various methods for data collection, such as interviews, surveys, and analysis. It also explains the difference between sample and population, highlighting their significance in data gathering. The document further explores the value of employing statistical methods, including how businesses use statistical data to gain a competitive advantage and develop effective strategies. It also explains the difference between descriptive and inferential statistics. Finally, the assignment includes examples of mean revenue and net profit for companies like Apple and Microsoft, as well as trend forecasting. A list of relevant books and journals is provided for further study.

Statistics for Management
Paraphrase This Document
Need a fresh take? Get an instant paraphrase of this document with our AI Paraphraser

Introduction to statistics
Statistics is a method of collecting, analysing and interpreting data and information to obtain results.
The main purpose is to generate meaningful information from that data. It is a mathematical way of
analysing info. There are many characteristic of statistics that are defined below :-
They are aggregate of facts and figures.
They are expressed in numbers
It is gathered for a particular purpose and in systematic manner.
Statistics collected are of specific time period.
They must be compared with each other
The stats are affected due to change in market situations.

Types of data and info business can access
A business uses different types of data to get relevant info. The data is obtained from various sources.
In this main thing is source has to be authentic and reliable. Usually there are only two types of
sources from where data is gathered. They are primary and secondary.
Primary – It is a type of data gathered by business from market. This is collected for first time.
besides, aim is to identify gap that exists. There are many ways to collect primary data as well. They
are as follows :-
Interview- here, data is gathered by doing conversation with people. For this questions are asked to
them and answers are obtained.
Survey – it is a method where questionnaires are distributed to people for data collection. It is more
effective than interview.
Observation- In this data is gathered by observation so the data may get influenced.
Analysis – It is way of gathering data by examining trends and patterns in it.
⊘ This is a preview!⊘
Do you want full access?
Subscribe today to unlock all pages.

Trusted by 1+ million students worldwide

CONT..
Secondary- In this method, data is collected by evaluating and analysing previous articles,
journals, data set, etc. this is done to present data in new and updated manner.
Statistical survey – the survey is usually conducted through sample. The assumptions are
made from population. It benefits business to gather full data.
Census- From census data is gathered of specific time period and several items of
population.
Register – they are like large data set from where data is collected.
Paraphrase This Document
Need a fresh take? Get an instant paraphrase of this document with our AI Paraphraser

Difference between sample and population
In order to gather data, it is necessary for business to define their sample size from
population. This enables in collecting relevant info from them. Apart from it, sample
defines specific people. The difference between them is as follows
Population Sample
Population represent arithmetic mean of whole
population.
Sample means a small data derived from
population.
It is called as complete set. Sample is subset of population.
The members belong to all group. The members belong to specific sub set group.
The measurable quality is called parameter. Here, it is called as statistic.
Symbol is = N Symbol is = n
Its accuracy is high as compared to sample Its accuracy is low

Value of employing statistical method
Every business uses statistical data to gain competitive advantage. The data collected
provide crucial and relevant info. From that it is easy for business to identify trends and
patterns in market.
With help of it, they are able to develop strategies and plans. This enables them to attain
goals and objectives. Moreover, business can use technology in statistics. This will help in
obtaining precise data.
⊘ This is a preview!⊘
Do you want full access?
Subscribe today to unlock all pages.

Trusted by 1+ million students worldwide

Difference between descriptive and inferential
statistics
The statistical method used by business varies from one another. This is because of
technique used and results generated from it. The difference methods is defined below :
Descriptive Inferential
It is concerned with target population. It includes inference of sample from
population.
In this data is organised and represented in
meaningful manner.
Here, tests are applied and hypothesis is done
to determine relationship between variables.
The graphs, charts, histogram, etc. is used to
show results.
The results are shown through probability
scores.
It describes the data which is already
known.
The method is used to make conclusion about
population.
There are several tools that is used such as
mean, mode, median, etc.
There are different types of test that is applied
like regression, anova, etc.
Paraphrase This Document
Need a fresh take? Get an instant paraphrase of this document with our AI Paraphraser

Descriptive and inferential data
Descriptive Inferential
It is concerned with target population. It includes inference of sample from
population.
In this data is organised and represented in
meaningful manner.
Here, tests are applied and hypothesis is done
to determine relationship between variables.
The graphs, charts, histogram, etc. is used to
show results.
The results are shown through probability
scores.
It describes the data which is already
known.
The method is used to make conclusion about
population.
There are several tools that is used such as
mean, mode, median, etc.
There are different types of test that is applied
like regression, anova, etc.

Descriptive and inferential data statistics
Mean revenue of Apple and Microsoft
Apple
9/29/2018 9/30/2017 9/24/2016 9/26/2015 Mean
Total Revenue 265,595 229,234 215,639 233,715 236046
total revenue
apple 236,046
Micros
oft 97916
Mean revenue of Apple and Microsoft
Apple
9/29/2018 9/30/2017 9/24/2016 9/26/2015 Mean
Total Revenue 265,595 229,234 215,639 233,715 236046
total revenue
apple 236,046
Micros
oft 97916
⊘ This is a preview!⊘
Do you want full access?
Subscribe today to unlock all pages.

Trusted by 1+ million students worldwide

Cost of revenue
Apple
9/29/2018 9/30/2017 9/24/2016 9/26/2015 Mean
Cost of Revenue 163,756 141,048 131,376 140,089 144,067
cost of revenue
apple
14406
7
Microsof
t 34505
Apple
9/29/2018 9/30/2017 9/24/2016 9/26/2015 Mean
Cost of Revenue 163,756 141,048 131,376 140,089 144,067
cost of revenue
apple
14406
7
Microsof
t 34505
Paraphrase This Document
Need a fresh take? Get an instant paraphrase of this document with our AI Paraphraser

Gross profit
Apple
9/29/2018 9/30/2017 9/24/2016 9/26/2015 Mean
Gross Profit 101,839 88,186 84,263 93,626 91,979
gross profit
apple 91979
microsoft 34505
Apple
9/29/2018 9/30/2017 9/24/2016 9/26/2015 Mean
Gross Profit 101,839 88,186 84,263 93,626 91,979
gross profit
apple 91979
microsoft 34505

Net profit
Apple
9/29/2018 9/30/2017 9/24/2016 9/26/2015 Mean
Net Profit 59,531 48,351 45,687 53,394 51,741
net
profit
apple 51,741
micros
oft 18,698
Apple
9/29/2018 9/30/2017 9/24/2016 9/26/2015 Mean
Net Profit 59,531 48,351 45,687 53,394 51,741
net
profit
apple 51,741
micros
oft 18,698
⊘ This is a preview!⊘
Do you want full access?
Subscribe today to unlock all pages.

Trusted by 1+ million students worldwide
1 out of 16
Related Documents

Your All-in-One AI-Powered Toolkit for Academic Success.
+13062052269
info@desklib.com
Available 24*7 on WhatsApp / Email
Unlock your academic potential
Copyright © 2020–2025 A2Z Services. All Rights Reserved. Developed and managed by ZUCOL.