Statistics for Management: Statistical Methods and Business Insights

Verified

Added on  2023/01/13

|23
|755
|28
Presentation
AI Summary
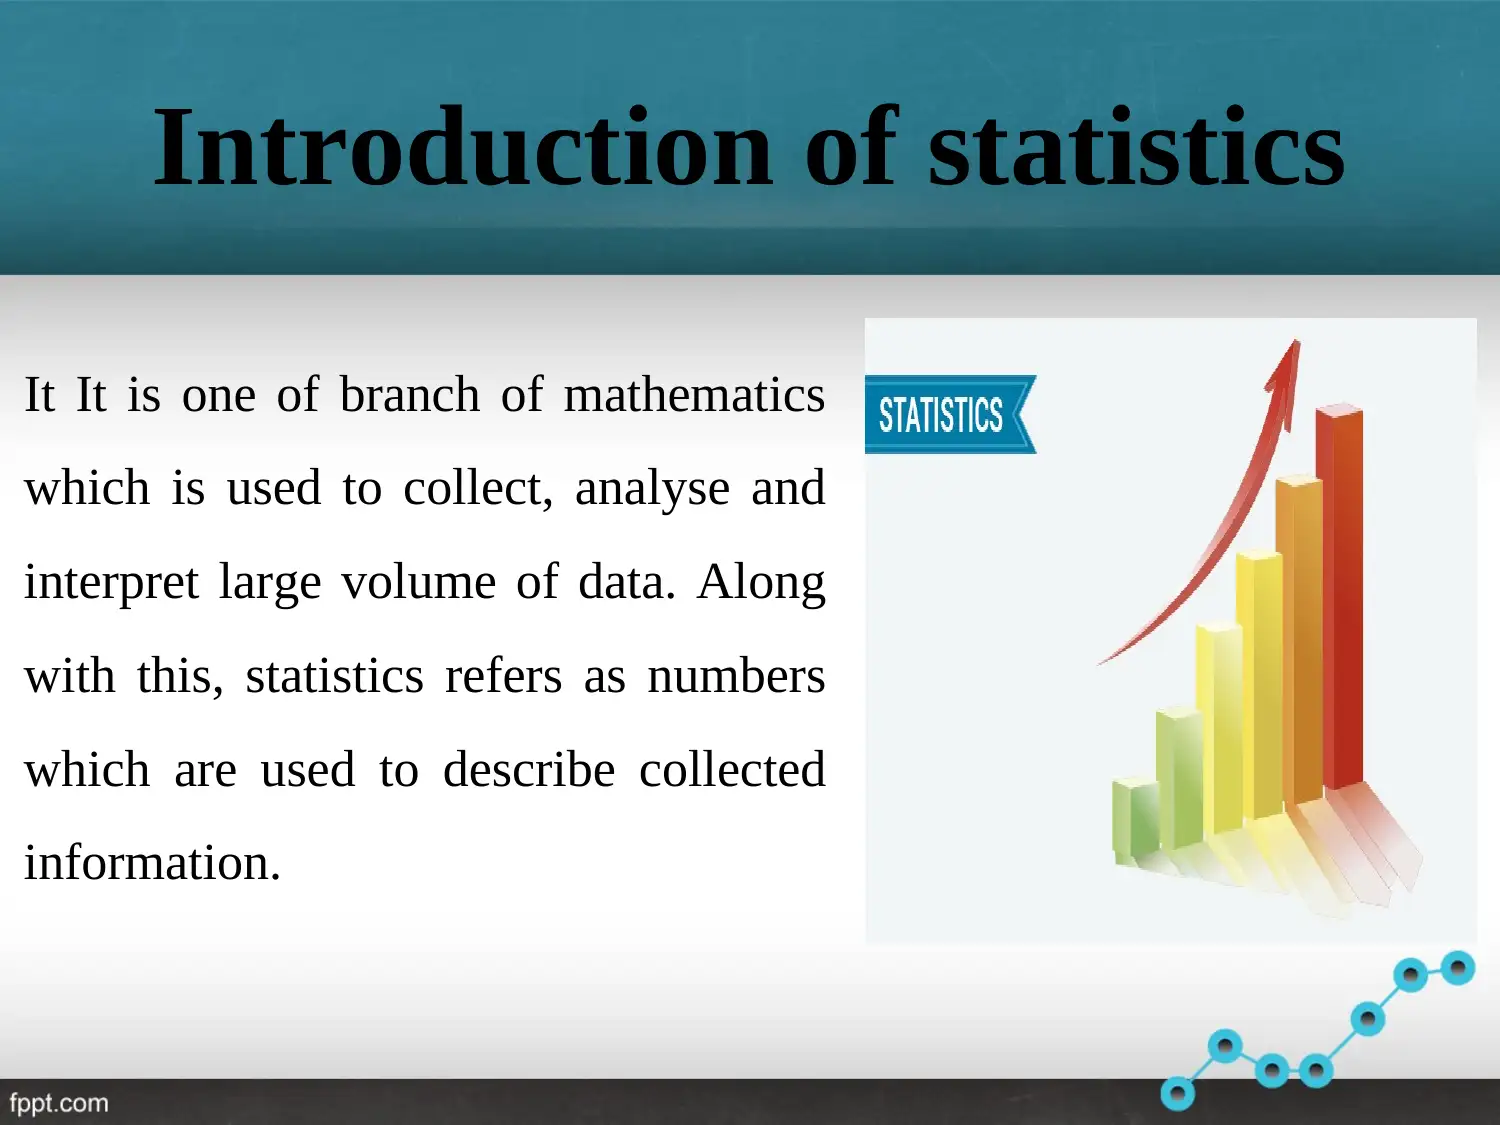
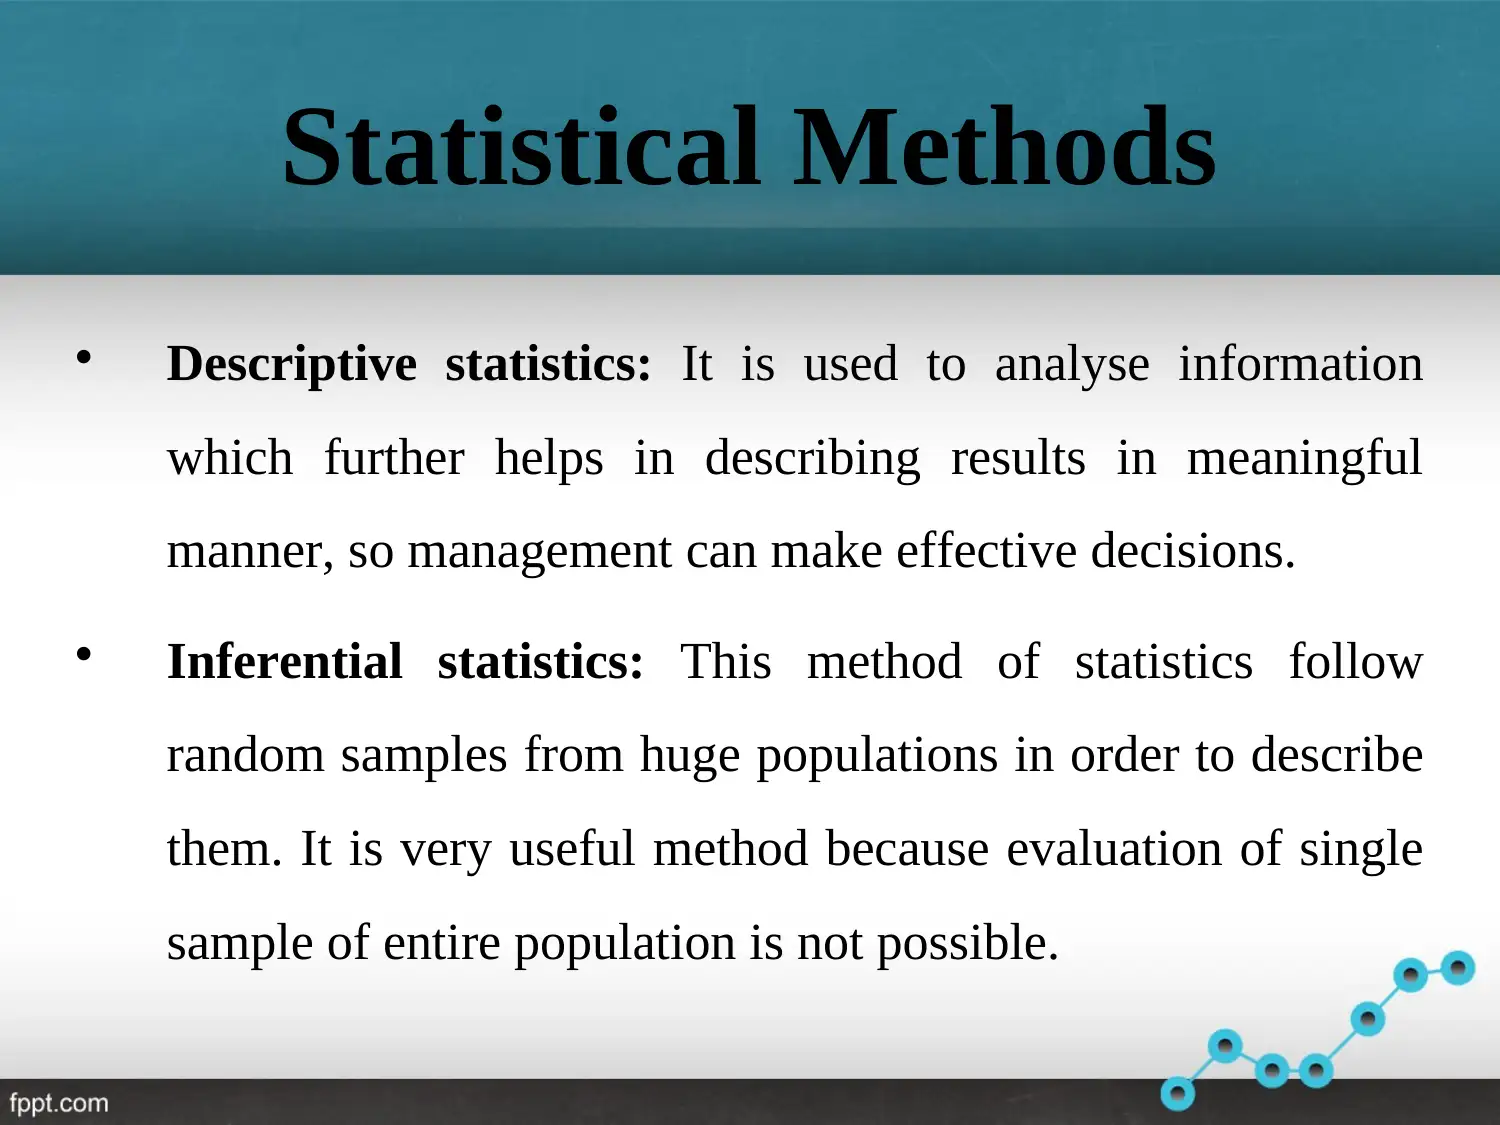
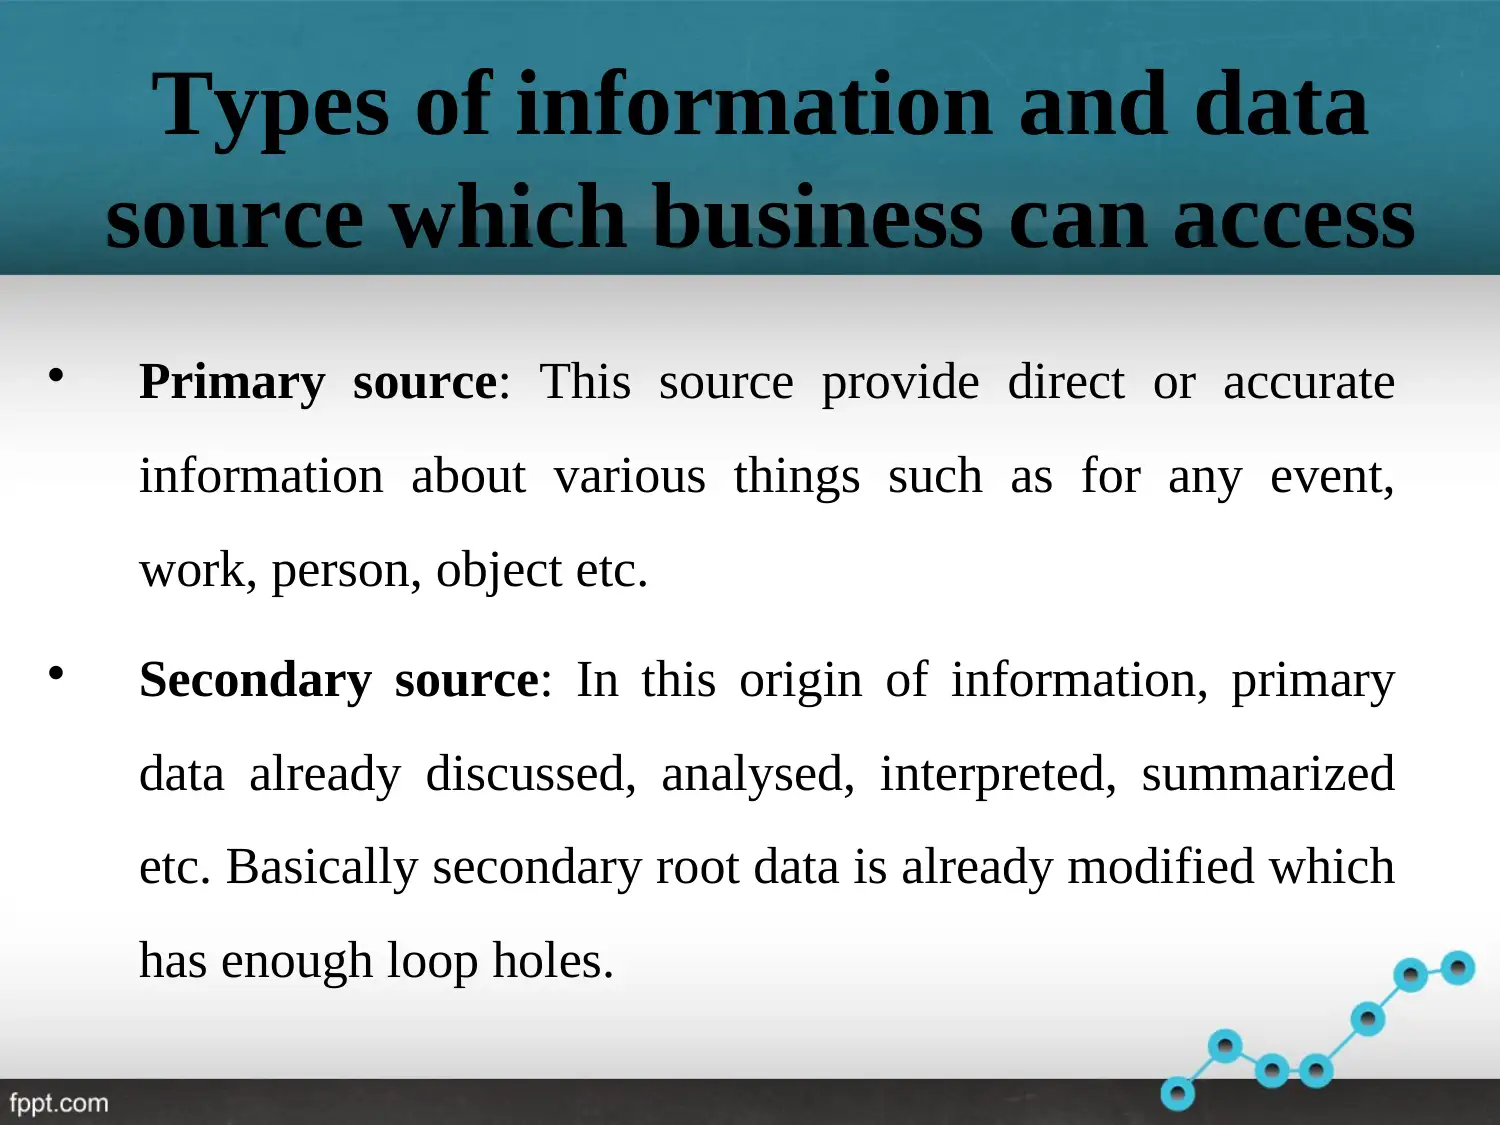
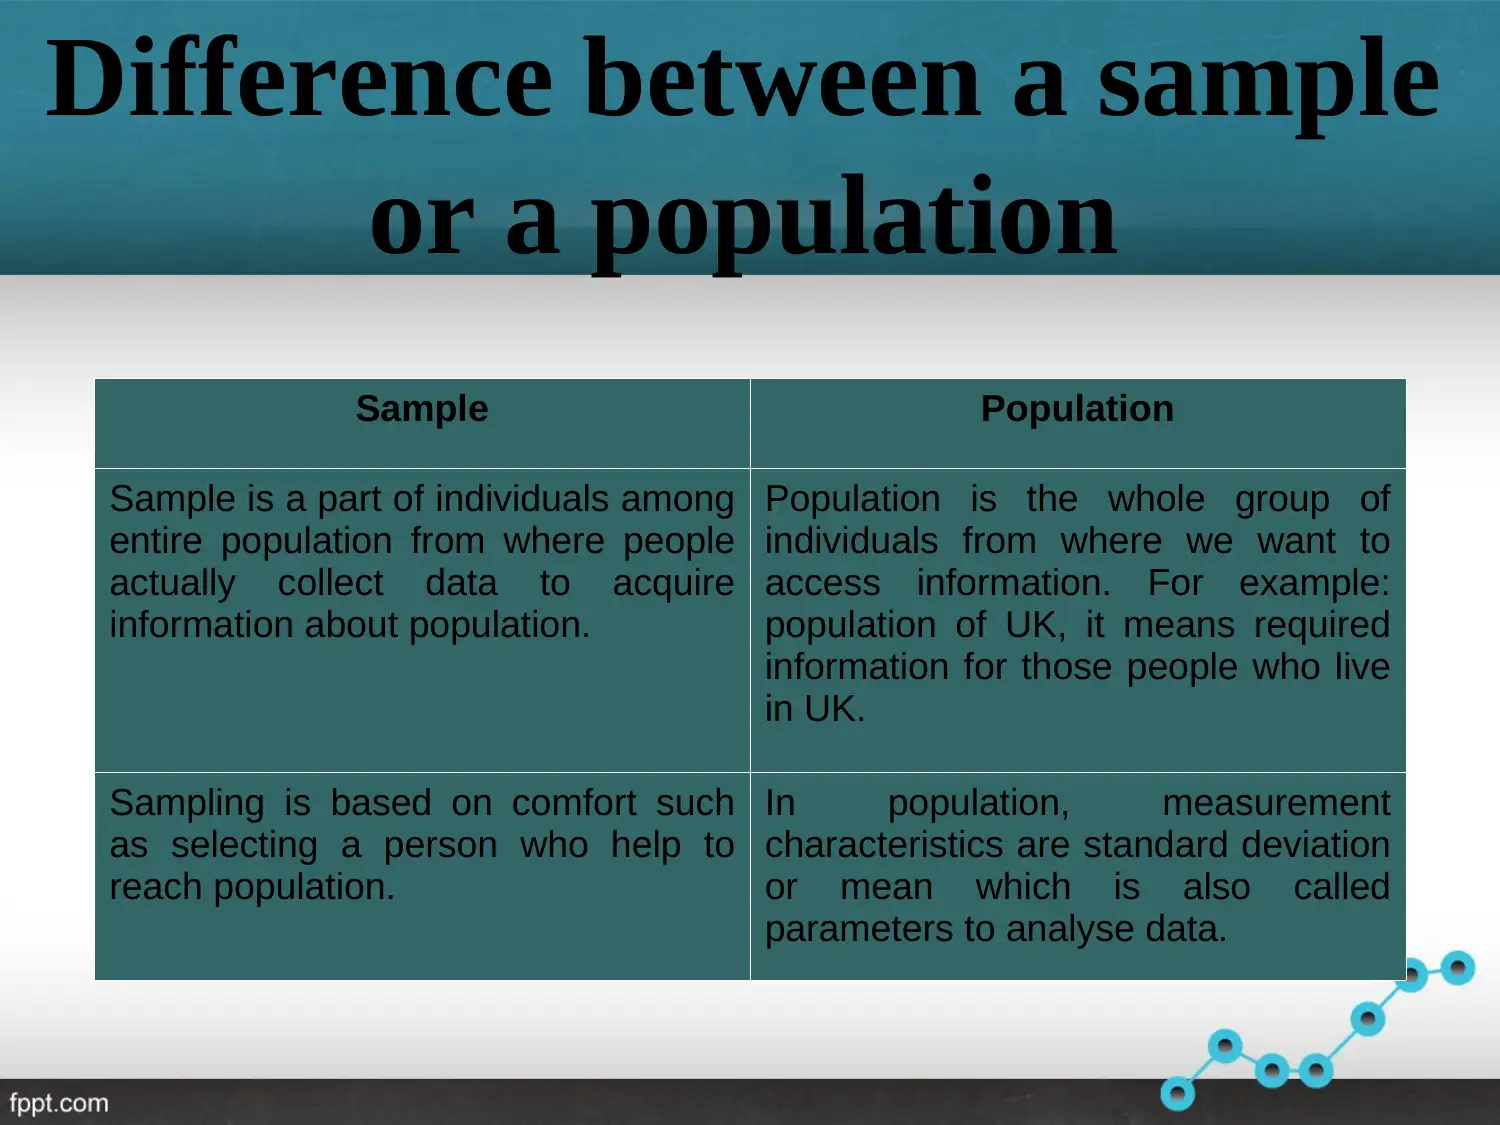
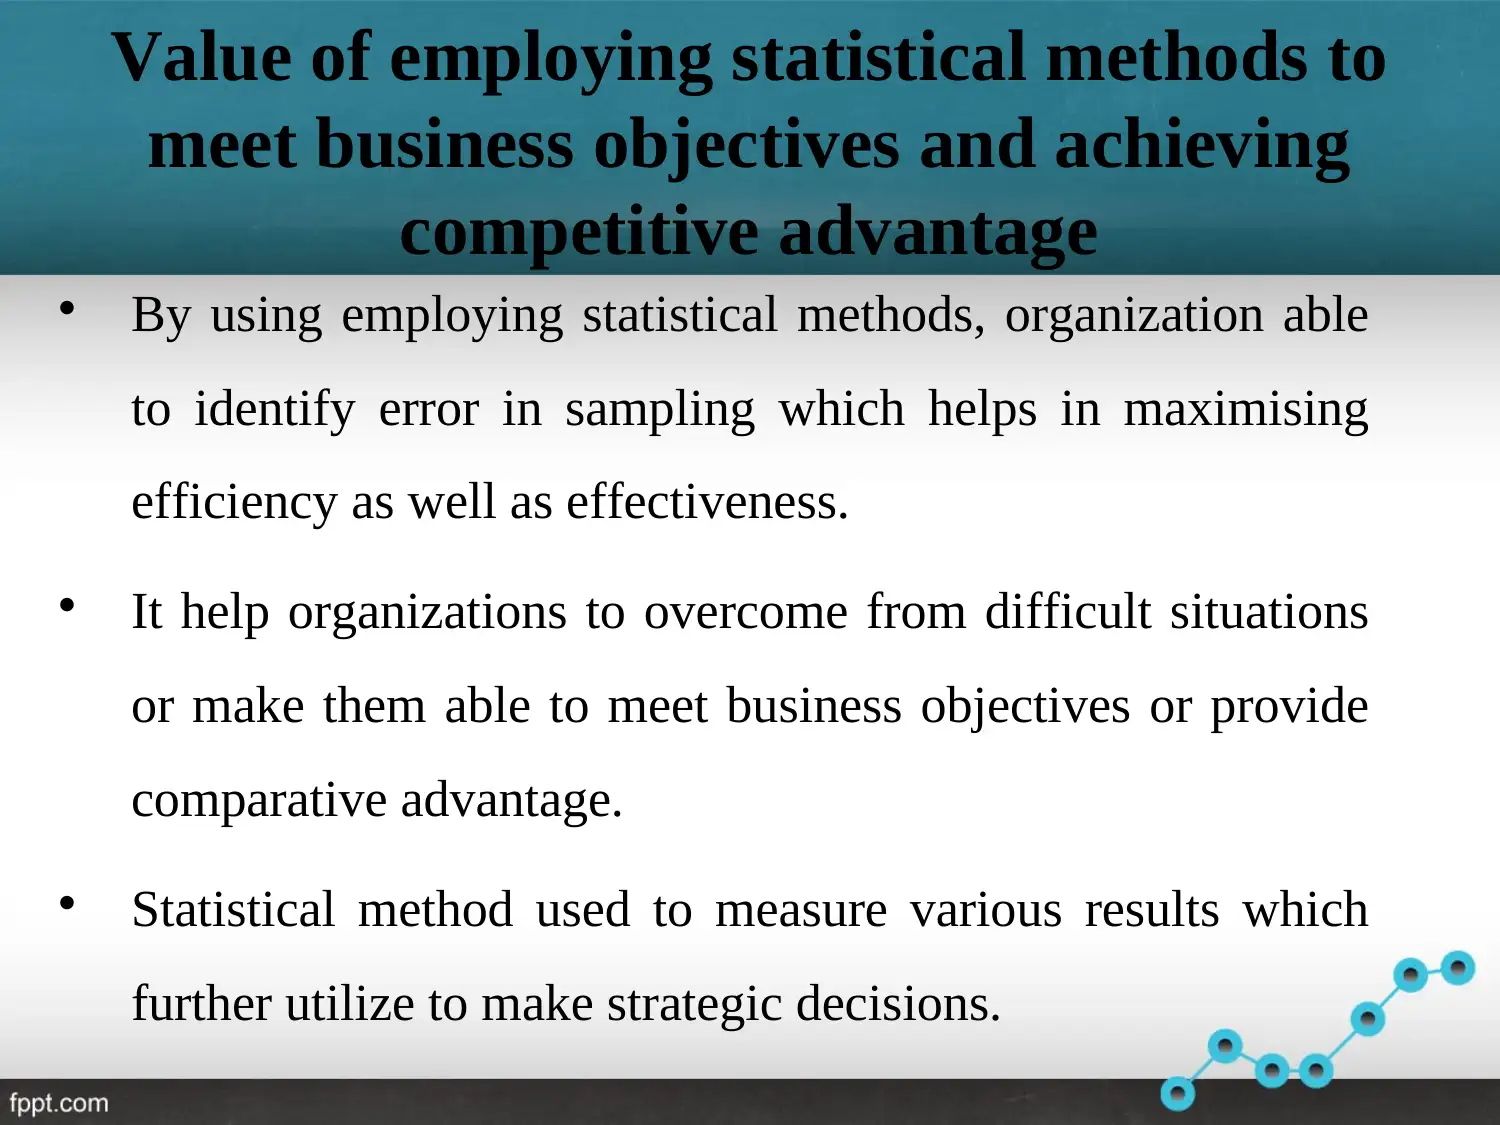
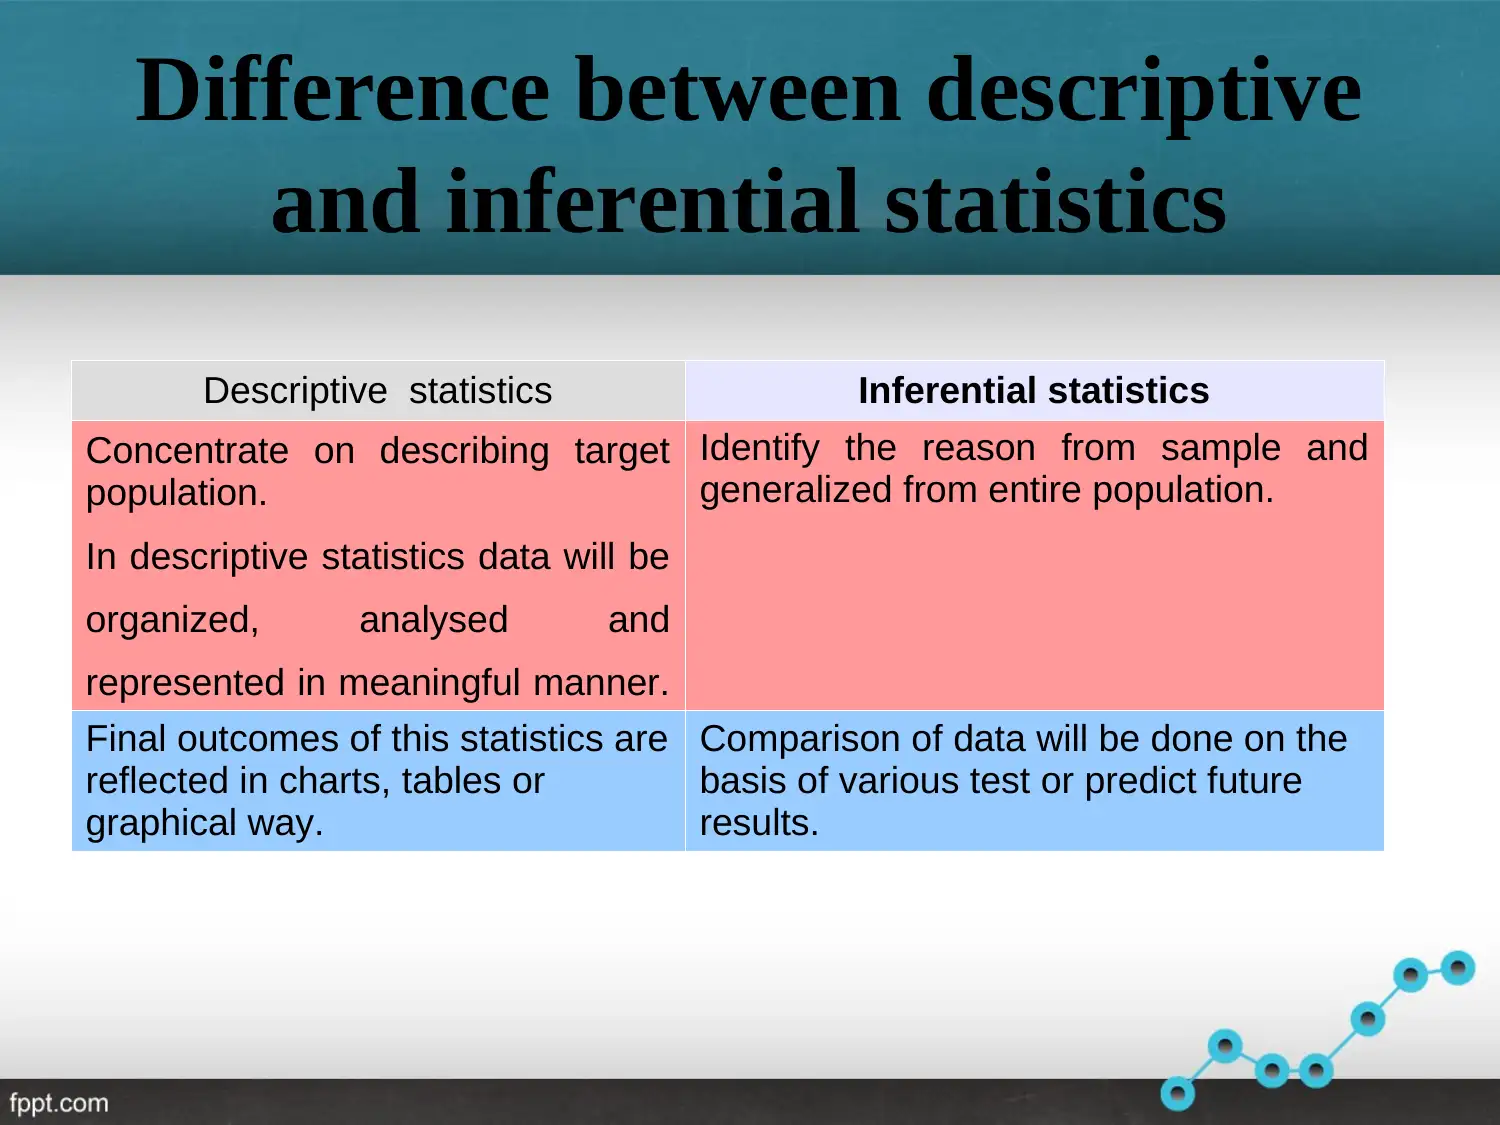
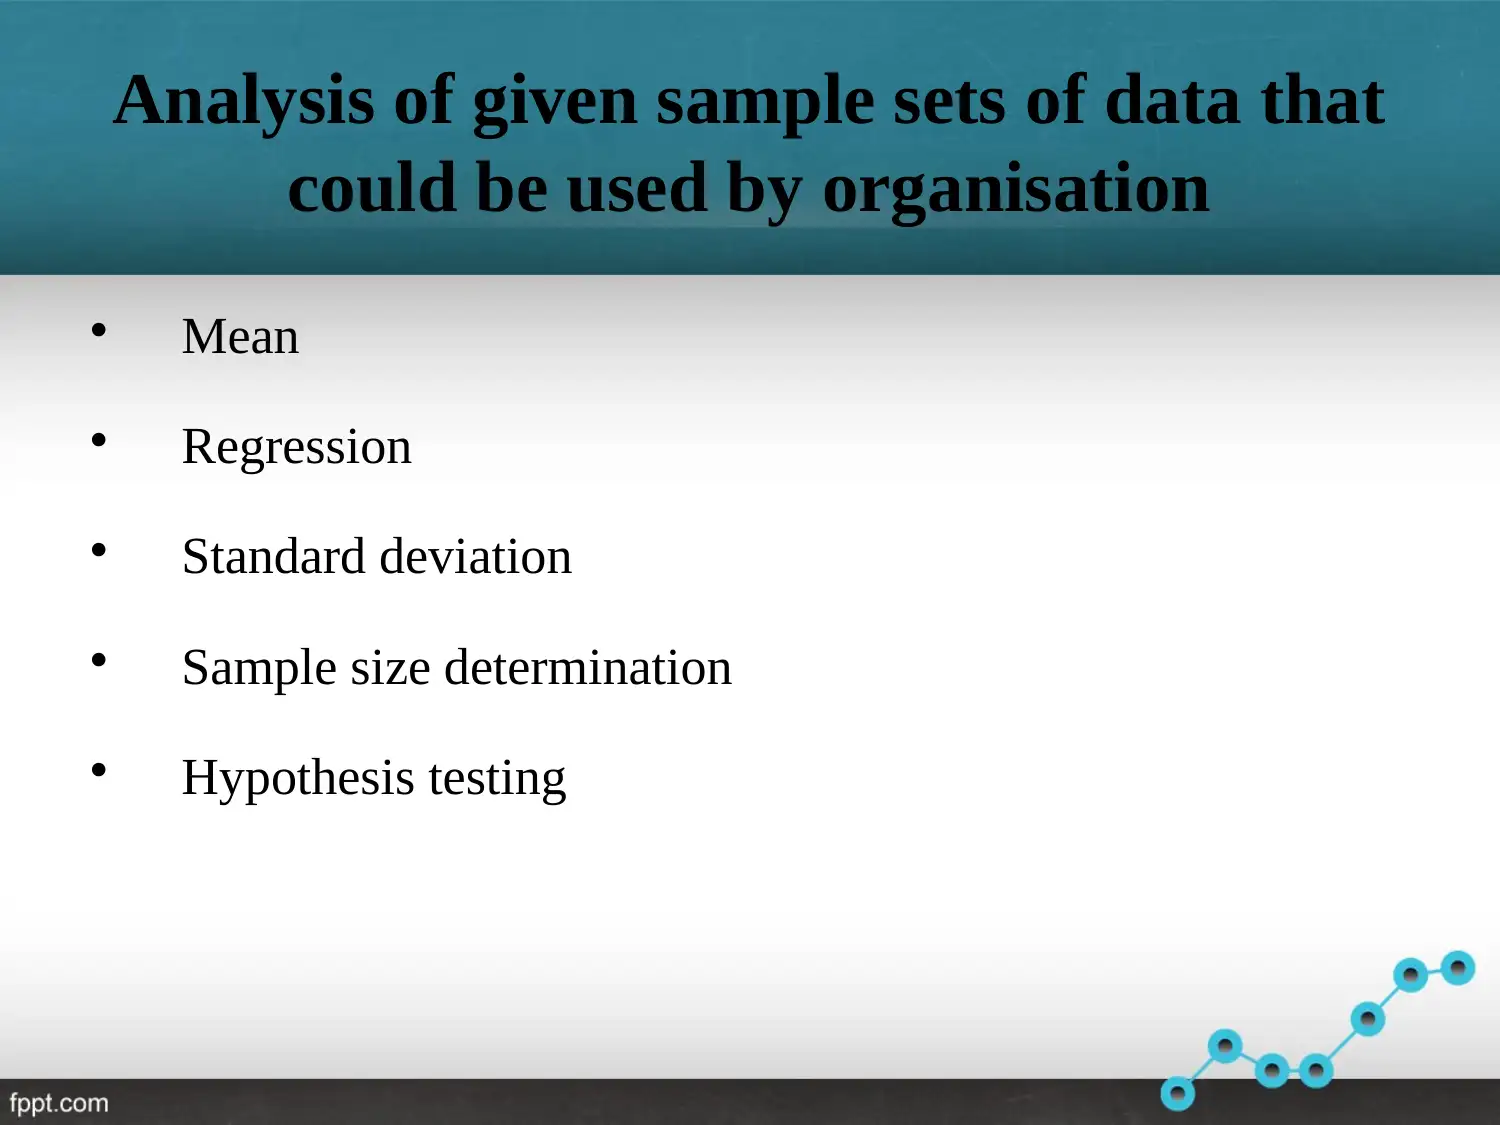
This presentation provides a comprehensive overview of statistical analysis for management. It begins with an introduction to statistics, defining its key characteristics and methods, including descriptive and inferential statistics. The presentation then explores different types of data sources and the distinctions between samples and populations. It emphasizes the value of employing statistical methods to meet business objectives and gain a competitive advantage, including identifying errors, making strategic decisions, and measuring results. The presentation further details the differences between descriptive and inferential statistics and provides examples of statistical methods such as mean, regression, standard deviation, sample size determination, and hypothesis testing. Part 2 includes bar charts of revenues, profit, and scatter charts of share prices for various companies, concluding that statistical analysis is essential for data collection, analysis, and interpretation, and that it helps management predict future activities. The presentation concludes with references to support the information provided.
Document Page
Statistics for Management
PART 1 & 2
tabler-icon-diamond-filled.svg

Secure Best Marks with AI Grader

Need help grading? Try our AI Grader for instant feedback on your assignments.
Document Page
Theory
PART 1
Document Page
INTRODUCTION
Statistical analysis is a framework which is used by
organizations to manage their data and further evaluate
problems which are related to business operations. Presentation
slides includes the content regarding statistics, its key
characteristics or methods etc.
Document Page
INTRODUCTION
Statistical analysis is a framework which is used by
organizations to manage their data and further evaluate
problems which are related to business operations. Presentation
slides includes the content regarding statistics, its key
characteristics or methods etc.
tabler-icon-diamond-filled.svg

Secure Best Marks with AI Grader

Need help grading? Try our AI Grader for instant feedback on your assignments.
Document Page
Introduction of statistics
It It is one of branch of mathematics
which is used to collect, analyse and
interpret large volume of data. Along
with this, statistics refers as numbers
which are used to describe collected
information.
Document Page
Key characteristics of
statistics
Statistical data includes aggregate facts which make it
different from generate data.
Available data may be effected by many factors which cause
overall results (Key characteristics of statistical, 2020).
Statistical data should be presented in numeric figures, so
people can analyse as well as interpret the results.
Document Page
Statistical Methods
Descriptive statistics: It is used to analyse information
which further helps in describing results in meaningful
manner, so management can make effective decisions.
Inferential statistics: This method of statistics follow
random samples from huge populations in order to describe
them. It is very useful method because evaluation of single
sample of entire population is not possible.
tabler-icon-diamond-filled.svg

Paraphrase This Document

Need a fresh take? Get an instant paraphrase of this document with our AI Paraphraser
Document Page
Types of information and data
source which business can access
Primary source: This source provide direct or accurate
information about various things such as for any event,
work, person, object etc.
Secondary source: In this origin of information, primary
data already discussed, analysed, interpreted, summarized
etc. Basically secondary root data is already modified which
has enough loop holes.
Document Page
Difference between a sample
or a population
Sample Population
Sample is a part of individuals among
entire population from where people
actually collect data to acquire
information about population.
Population is the whole group of
individuals from where we want to
access information. For example:
population of UK, it means required
information for those people who live
in UK.
Sampling is based on comfort such
as selecting a person who help to
reach population.
In population, measurement
characteristics are standard deviation
or mean which is also called
parameters to analyse data.
Document Page
Value of employing statistical methods to
meet business objectives and achieving
competitive advantage
By using employing statistical methods, organization able
to identify error in sampling which helps in maximising
efficiency as well as effectiveness.
It help organizations to overcome from difficult situations
or make them able to meet business objectives or provide
comparative advantage.
Statistical method used to measure various results which
further utilize to make strategic decisions.
tabler-icon-diamond-filled.svg

Secure Best Marks with AI Grader

Need help grading? Try our AI Grader for instant feedback on your assignments.
Document Page
Difference between descriptive
and inferential statistics
Descriptive statistics Inferential statistics
Concentrate on describing target
population.
In descriptive statistics data will be
organized, analysed and
represented in meaningful manner.
Identify the reason from sample and
generalized from entire population.
Final outcomes of this statistics are
reflected in charts, tables or
graphical way.
Comparison of data will be done on the
basis of various test or predict future
results.
Document Page
Analysis of given sample sets of data that
could be used by organisation
Mean
Regression
Standard deviation
Sample size determination
Hypothesis testing
Document Page
Application
PART 2
tabler-icon-diamond-filled.svg

Paraphrase This Document

Need a fresh take? Get an instant paraphrase of this document with our AI Paraphraser
Document Page
Bar charts of Revenues
Document Page
Bar charts of profit
Document Page
Scatter chart of share prices
tabler-icon-diamond-filled.svg

Secure Best Marks with AI Grader

Need help grading? Try our AI Grader for instant feedback on your assignments.
Document Page
Apple Company
Document Page
MSFT Company
Document Page
Amazon Company
tabler-icon-diamond-filled.svg

Paraphrase This Document

Need a fresh take? Get an instant paraphrase of this document with our AI Paraphraser
Document Page
Netflix Company
Document Page
Conclusion
With the help of given presentation, it has been concluded that
statistical analysis is very essential for organization to collect
data and further analyse or interpret. After evaluating results by
using statistical methods such as mean, standard deviation,
hypothesis test etc. management will predict future activities.
Document Page
REFERENCES
Key characteristics of statistical. 2020. [Online]. Available
Through:<http://www.economicsdiscussion.net/statistics/7
-main-characteristics-of-statistics-explained/2317>
Embrechts, P. and Hofert, M., 2014. Statistics and quantitative risk
management for banking and insurance. Annual Review of
Statistics and Its Application. 1. pp.493-514.
Keller, G., 2015. Statistics for Management and Economics,
Abbreviated. Cengage Learning.
tabler-icon-diamond-filled.svg

Secure Best Marks with AI Grader

Need help grading? Try our AI Grader for instant feedback on your assignments.
Document Page
THANK YOU
chevron_up_icon
1 out of 23
circle_padding
hide_on_mobile
zoom_out_icon
logo.png

Your All-in-One AI-Powered Toolkit for Academic Success.

Available 24*7 on WhatsApp / Email

[object Object]