Statistics for Management: Analysis of Earning, Performance Report
VerifiedAdded on 2020/06/06
|20
|3435
|419
Report
AI Summary
This report presents a statistical analysis of various datasets relevant to management. It begins by comparing the earning capacities of men and women in both public and private sectors from 2009 to 2016, using tables, charts, and statistical measures like mean and variance to identify differences and trends. The report then examines student performance, analyzing mean marks, pros and cons of such measurements, and measures of dispersion. Furthermore, it delves into an economic order quantity (EOQ) analysis for olive oil deliveries, calculating optimal order quantities and comparing costs. The report concludes with the presentation of pie and bar charts, and explores the relationship between the number of bedrooms and house prices in specific streets, providing a comprehensive overview of statistical techniques and their applications in management contexts.
Statistics for management
Paraphrase This Document
Need a fresh take? Get an instant paraphrase of this document with our AI Paraphraser
TABLE OF CONTENTS
INTRODUCTION...........................................................................................................................1
TASK 1............................................................................................................................................1
A Identifying the difference between earning capacity of men and women employees in
public sector................................................................................................................................1
B. Determination of the difference between earning capacity of women and men employees in
private sectors..............................................................................................................................2
C Presenting a time chart for the period of 2009-2016...............................................................3
D. Defining the changes in the earning level of these groups with the help of table and chart. .4
TASK 2............................................................................................................................................5
2.1 Presenting the data in the comprehensive method with the help of diagram such as...........5
2.2 Analysing the mean marks to be obtained by the students as well as the pros and cons of
such measurements......................................................................................................................6
Identifying the performance of students on the basis of measures of dispersion........................9
2.3 determining the student performance in the report.............................................................10
2.4 Analysing the weights and ages of the children on the basis of the line of best fit............11
TASK 3..........................................................................................................................................11
(a) Number of deliveries which are currently made each year.................................................12
(b) Number of bottles of olive oil that are delivered with each deliveries................................12
(c) Calculation of Economic order quantity (EOQ)..................................................................12
(d) Economic order quantity and cost comparison...................................................................13
TASK 4..........................................................................................................................................14
4.1 Preparation of pie and bar charts.........................................................................................14
4.2 Relationship between number of bedrooms and house price in those three streets............17
CONCLUSION..............................................................................................................................18
REFERENCES:.............................................................................................................................20
INTRODUCTION
Statistics is the most fundamental tool which is helpful in analysing the adequate
outcomes from the presented data set. Currently many business organisation has implemented
this technique over their financial data set as to analyse the growth, profitability as well as
efficiency of the business. These helps the manufacturing units to determine the ability of
producing the units as well as analysing the reorder level. In the present report there will be
various measurements and calculations which will be used for analysing the earning efficiency of
the men and women employees in public as well as private sector. The report will be beneficial
as there has been presentation of various graphs and chart that will be helpful tool in terms of
analysing the variations among such data base.
TASK 1
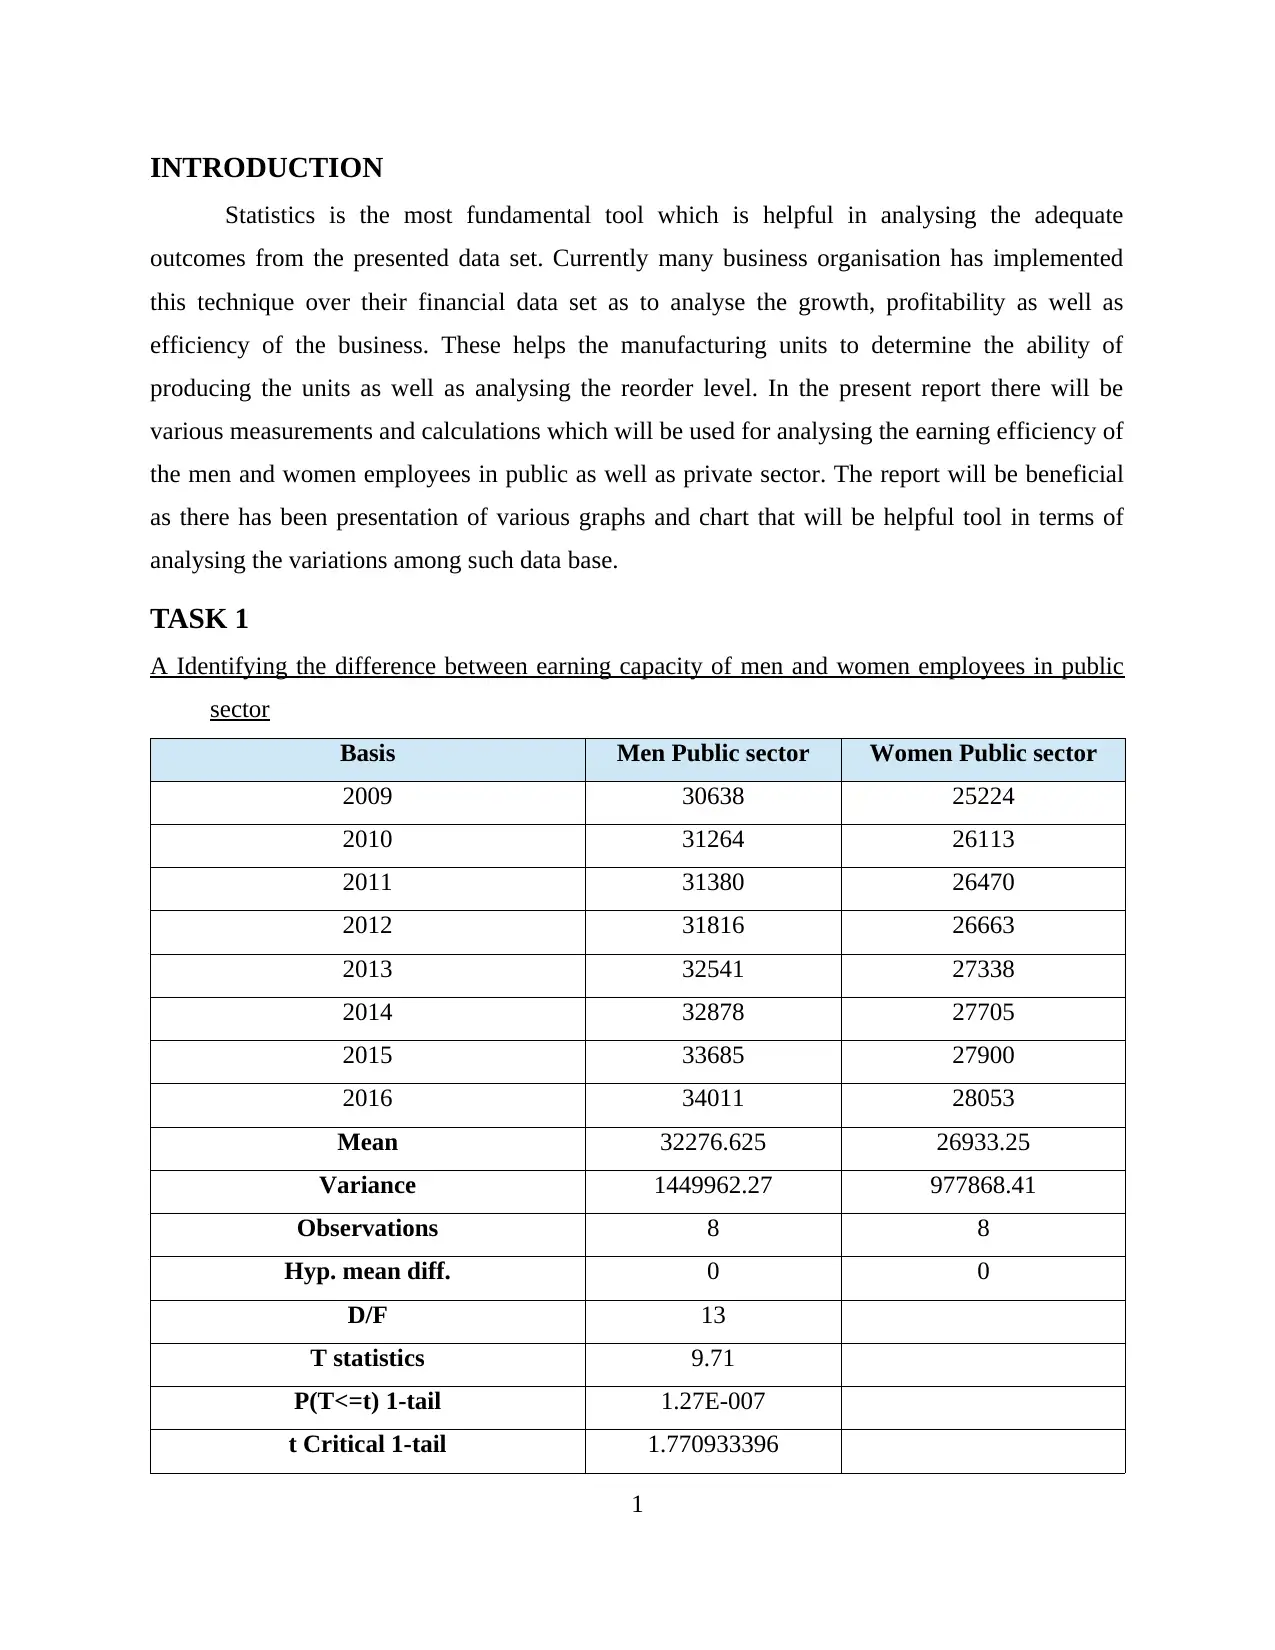
A Identifying the difference between earning capacity of men and women employees in public
sector
Basis Men Public sector Women Public sector
2009 30638 25224
2010 31264 26113
2011 31380 26470
2012 31816 26663
2013 32541 27338
2014 32878 27705
2015 33685 27900
2016 34011 28053
Mean 32276.625 26933.25
Variance 1449962.27 977868.41
Observations 8 8
Hyp. mean diff. 0 0
D/F 13
T statistics 9.71
P(T<=t) 1-tail 1.27E-007
t Critical 1-tail 1.770933396
1
Statistics is the most fundamental tool which is helpful in analysing the adequate
outcomes from the presented data set. Currently many business organisation has implemented
this technique over their financial data set as to analyse the growth, profitability as well as
efficiency of the business. These helps the manufacturing units to determine the ability of
producing the units as well as analysing the reorder level. In the present report there will be
various measurements and calculations which will be used for analysing the earning efficiency of
the men and women employees in public as well as private sector. The report will be beneficial
as there has been presentation of various graphs and chart that will be helpful tool in terms of
analysing the variations among such data base.
TASK 1
A Identifying the difference between earning capacity of men and women employees in public
sector
Basis Men Public sector Women Public sector
2009 30638 25224
2010 31264 26113
2011 31380 26470
2012 31816 26663
2013 32541 27338
2014 32878 27705
2015 33685 27900
2016 34011 28053
Mean 32276.625 26933.25
Variance 1449962.27 977868.41
Observations 8 8
Hyp. mean diff. 0 0
D/F 13
T statistics 9.71
P(T<=t) 1-tail 1.27E-007
t Critical 1-tail 1.770933396
1
⊘ This is a preview!⊘
Do you want full access?
Subscribe today to unlock all pages.
Trusted by 1+ million students worldwide
P(T<=t) 2-tail 2.54E-007
t Critical 2-tail 2.160368656
Interpretation: On the basis of table that reflect the overall gains in public sector which
were being obtained by men and women workers during the year 2009-2016. However, it can be
said that there is constant increment in the level of earning of men employees as it was 30638 in
2009 which increase to 34011 in 2016. However, the average income retention of the men
employees over these years is estimated as 32276.625. The variance of their earning capacity is
144962.27 which indicates that they have made the adequate earning throughout these years.
On the other side the women employees has earning capacity which is also has the
constant increment but not in that order as the men employees in this sector. In the year it was
25224 which has raised in the year 2016 as 28053. The average of their earning capacity is
26933.25 and variance was 977868.41. However, it will be improved and equal to the men
employees in the coming year as if the government will take necessary steps to facilitate the
employment opportunities to female workers. The difference between their earning is 13 and the
T statistics is 9.71. However, this reflect the positive outcomes as well as the business is
beneficial in terms of attaining the adequate gains and profitability. In terms with 1.27>0.05
which indicates that there is no such variations in their earning capacity.
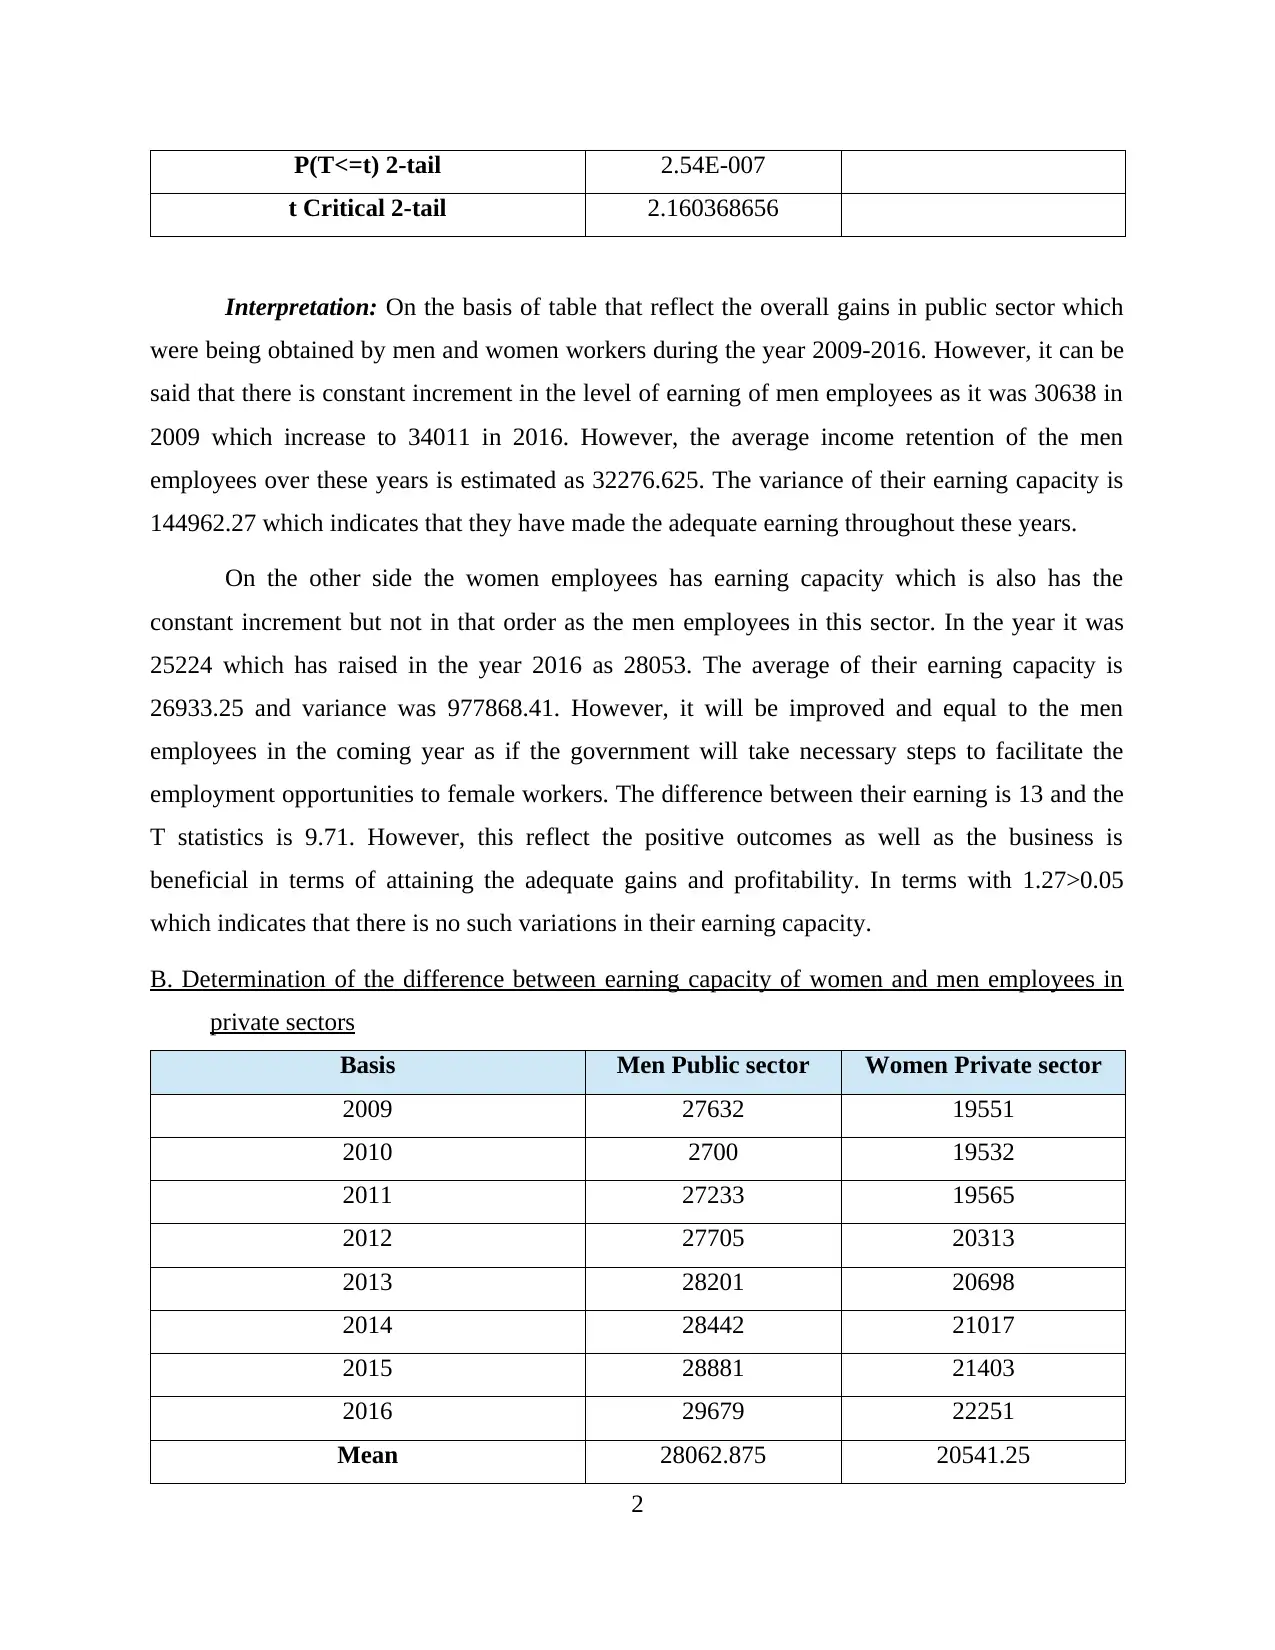
B. Determination of the difference between earning capacity of women and men employees in
private sectors
Basis Men Public sector Women Private sector
2009 27632 19551
2010 2700 19532
2011 27233 19565
2012 27705 20313
2013 28201 20698
2014 28442 21017
2015 28881 21403
2016 29679 22251
Mean 28062.875 20541.25
2
t Critical 2-tail 2.160368656
Interpretation: On the basis of table that reflect the overall gains in public sector which
were being obtained by men and women workers during the year 2009-2016. However, it can be
said that there is constant increment in the level of earning of men employees as it was 30638 in
2009 which increase to 34011 in 2016. However, the average income retention of the men
employees over these years is estimated as 32276.625. The variance of their earning capacity is
144962.27 which indicates that they have made the adequate earning throughout these years.
On the other side the women employees has earning capacity which is also has the
constant increment but not in that order as the men employees in this sector. In the year it was
25224 which has raised in the year 2016 as 28053. The average of their earning capacity is
26933.25 and variance was 977868.41. However, it will be improved and equal to the men
employees in the coming year as if the government will take necessary steps to facilitate the
employment opportunities to female workers. The difference between their earning is 13 and the
T statistics is 9.71. However, this reflect the positive outcomes as well as the business is
beneficial in terms of attaining the adequate gains and profitability. In terms with 1.27>0.05
which indicates that there is no such variations in their earning capacity.
B. Determination of the difference between earning capacity of women and men employees in
private sectors
Basis Men Public sector Women Private sector
2009 27632 19551
2010 2700 19532
2011 27233 19565
2012 27705 20313
2013 28201 20698
2014 28442 21017
2015 28881 21403
2016 29679 22251
Mean 28062.875 20541.25
2
Paraphrase This Document
Need a fresh take? Get an instant paraphrase of this document with our AI Paraphraser
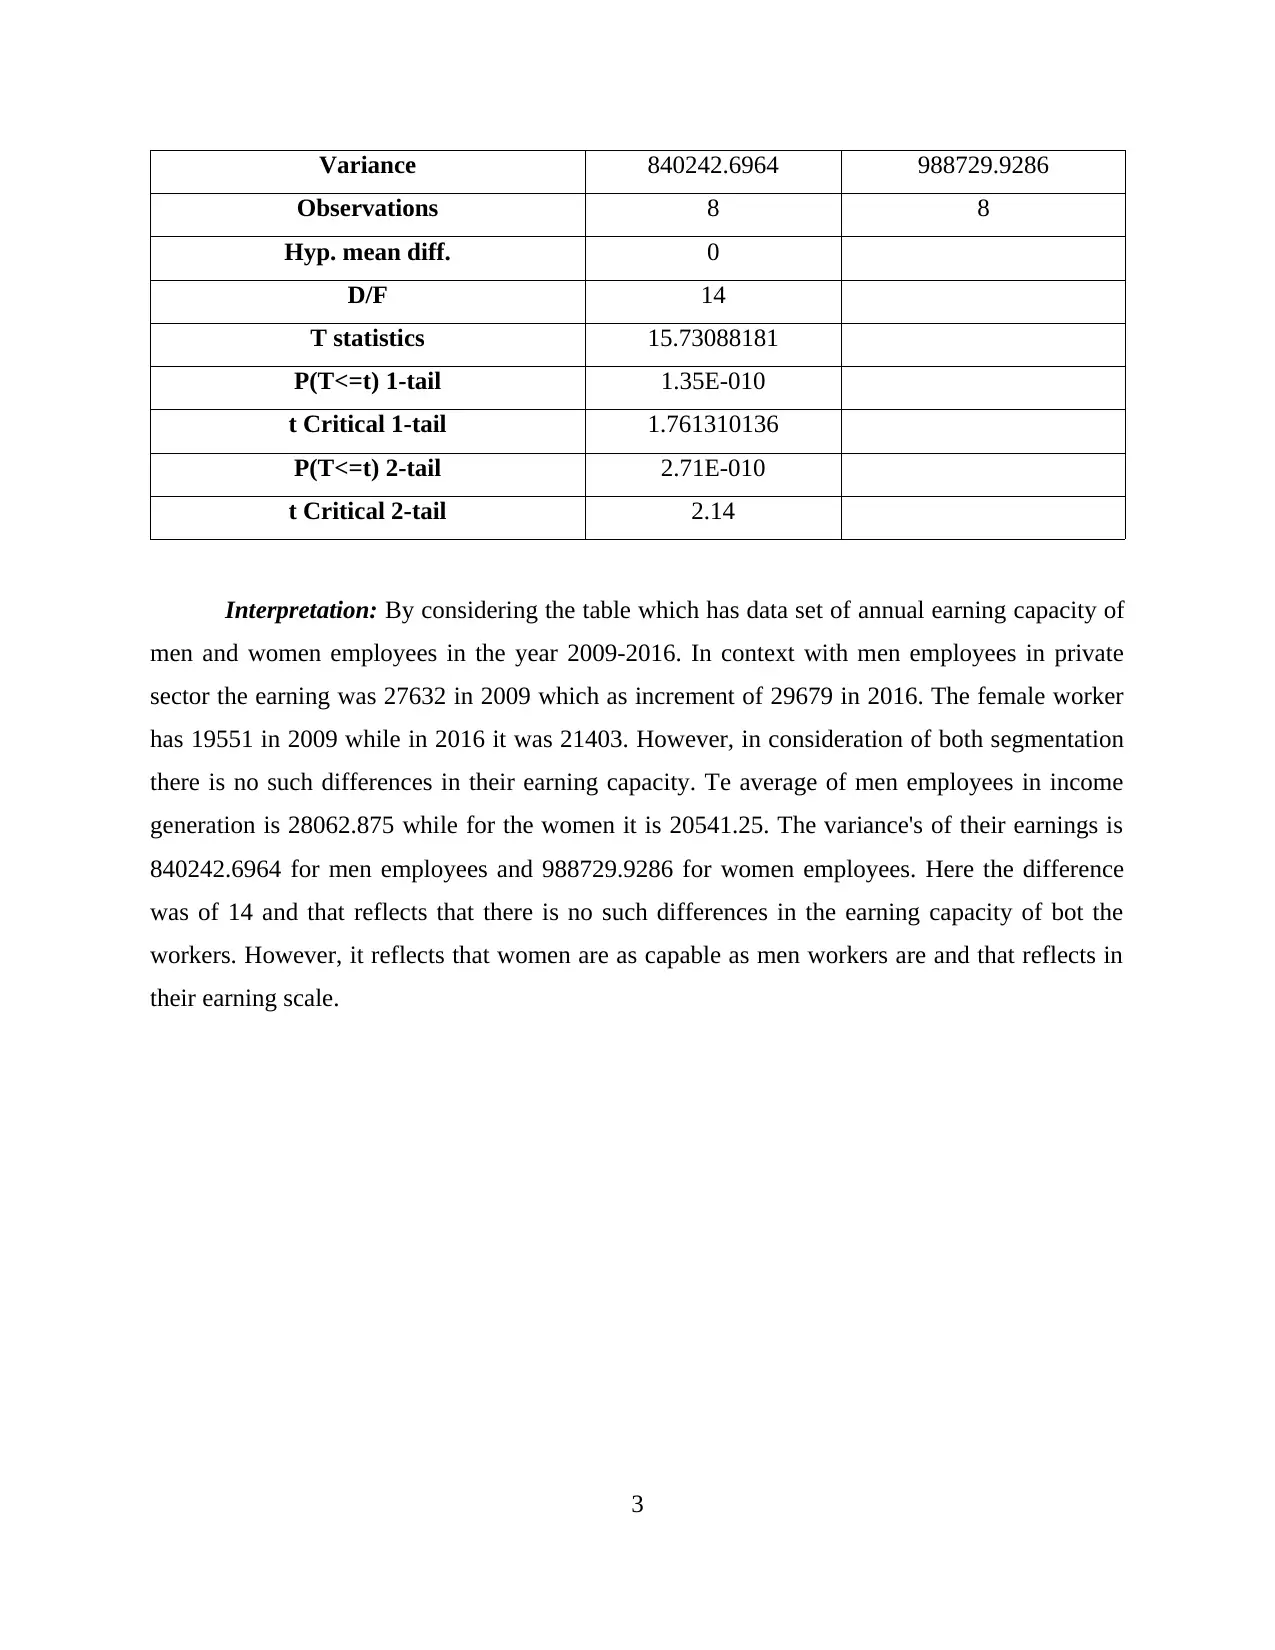
Variance 840242.6964 988729.9286
Observations 8 8
Hyp. mean diff. 0
D/F 14
T statistics 15.73088181
P(T<=t) 1-tail 1.35E-010
t Critical 1-tail 1.761310136
P(T<=t) 2-tail 2.71E-010
t Critical 2-tail 2.14
Interpretation: By considering the table which has data set of annual earning capacity of
men and women employees in the year 2009-2016. In context with men employees in private
sector the earning was 27632 in 2009 which as increment of 29679 in 2016. The female worker
has 19551 in 2009 while in 2016 it was 21403. However, in consideration of both segmentation
there is no such differences in their earning capacity. Te average of men employees in income
generation is 28062.875 while for the women it is 20541.25. The variance's of their earnings is
840242.6964 for men employees and 988729.9286 for women employees. Here the difference
was of 14 and that reflects that there is no such differences in the earning capacity of bot the
workers. However, it reflects that women are as capable as men workers are and that reflects in
their earning scale.
3
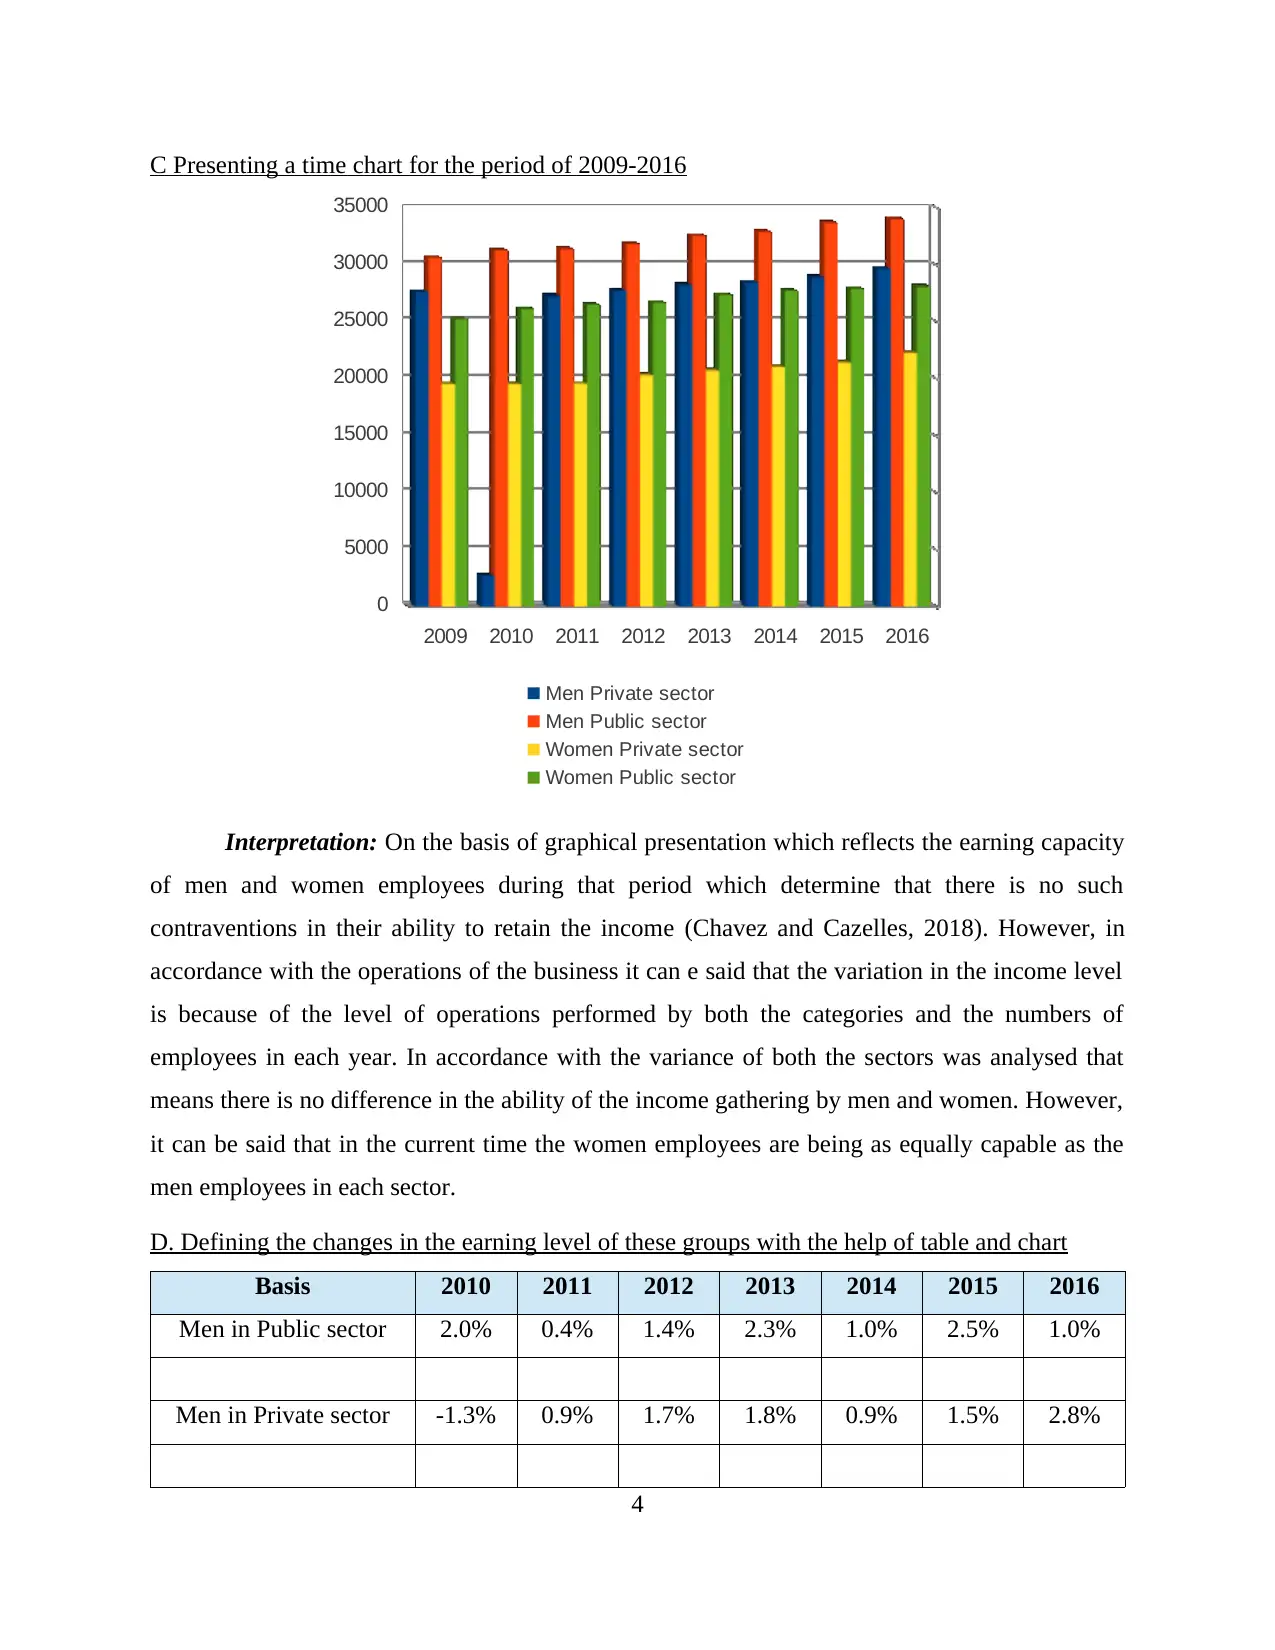
C Presenting a time chart for the period of 2009-2016
2009 2010 2011 2012 2013 2014 2015 2016
0
5000
10000
15000
20000
25000
30000
35000
Men Private sector
Men Public sector
Women Private sector
Women Public sector
Interpretation: On the basis of graphical presentation which reflects the earning capacity
of men and women employees during that period which determine that there is no such
contraventions in their ability to retain the income (Chavez and Cazelles, 2018). However, in
accordance with the operations of the business it can e said that the variation in the income level
is because of the level of operations performed by both the categories and the numbers of
employees in each year. In accordance with the variance of both the sectors was analysed that
means there is no difference in the ability of the income gathering by men and women. However,
it can be said that in the current time the women employees are being as equally capable as the
men employees in each sector.
D. Defining the changes in the earning level of these groups with the help of table and chart
Basis 2010 2011 2012 2013 2014 2015 2016
Men in Public sector 2.0% 0.4% 1.4% 2.3% 1.0% 2.5% 1.0%
Men in Private sector -1.3% 0.9% 1.7% 1.8% 0.9% 1.5% 2.8%
4
⊘ This is a preview!⊘
Do you want full access?
Subscribe today to unlock all pages.
Trusted by 1+ million students worldwide
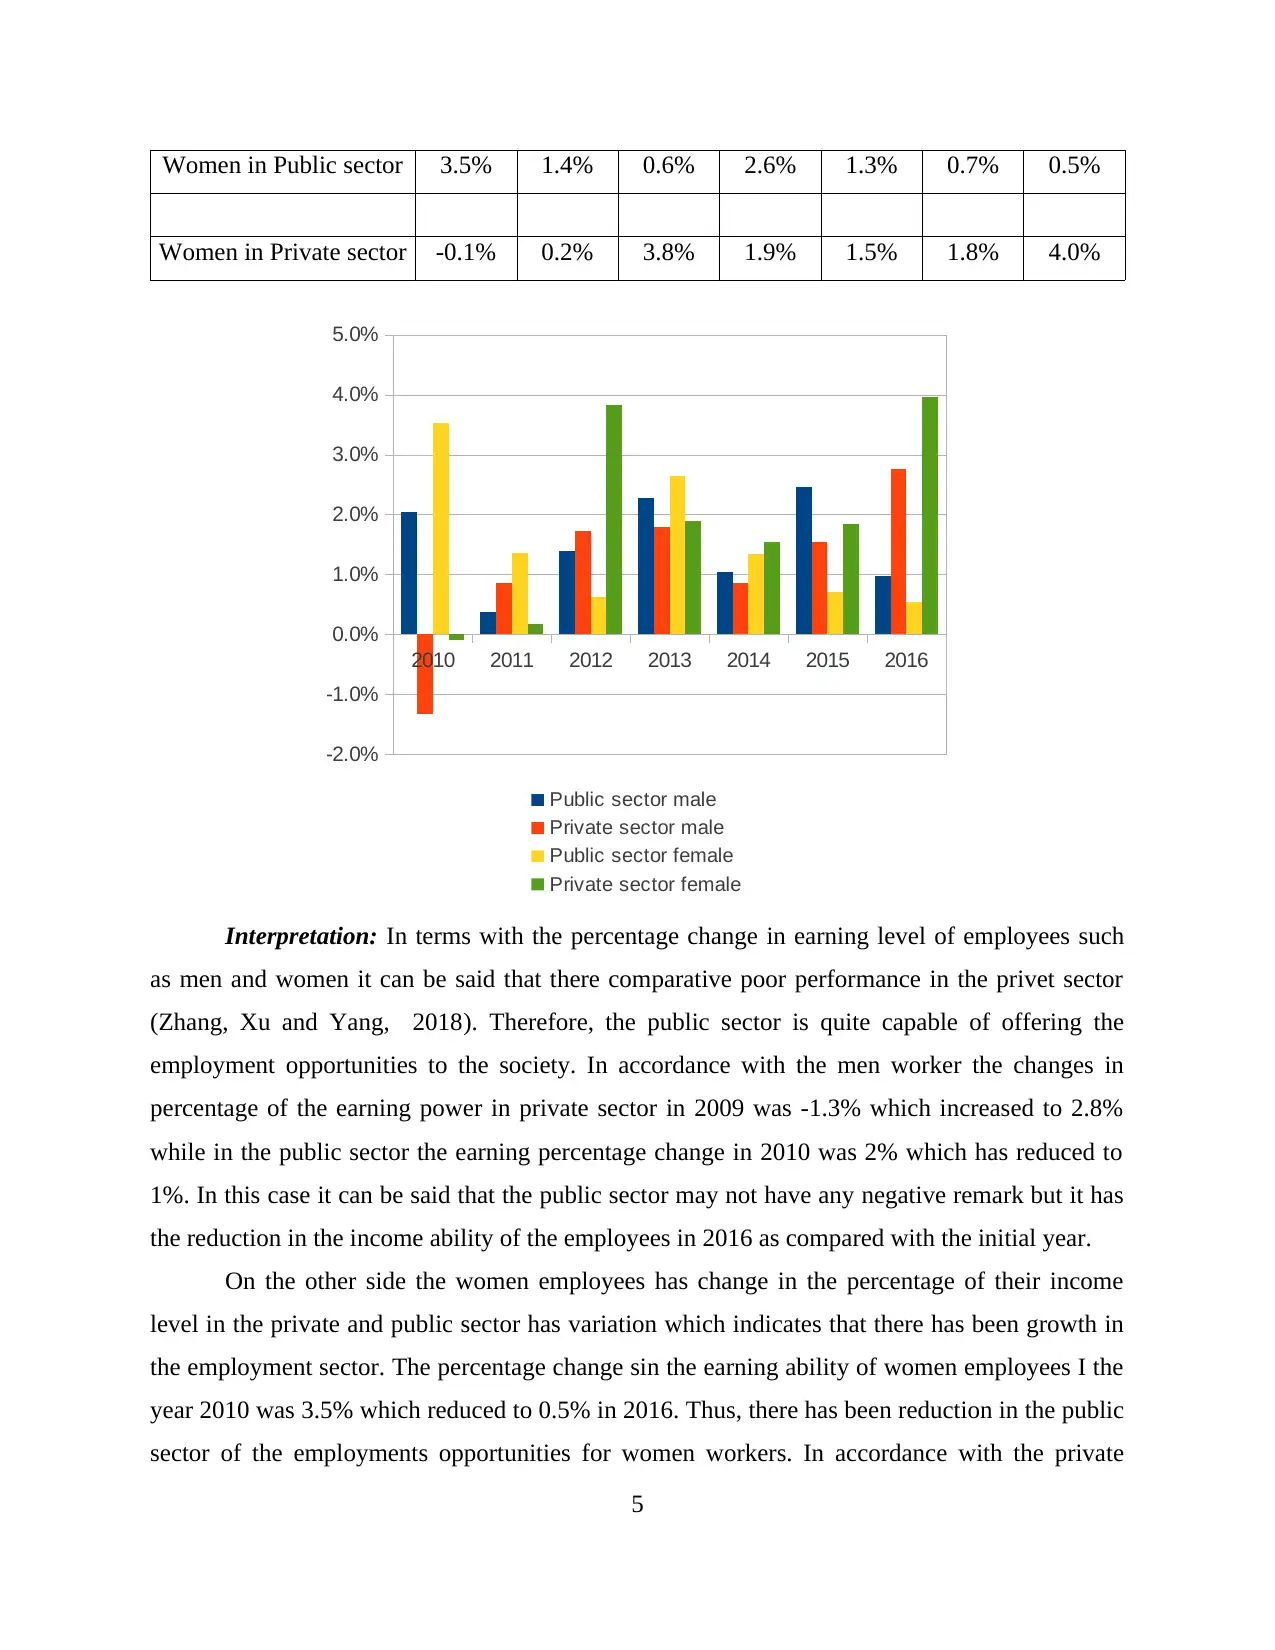
Women in Public sector 3.5% 1.4% 0.6% 2.6% 1.3% 0.7% 0.5%
Women in Private sector -0.1% 0.2% 3.8% 1.9% 1.5% 1.8% 4.0%
2010 2011 2012 2013 2014 2015 2016
-2.0%
-1.0%
0.0%
1.0%
2.0%
3.0%
4.0%
5.0%
Public sector male
Private sector male
Public sector female
Private sector female
Interpretation: In terms with the percentage change in earning level of employees such
as men and women it can be said that there comparative poor performance in the privet sector
(Zhang, Xu and Yang, 2018). Therefore, the public sector is quite capable of offering the
employment opportunities to the society. In accordance with the men worker the changes in
percentage of the earning power in private sector in 2009 was -1.3% which increased to 2.8%
while in the public sector the earning percentage change in 2010 was 2% which has reduced to
1%. In this case it can be said that the public sector may not have any negative remark but it has
the reduction in the income ability of the employees in 2016 as compared with the initial year.
On the other side the women employees has change in the percentage of their income
level in the private and public sector has variation which indicates that there has been growth in
the employment sector. The percentage change sin the earning ability of women employees I the
year 2010 was 3.5% which reduced to 0.5% in 2016. Thus, there has been reduction in the public
sector of the employments opportunities for women workers. In accordance with the private
5
Paraphrase This Document
Need a fresh take? Get an instant paraphrase of this document with our AI Paraphraser
sector the earning percentage in 2010 was -0.1% which has huge increment in 2016 as 4%. Thus,
it can be said that, private sector is more attractive from the workers and they are making
satisfactory level of wealth creation to the society. In accordance with the private and public
sector the public sector has constant increment while privation sector is more fluctuating as it
some time reflect the negative outcomes while some times it presents the favourable results.
TASK 2
Section 1
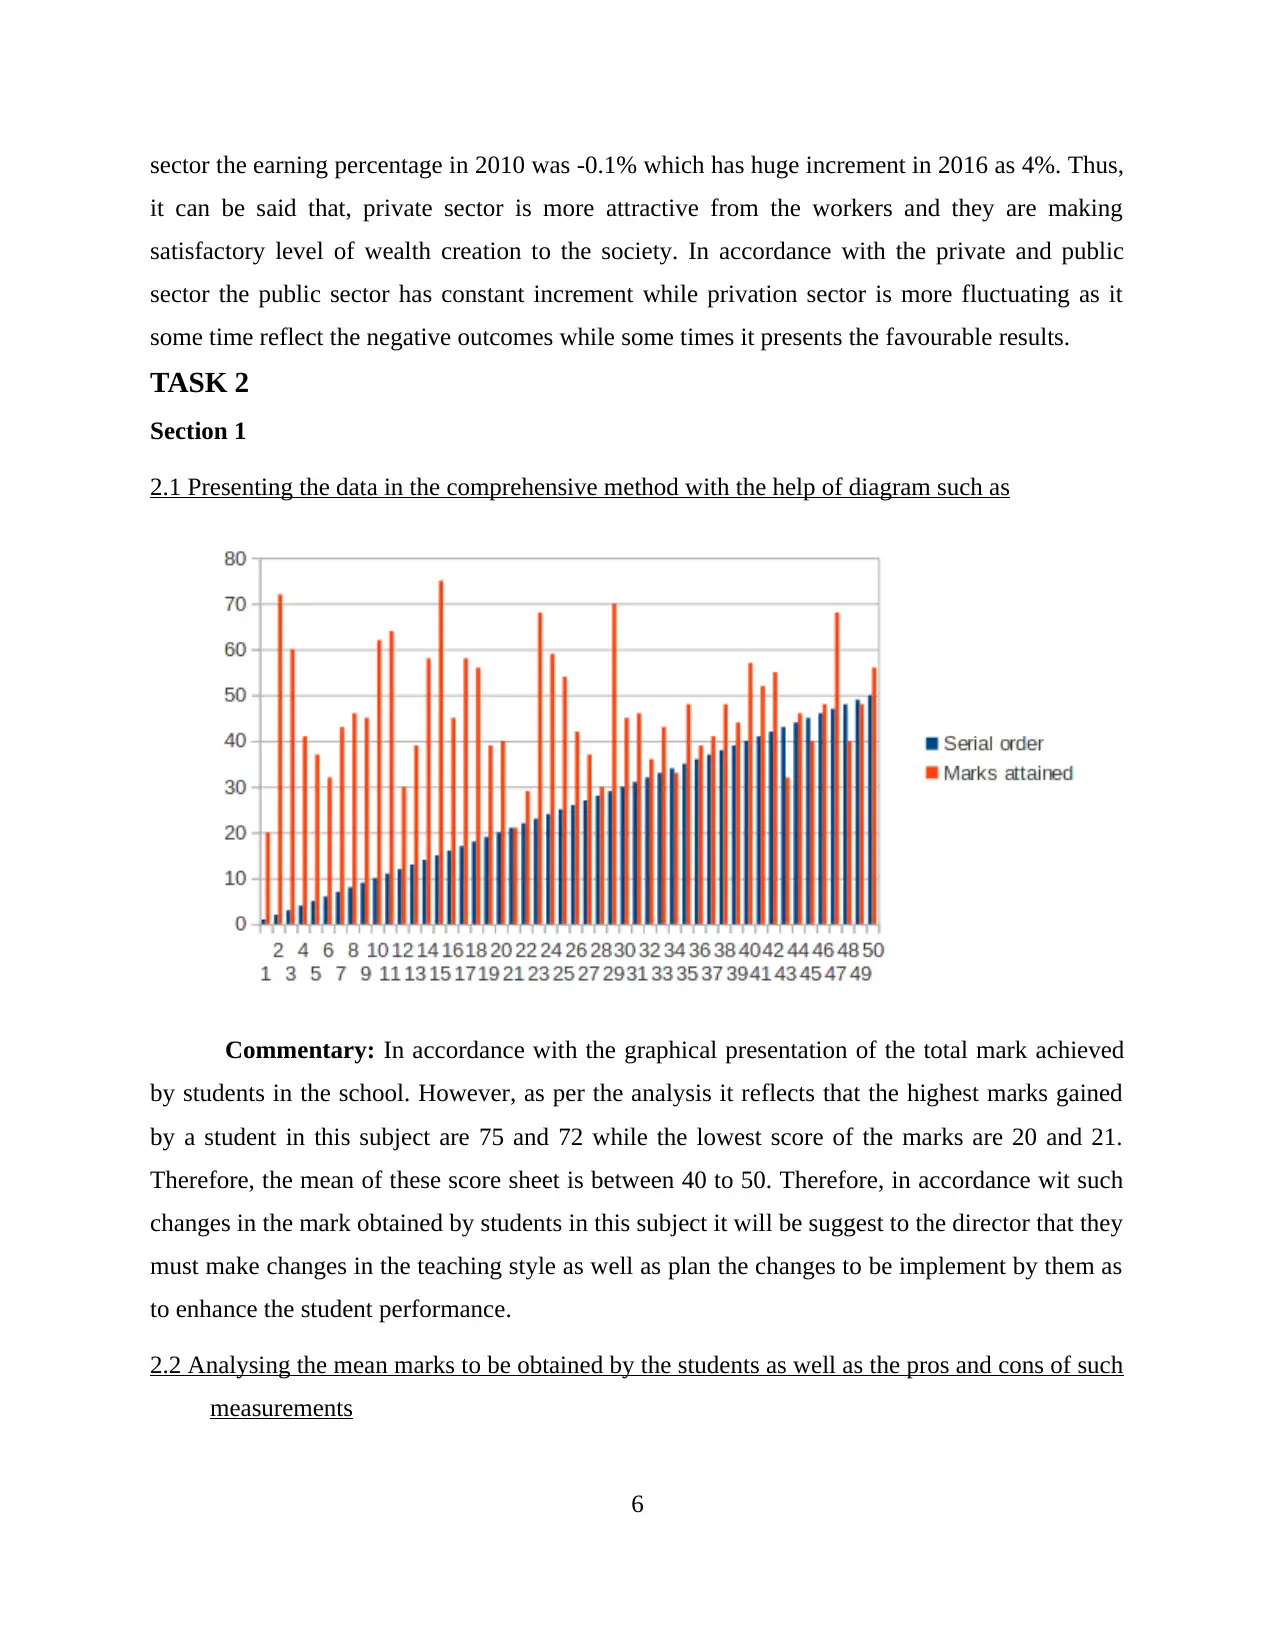
2.1 Presenting the data in the comprehensive method with the help of diagram such as
Commentary: In accordance with the graphical presentation of the total mark achieved
by students in the school. However, as per the analysis it reflects that the highest marks gained
by a student in this subject are 75 and 72 while the lowest score of the marks are 20 and 21.
Therefore, the mean of these score sheet is between 40 to 50. Therefore, in accordance wit such
changes in the mark obtained by students in this subject it will be suggest to the director that they
must make changes in the teaching style as well as plan the changes to be implement by them as
to enhance the student performance.
2.2 Analysing the mean marks to be obtained by the students as well as the pros and cons of such
measurements
6
it can be said that, private sector is more attractive from the workers and they are making
satisfactory level of wealth creation to the society. In accordance with the private and public
sector the public sector has constant increment while privation sector is more fluctuating as it
some time reflect the negative outcomes while some times it presents the favourable results.
TASK 2
Section 1
2.1 Presenting the data in the comprehensive method with the help of diagram such as
Commentary: In accordance with the graphical presentation of the total mark achieved
by students in the school. However, as per the analysis it reflects that the highest marks gained
by a student in this subject are 75 and 72 while the lowest score of the marks are 20 and 21.
Therefore, the mean of these score sheet is between 40 to 50. Therefore, in accordance wit such
changes in the mark obtained by students in this subject it will be suggest to the director that they
must make changes in the teaching style as well as plan the changes to be implement by them as
to enhance the student performance.
2.2 Analysing the mean marks to be obtained by the students as well as the pros and cons of such
measurements
6
7
⊘ This is a preview!⊘
Do you want full access?
Subscribe today to unlock all pages.
Trusted by 1+ million students worldwide
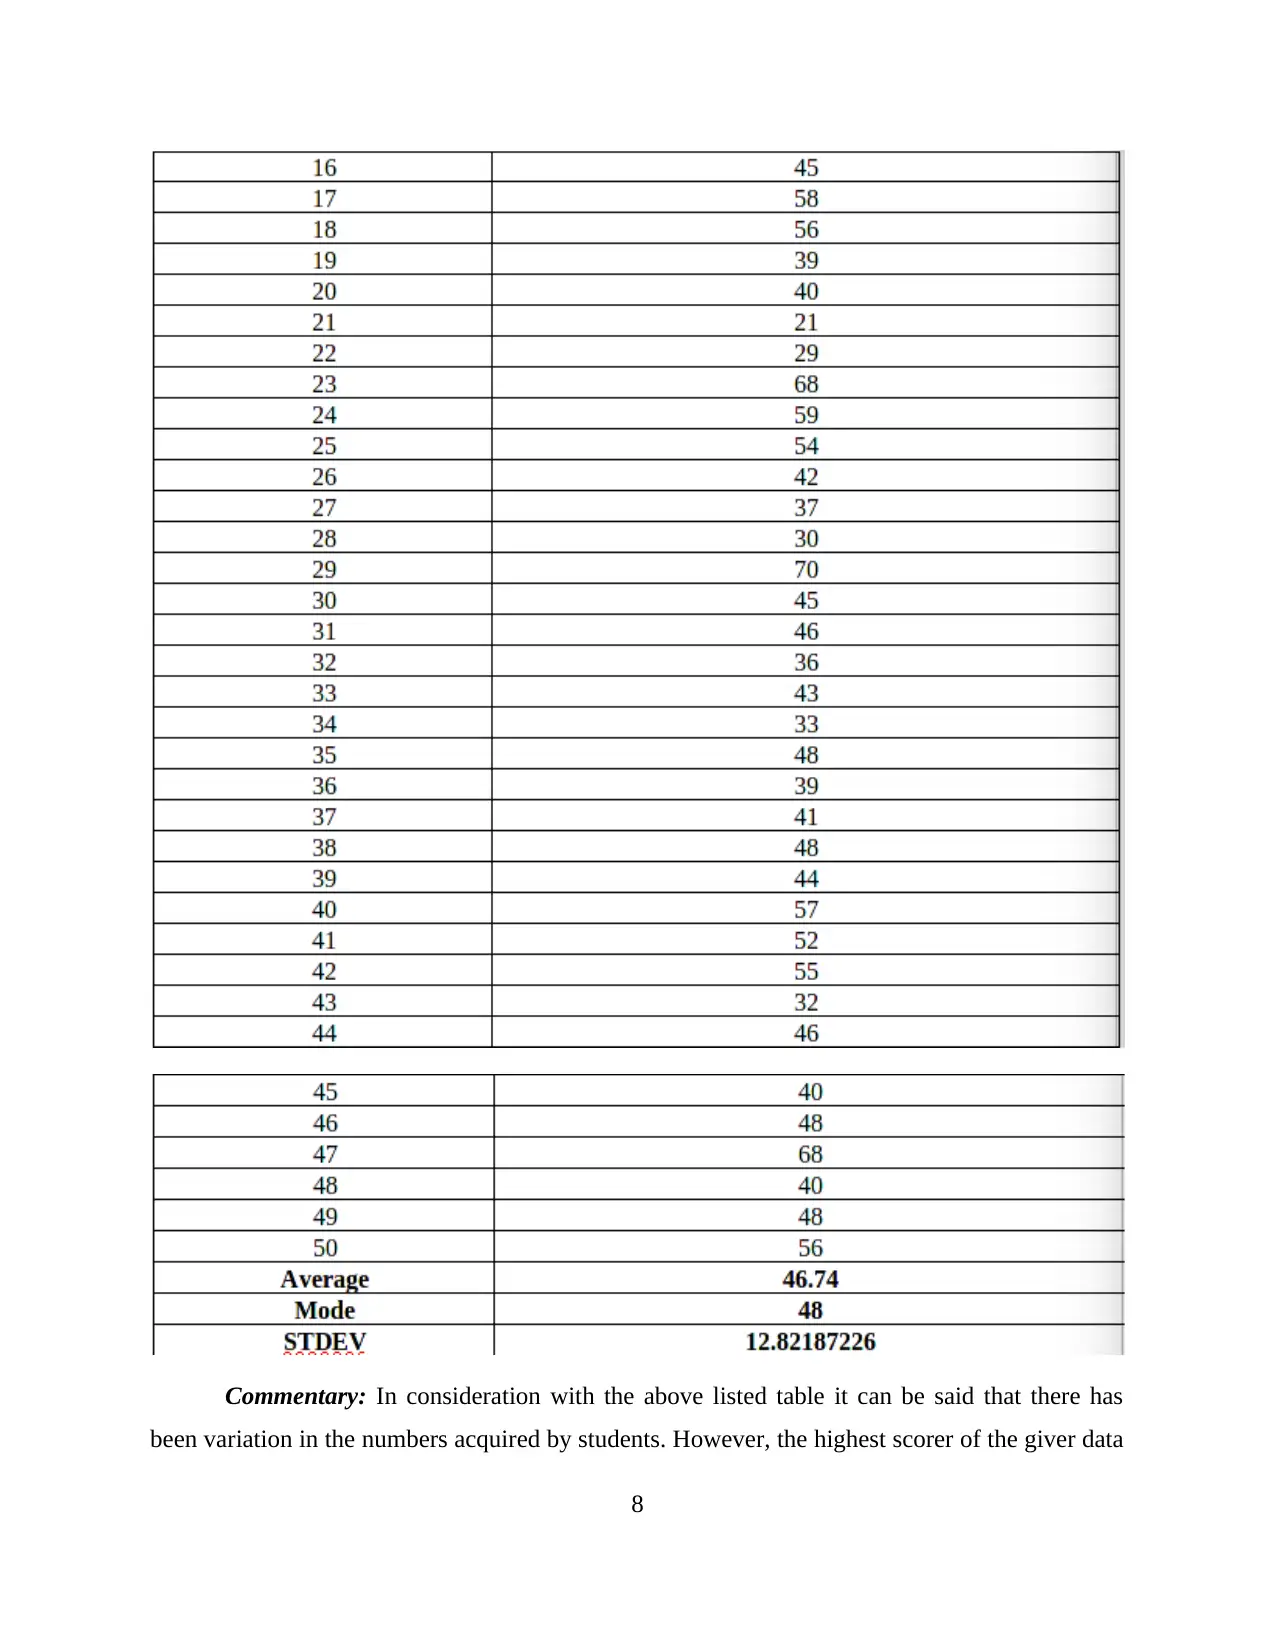
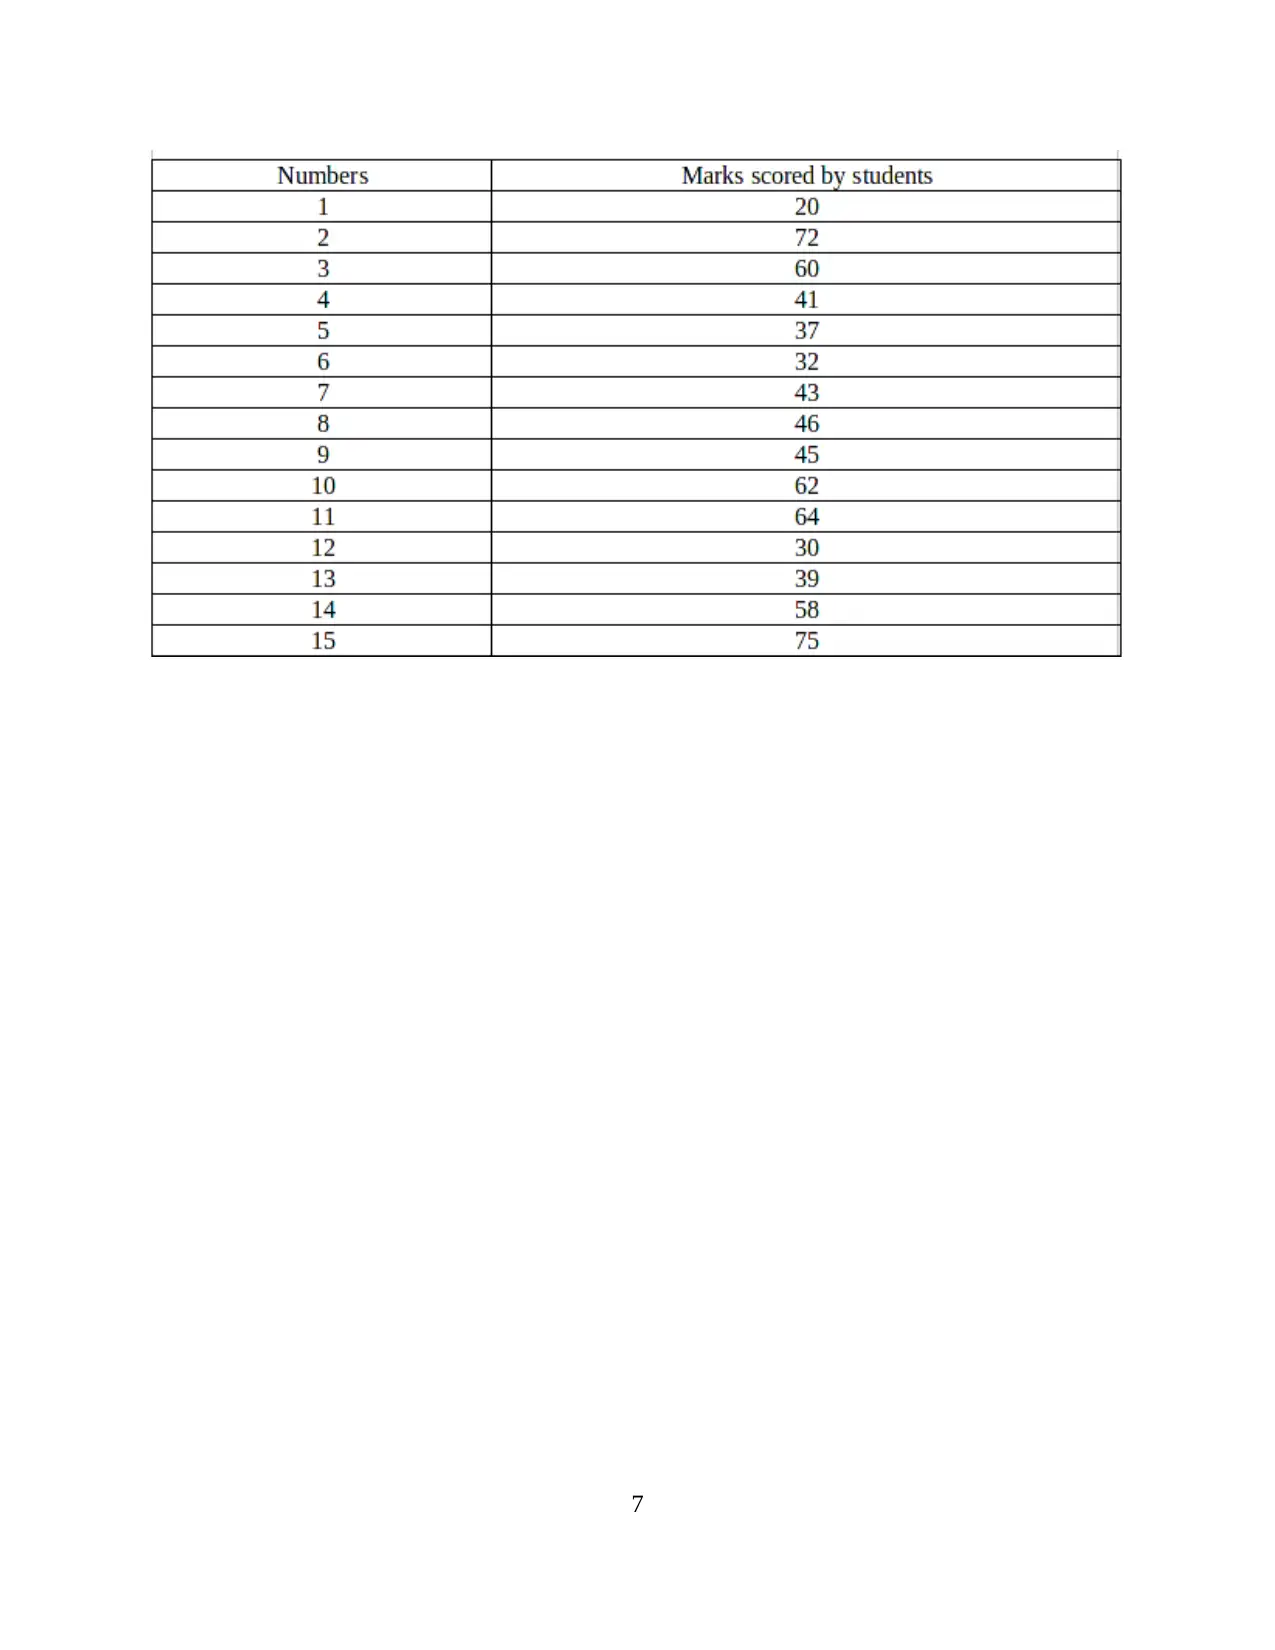
Commentary: In consideration with the above listed table it can be said that there has
been variation in the numbers acquired by students. However, the highest scorer of the giver data
8
been variation in the numbers acquired by students. However, the highest scorer of the giver data
8
Paraphrase This Document
Need a fresh take? Get an instant paraphrase of this document with our AI Paraphraser
set is with 75 or the marks in the business course while the low scorer has gain 20 marks over
this subject. The average of such data set has been analysed as 46.74 which good and favourable
as it reflects that the maximum numbers of students has gained more than 45 marks. The mode of
data set bis 48 and standard deviation is being analysed as 12.82.
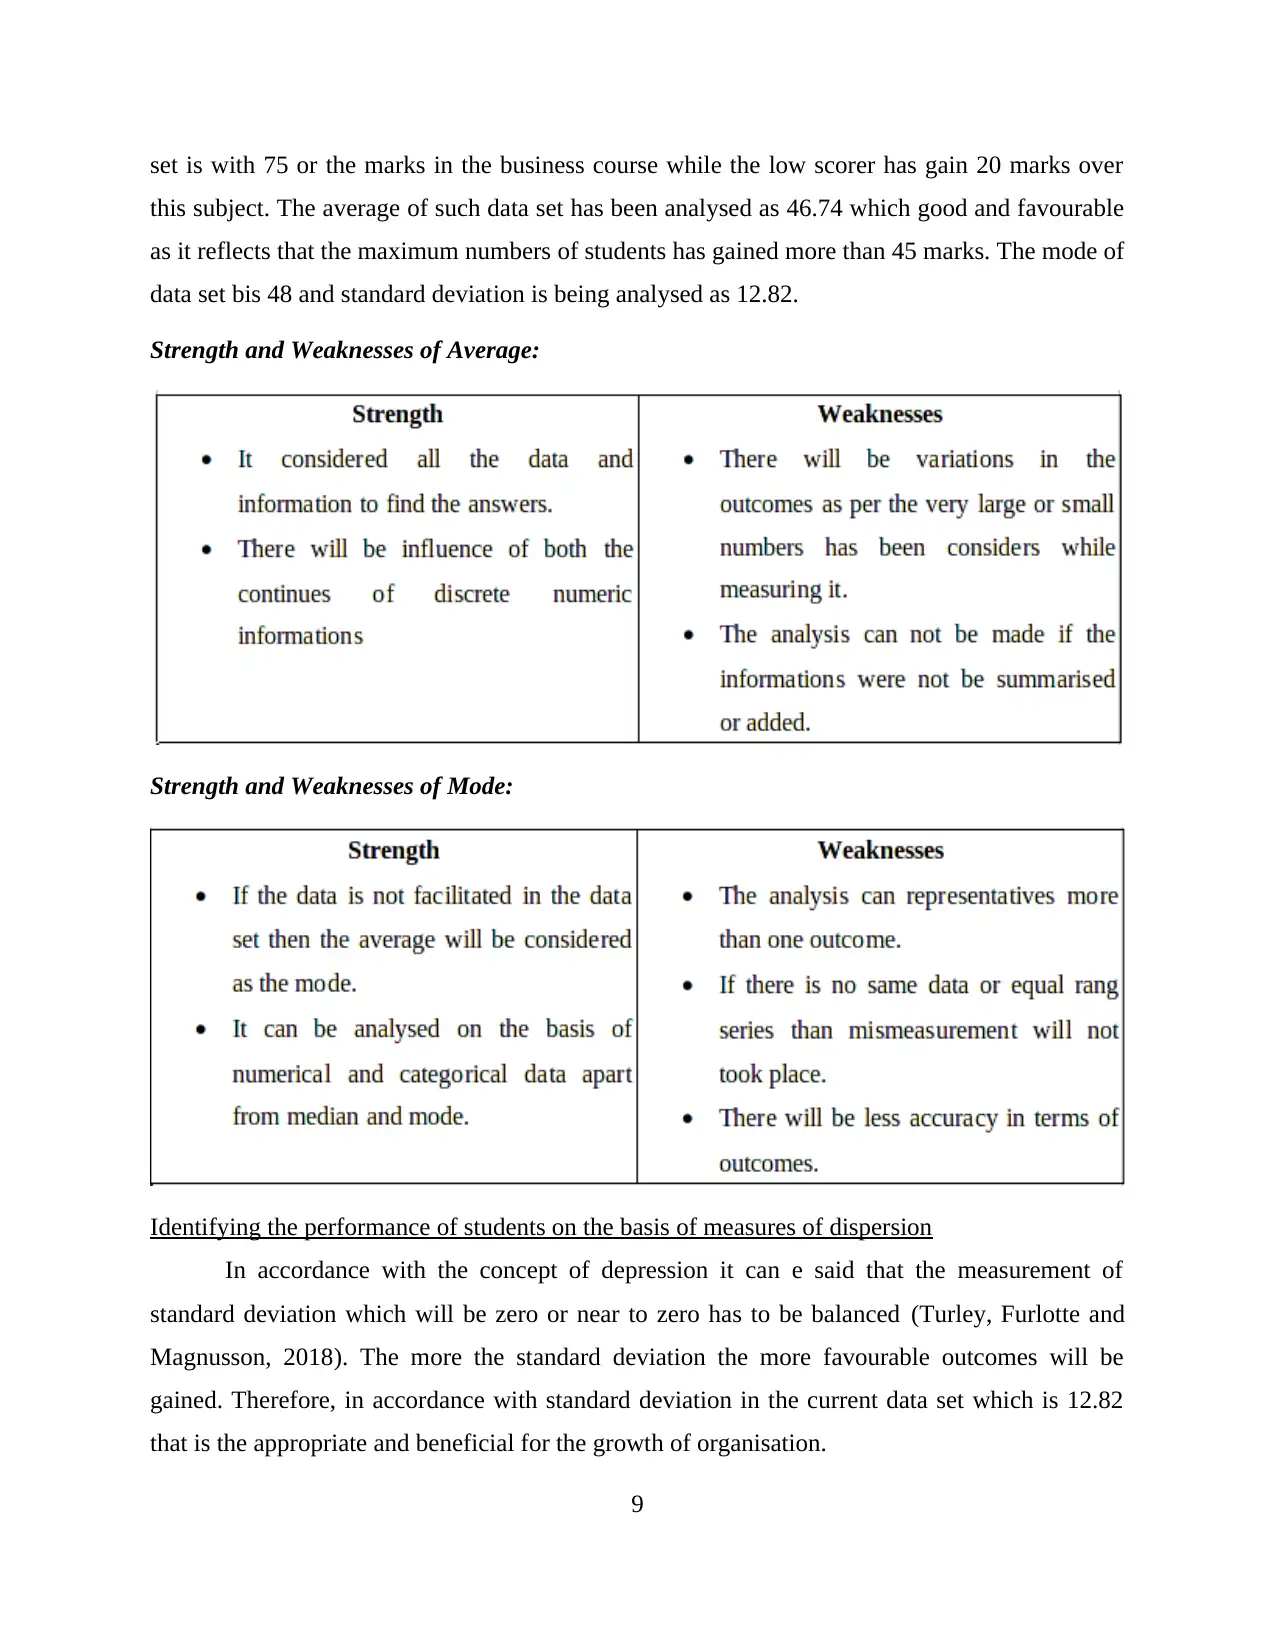
Strength and Weaknesses of Average:
Strength and Weaknesses of Mode:
Identifying the performance of students on the basis of measures of dispersion
In accordance with the concept of depression it can e said that the measurement of
standard deviation which will be zero or near to zero has to be balanced (Turley, Furlotte and
Magnusson, 2018). The more the standard deviation the more favourable outcomes will be
gained. Therefore, in accordance with standard deviation in the current data set which is 12.82
that is the appropriate and beneficial for the growth of organisation.
9
this subject. The average of such data set has been analysed as 46.74 which good and favourable
as it reflects that the maximum numbers of students has gained more than 45 marks. The mode of
data set bis 48 and standard deviation is being analysed as 12.82.
Strength and Weaknesses of Average:
Strength and Weaknesses of Mode:
Identifying the performance of students on the basis of measures of dispersion
In accordance with the concept of depression it can e said that the measurement of
standard deviation which will be zero or near to zero has to be balanced (Turley, Furlotte and
Magnusson, 2018). The more the standard deviation the more favourable outcomes will be
gained. Therefore, in accordance with standard deviation in the current data set which is 12.82
that is the appropriate and beneficial for the growth of organisation.
9
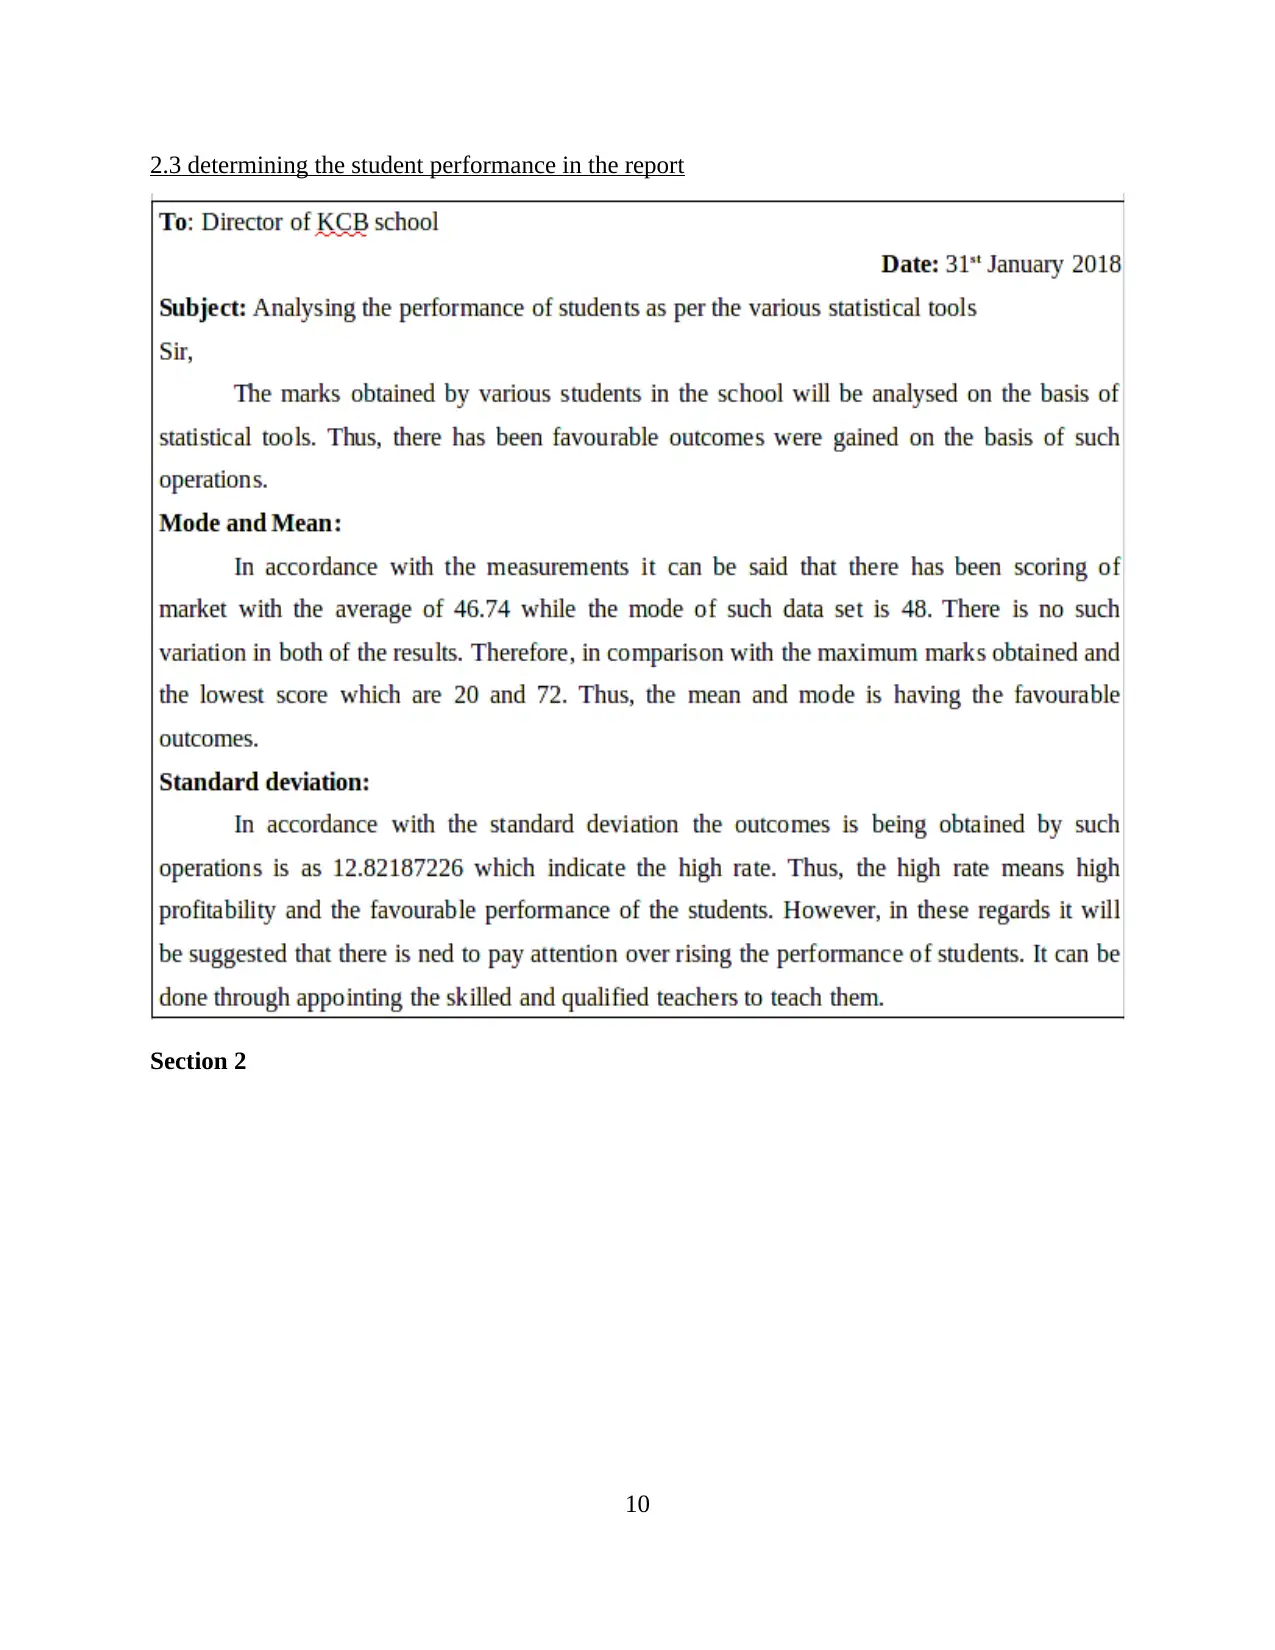
2.3 determining the student performance in the report
Section 2
10
Section 2
10
⊘ This is a preview!⊘
Do you want full access?
Subscribe today to unlock all pages.
Trusted by 1+ million students worldwide
1 out of 20
Related Documents


Your All-in-One AI-Powered Toolkit for Academic Success.
+13062052269
info@desklib.com
Available 24*7 on WhatsApp / Email
![[object Object]](/_next/static/media/star-bottom.7253800d.svg)
Unlock your academic potential
Copyright © 2020–2026 A2Z Services. All Rights Reserved. Developed and managed by ZUCOL.