Statistical Analysis of Business and Economic Data - Report
VerifiedAdded on 2020/10/04
|18
|4321
|105
Report
AI Summary
This report presents a statistical analysis of business and economic data, focusing on consumer price index (CPI) and retail price index (RPI). It includes an overview of data nature and processes, evaluation of data using different analysis methods, and differences between CPI, CPIH, and RPI. The report analyzes qualitative and quantitative data, applying statistical methods like scatter diagrams and correlation coefficients to assess relationships between variables such as temperature and hot drink sales. The report also delves into the use of statistical methods for planning quality, inventory, and capacity management, along with graphical and tabular representations of data, justifying the use of these representations, and providing recommendations based on the analysis. The report concludes with a discussion of the significance of statistical analysis in business management and decision-making.

STATISTICS FOR
MANAGEMENT
MANAGEMENT
Paraphrase This Document
Need a fresh take? Get an instant paraphrase of this document with our AI Paraphraser
Table of Contents
INTRODUCTION...........................................................................................................................1
ACTIVITY 1....................................................................................................................................1
P1 Nature and process of business and economic data information......................................1
P2 Evaluation of data form different analysis methods..........................................................1
M1 Evaluation of sources other than the NSO with regard to the gender pay gap................5
ACTIVITY 2....................................................................................................................................6
P3 Analysis of qualitative and quantitative data form raw business with statistical methods6
M2 Differences in statistical application in activity 2..........................................................10
D1 Difference between descriptive, exploratory and confirmatory analysis with examples 10
ACTIVITY 3..................................................................................................................................10
P4 Use of range of statistical methods used in planning for quality, inventory and capacity
management..........................................................................................................................10
M3 the use of the statistical methods used in activity 3.......................................................12
D2 Recommendation and judgements made in activity 3....................................................12
ACTIVITY 4..................................................................................................................................12
P5 Charts and tables on the basis of office of national statistics produce line.....................12
M4 Justification regarding graphical representations used in activity 1 and 2....................15
D3 Use of graphical and tabular representations used in 1 and 2 activities.........................15
CONCLUSION..............................................................................................................................16
REFERENCES..............................................................................................................................17
INTRODUCTION
Statistical analysis is a type of analysis that represents the information and data in
graphical and numeric form. Various type of statistical tools and methods are used for efficient
management and operation (Embrechts and Hofert, 2014). The report contains the report related
to statistical analysis of national statistics of consumer price index and retail price index. Nature
and process of business and economic data are presented on the basis of the above sources.
Qualitative and quantitative analysis of raw business data form range of appropriate statistical
methods are defined in this report. Charts and tables are presented regarding appropriate results
and numbers and variables.
ACTIVITY 1
P1 Nature and process of business and economic data information
Consumer Price Indices
The CPI is utilized by market analysts, organizations, government and huge business
houses. This index estimates the value changes in some authoritative accumulation of products
and services bought by clients with an efficient result. Essentially this estimates the adjustment
in the normal products and ventures which is devoured by customers (Haimes, 2015). The
customary products and enterprises like family merchandise, basic needs, transportation,
therapeutic and so on. With the assistance of this it measures the typical cost for basic items and
expansion. The business analyst utilizes CPI to ascertain value change in bread, drain and other
essential products to see whether is there any adjustment in acquiring power or not. As
dependent on this discovering business analyst exhort on expansionary and contractionary
financial arrangement to address the adjustments in costs. The purchaser value list is a vital
apparatus for government and organizations as it is useful in the estimating swelling and
emptying. What's more, than as indicated by changes the administration decide.
P2 Evaluation of data form different analysis methods
CPI
Year CPI
2007 104.7
2008 108.4833
2009 110.8333
2010 114.475
1
⊘ This is a preview!⊘
Do you want full access?
Subscribe today to unlock all pages.
Trusted by 1+ million students worldwide
2011 119.6083
2012 123.7417
2013 126.125
2014 127.9667
2015 128.025
2016 128.875
2017 132.3
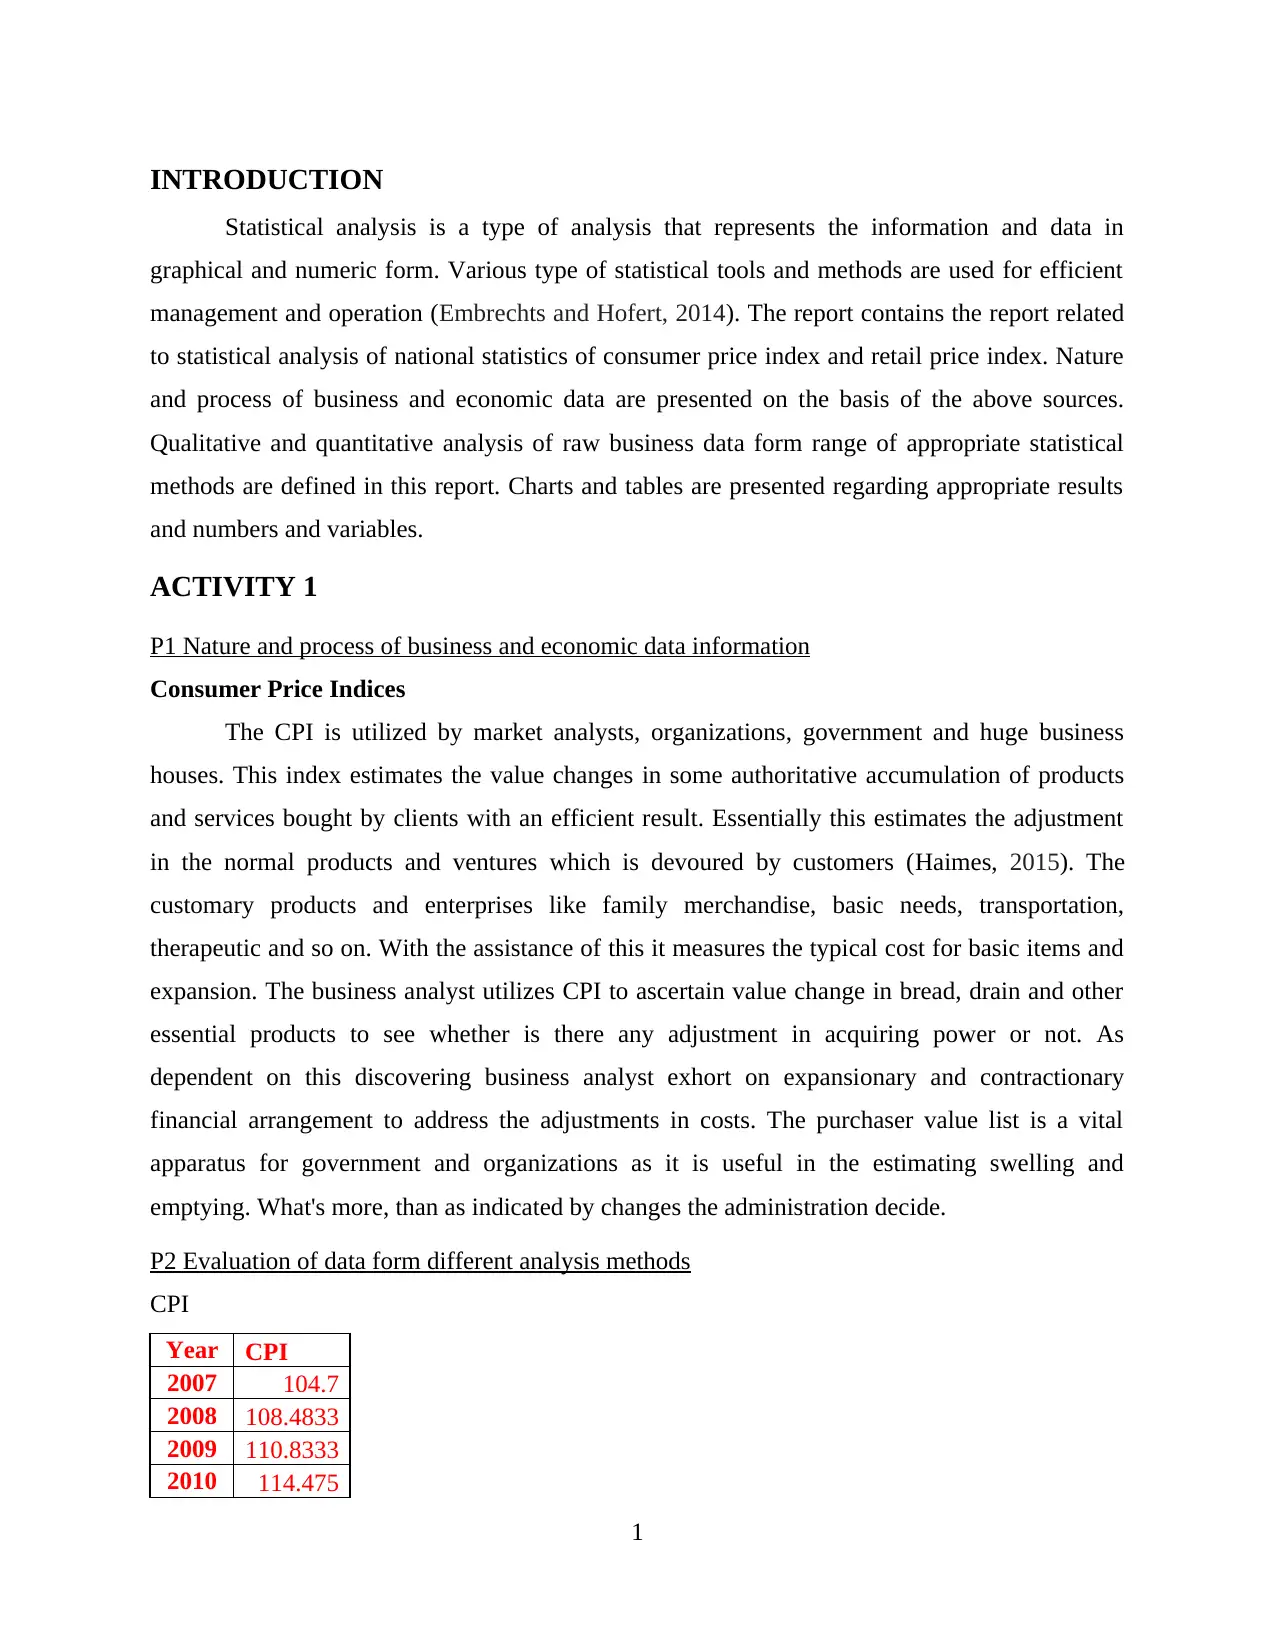
As per the above mentioned table of CPI presents the data of consumer price index from
2007 to 2017. there is a separate variations and counts are taken form office national statistics. It
is seen that price index increased regularly with the significant rate of 3.5% (approximate). There
is a scattered diagram is presented in terms of defining the plotted areas and fluctuation points
below.
According to the above chart, the line showing on it is growing more steadily from the
year 2007 to 2017. This would results in the overall growth and development of the customer
perception. It is an essential measure that can examines the weighted average price of a basket of
consumer products. This will results in overall growth of the nation as well as development of
the economy.
RPI
Retail Price Index is recognised to list the distinctive costs and salaries which
incorporates the benefits provided form government, pension and allowances (Wheeler and
Barr, 2013). It presents position of costs of living index in respect of changing the rate of
2
2012 123.7417
2013 126.125
2014 127.9667
2015 128.025
2016 128.875
2017 132.3
As per the above mentioned table of CPI presents the data of consumer price index from
2007 to 2017. there is a separate variations and counts are taken form office national statistics. It
is seen that price index increased regularly with the significant rate of 3.5% (approximate). There
is a scattered diagram is presented in terms of defining the plotted areas and fluctuation points
below.
According to the above chart, the line showing on it is growing more steadily from the
year 2007 to 2017. This would results in the overall growth and development of the customer
perception. It is an essential measure that can examines the weighted average price of a basket of
consumer products. This will results in overall growth of the nation as well as development of
the economy.
RPI
Retail Price Index is recognised to list the distinctive costs and salaries which
incorporates the benefits provided form government, pension and allowances (Wheeler and
Barr, 2013). It presents position of costs of living index in respect of changing the rate of
2
Paraphrase This Document
Need a fresh take? Get an instant paraphrase of this document with our AI Paraphraser
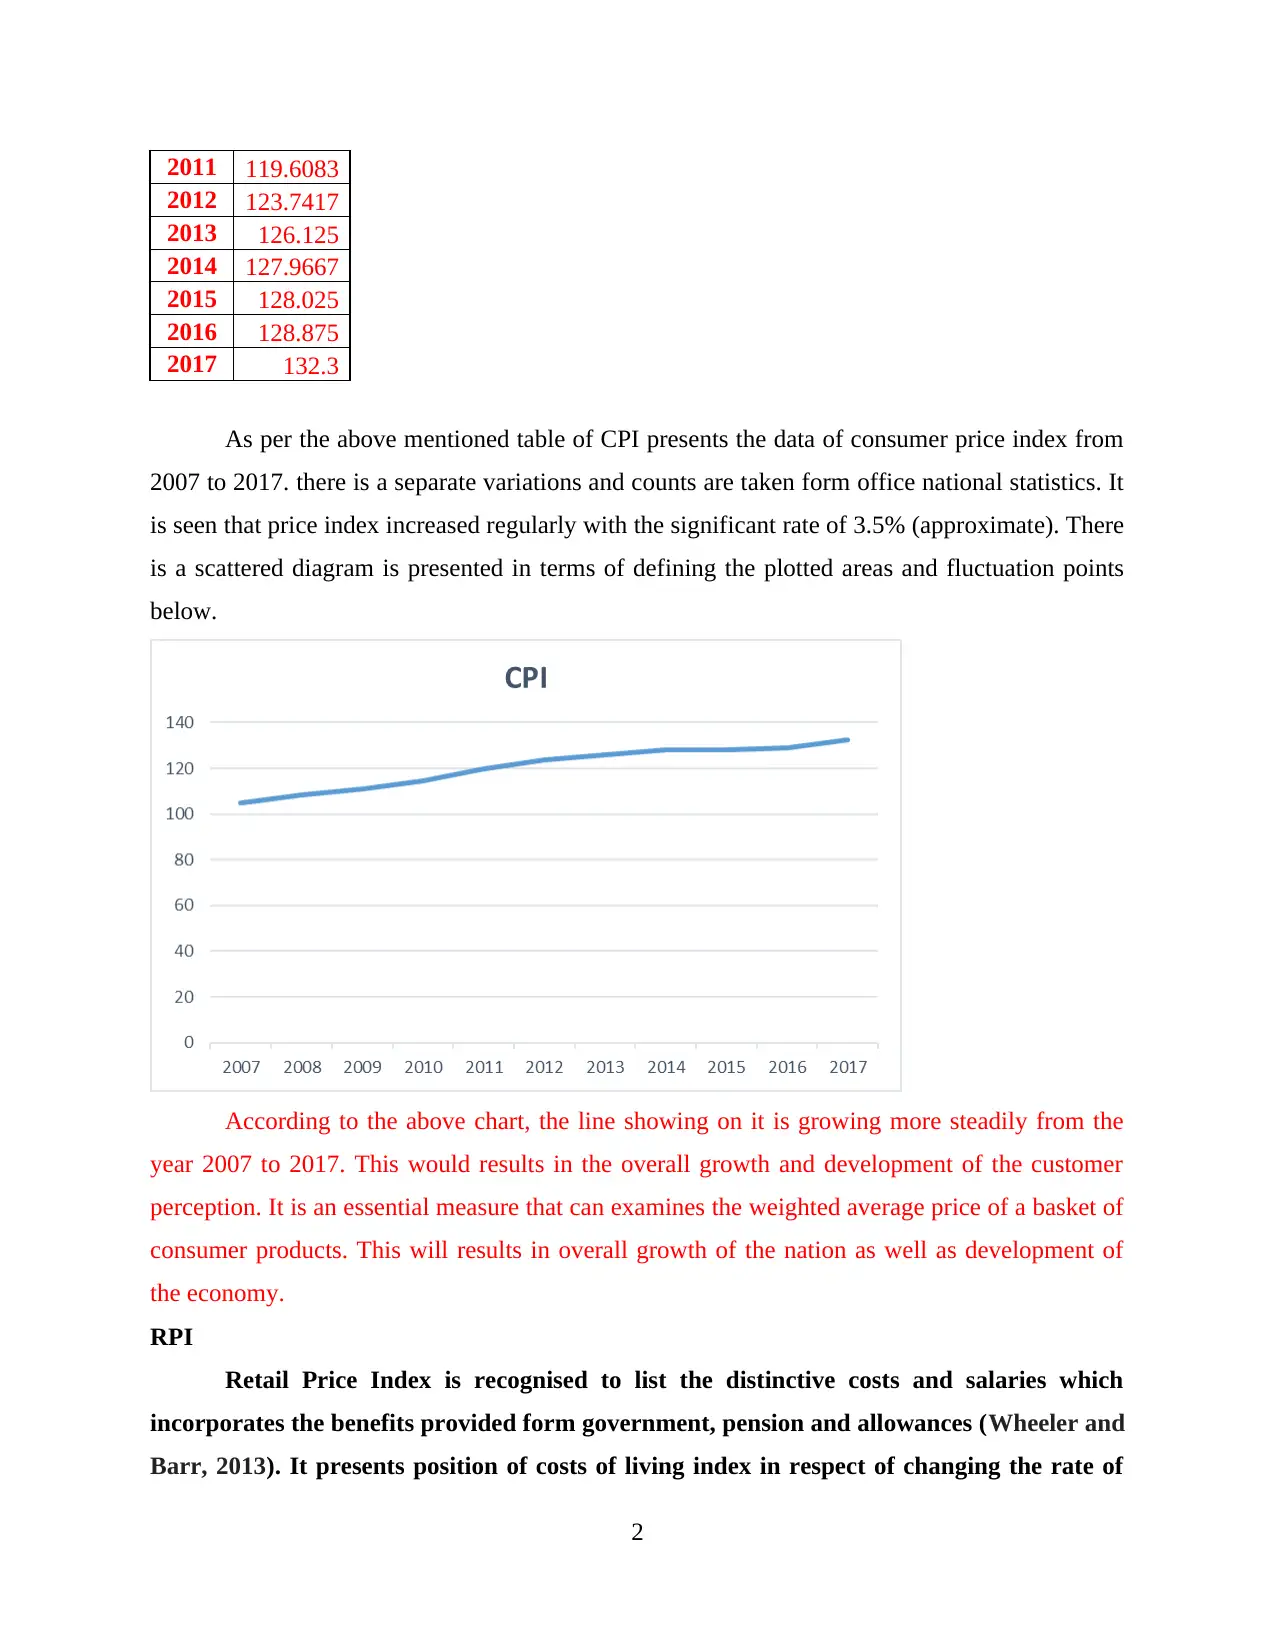
goods and services. which demonstrates how much the average cost for basic items changes
from month to month. These are distributed on the basis of per month.
Year RPI
2007 206.55
2008 214.825
2009 213.683
2010 223.558
2011 235.183
2012 242.725
2013 249.958
2014 256.033
2015 258.542
2016 263.05
2017 272.475
From the above chat, it has been seen that the RPI line in increase at constant rate on an
average rate of 7.2% (approx.) in every year. This calculation is essential because the raw
etriculocyte count is misleading in RPI index rate. This will be valuable growth of increment for
the nation which would be more sutiable for the overall development of the economy.
c) Differences between these indices
CPI CPIH RPI
Consumer Price Index is a weighted
average value of consumer goods
It refers to Consumer It is a record of retail price
3
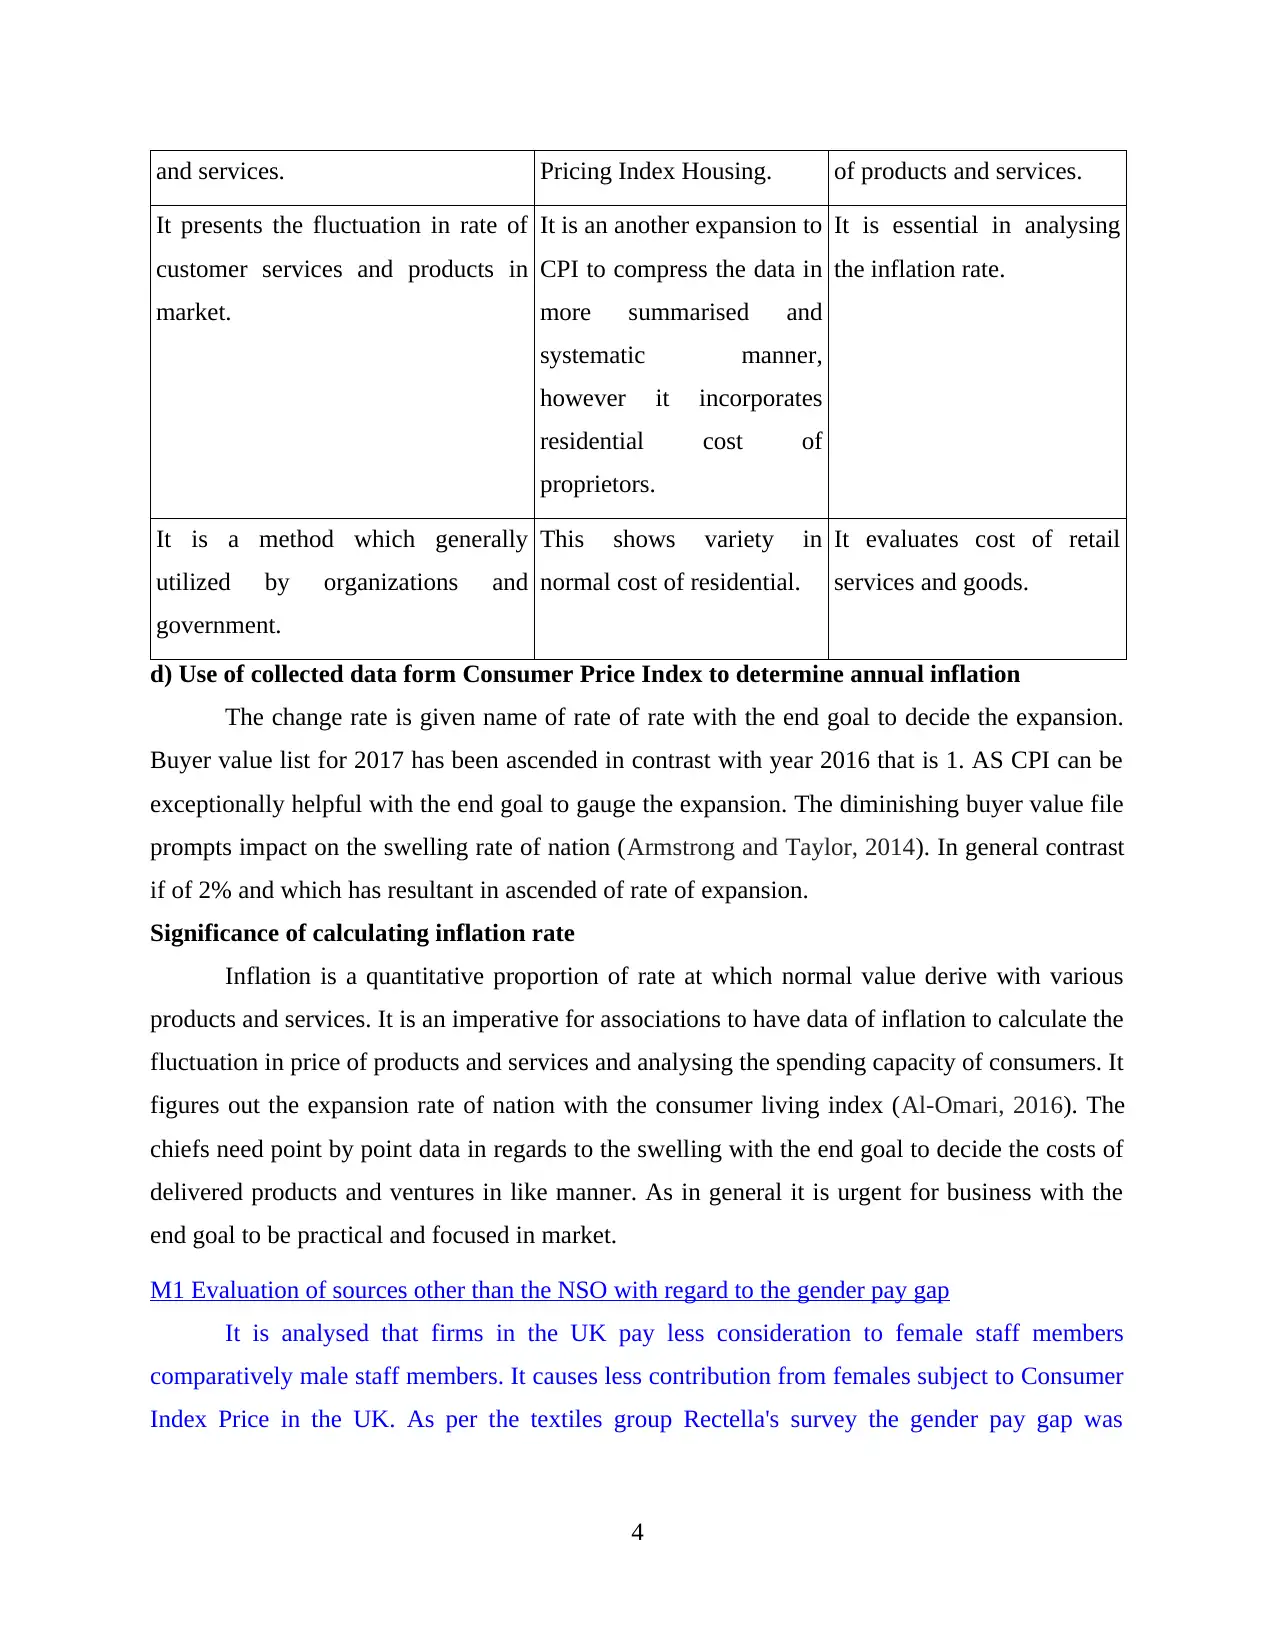
and services. Pricing Index Housing. of products and services.
It presents the fluctuation in rate of
customer services and products in
market.
It is an another expansion to
CPI to compress the data in
more summarised and
systematic manner,
however it incorporates
residential cost of
proprietors.
It is essential in analysing
the inflation rate.
It is a method which generally
utilized by organizations and
government.
This shows variety in
normal cost of residential.
It evaluates cost of retail
services and goods.
d) Use of collected data form Consumer Price Index to determine annual inflation
The change rate is given name of rate of rate with the end goal to decide the expansion.
Buyer value list for 2017 has been ascended in contrast with year 2016 that is 1. AS CPI can be
exceptionally helpful with the end goal to gauge the expansion. The diminishing buyer value file
prompts impact on the swelling rate of nation (Armstrong and Taylor, 2014). In general contrast
if of 2% and which has resultant in ascended of rate of expansion.
Significance of calculating inflation rate
Inflation is a quantitative proportion of rate at which normal value derive with various
products and services. It is an imperative for associations to have data of inflation to calculate the
fluctuation in price of products and services and analysing the spending capacity of consumers. It
figures out the expansion rate of nation with the consumer living index (Al-Omari, 2016). The
chiefs need point by point data in regards to the swelling with the end goal to decide the costs of
delivered products and ventures in like manner. As in general it is urgent for business with the
end goal to be practical and focused in market.
M1 Evaluation of sources other than the NSO with regard to the gender pay gap
It is analysed that firms in the UK pay less consideration to female staff members
comparatively male staff members. It causes less contribution from females subject to Consumer
Index Price in the UK. As per the textiles group Rectella's survey the gender pay gap was
4
⊘ This is a preview!⊘
Do you want full access?
Subscribe today to unlock all pages.
Trusted by 1+ million students worldwide
recorded as 88%. Median was calculated as 9.9% for measurement in terms of payments (Gender
pay gap in UK, 2018).
ACTIVITY 2
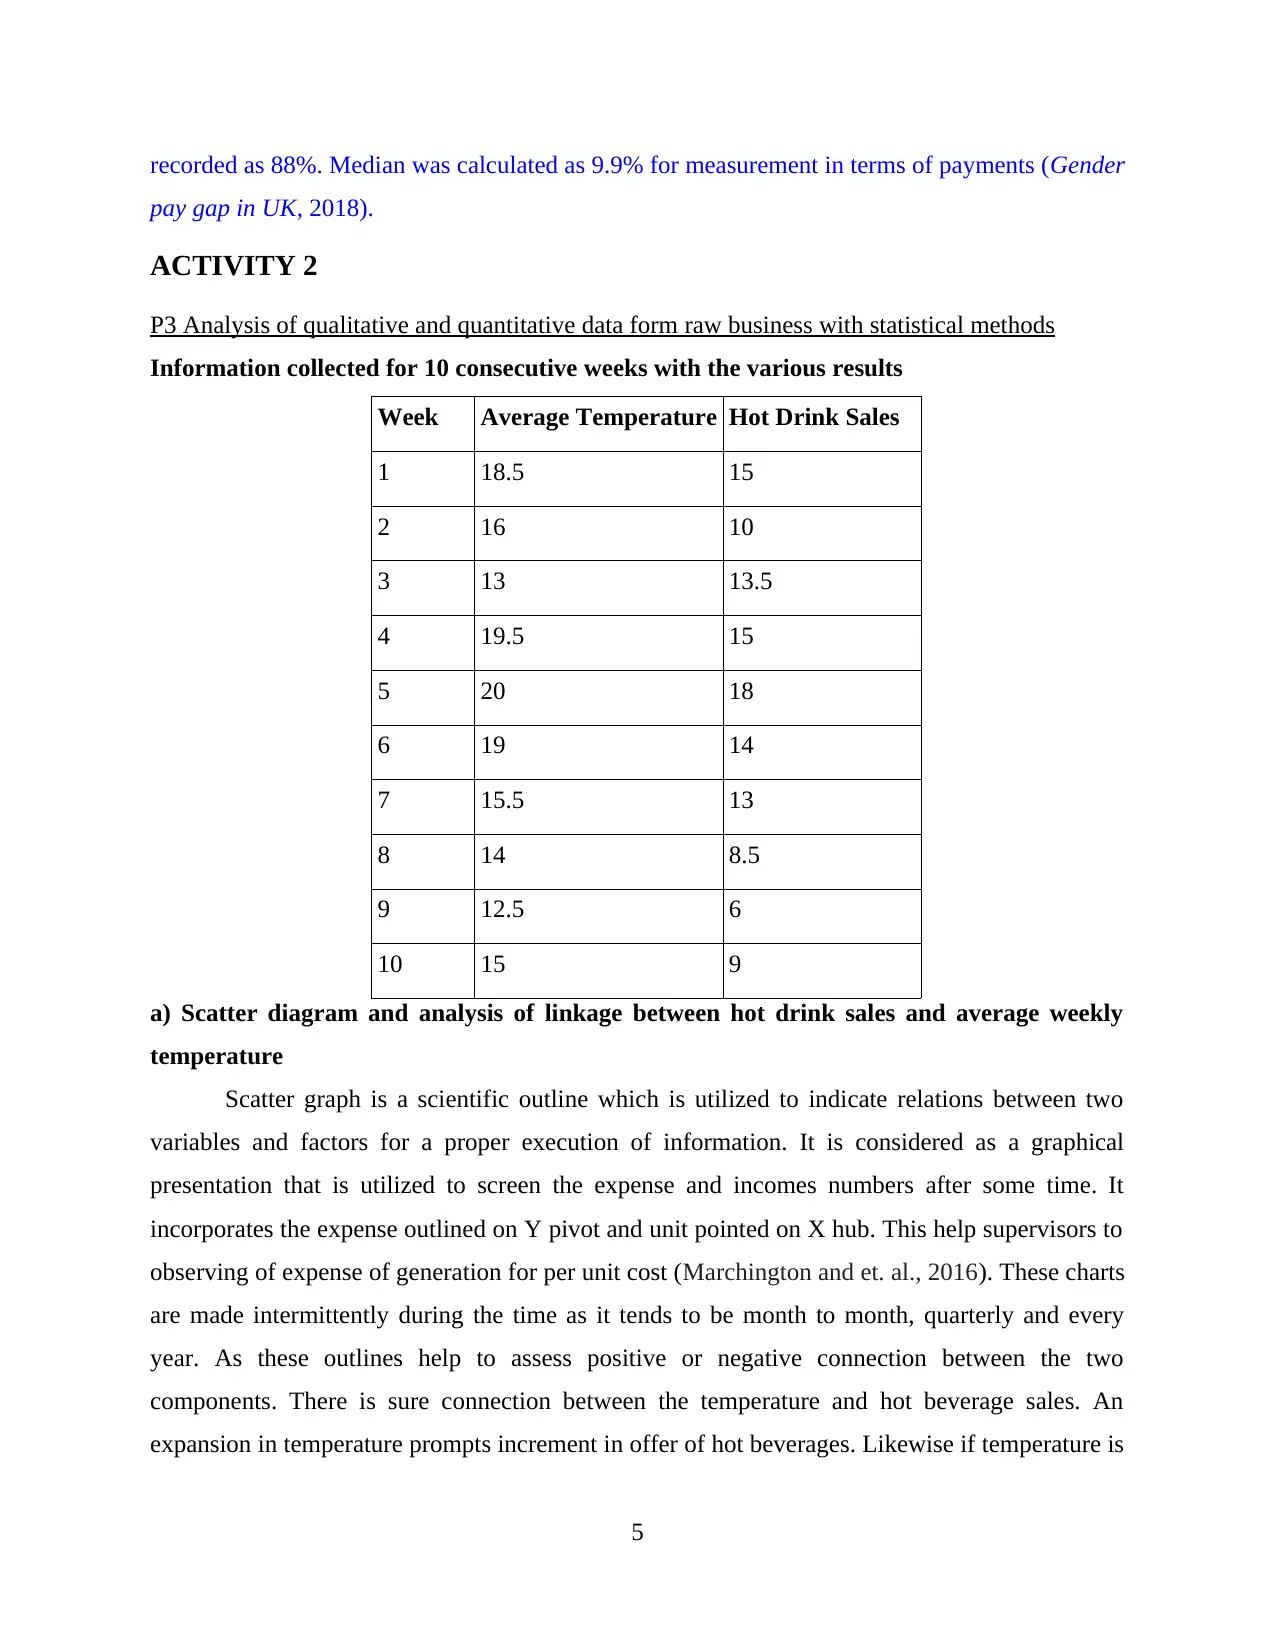
P3 Analysis of qualitative and quantitative data form raw business with statistical methods
Information collected for 10 consecutive weeks with the various results
Week Average Temperature Hot Drink Sales
1 18.5 15
2 16 10
3 13 13.5
4 19.5 15
5 20 18
6 19 14
7 15.5 13
8 14 8.5
9 12.5 6
10 15 9
a) Scatter diagram and analysis of linkage between hot drink sales and average weekly
temperature
Scatter graph is a scientific outline which is utilized to indicate relations between two
variables and factors for a proper execution of information. It is considered as a graphical
presentation that is utilized to screen the expense and incomes numbers after some time. It
incorporates the expense outlined on Y pivot and unit pointed on X hub. This help supervisors to
observing of expense of generation for per unit cost (Marchington and et. al., 2016). These charts
are made intermittently during the time as it tends to be month to month, quarterly and every
year. As these outlines help to assess positive or negative connection between the two
components. There is sure connection between the temperature and hot beverage sales. An
expansion in temperature prompts increment in offer of hot beverages. Likewise if temperature is
5
pay gap in UK, 2018).
ACTIVITY 2
P3 Analysis of qualitative and quantitative data form raw business with statistical methods
Information collected for 10 consecutive weeks with the various results
Week Average Temperature Hot Drink Sales
1 18.5 15
2 16 10
3 13 13.5
4 19.5 15
5 20 18
6 19 14
7 15.5 13
8 14 8.5
9 12.5 6
10 15 9
a) Scatter diagram and analysis of linkage between hot drink sales and average weekly
temperature
Scatter graph is a scientific outline which is utilized to indicate relations between two
variables and factors for a proper execution of information. It is considered as a graphical
presentation that is utilized to screen the expense and incomes numbers after some time. It
incorporates the expense outlined on Y pivot and unit pointed on X hub. This help supervisors to
observing of expense of generation for per unit cost (Marchington and et. al., 2016). These charts
are made intermittently during the time as it tends to be month to month, quarterly and every
year. As these outlines help to assess positive or negative connection between the two
components. There is sure connection between the temperature and hot beverage sales. An
expansion in temperature prompts increment in offer of hot beverages. Likewise if temperature is
5
Paraphrase This Document
Need a fresh take? Get an instant paraphrase of this document with our AI Paraphraser
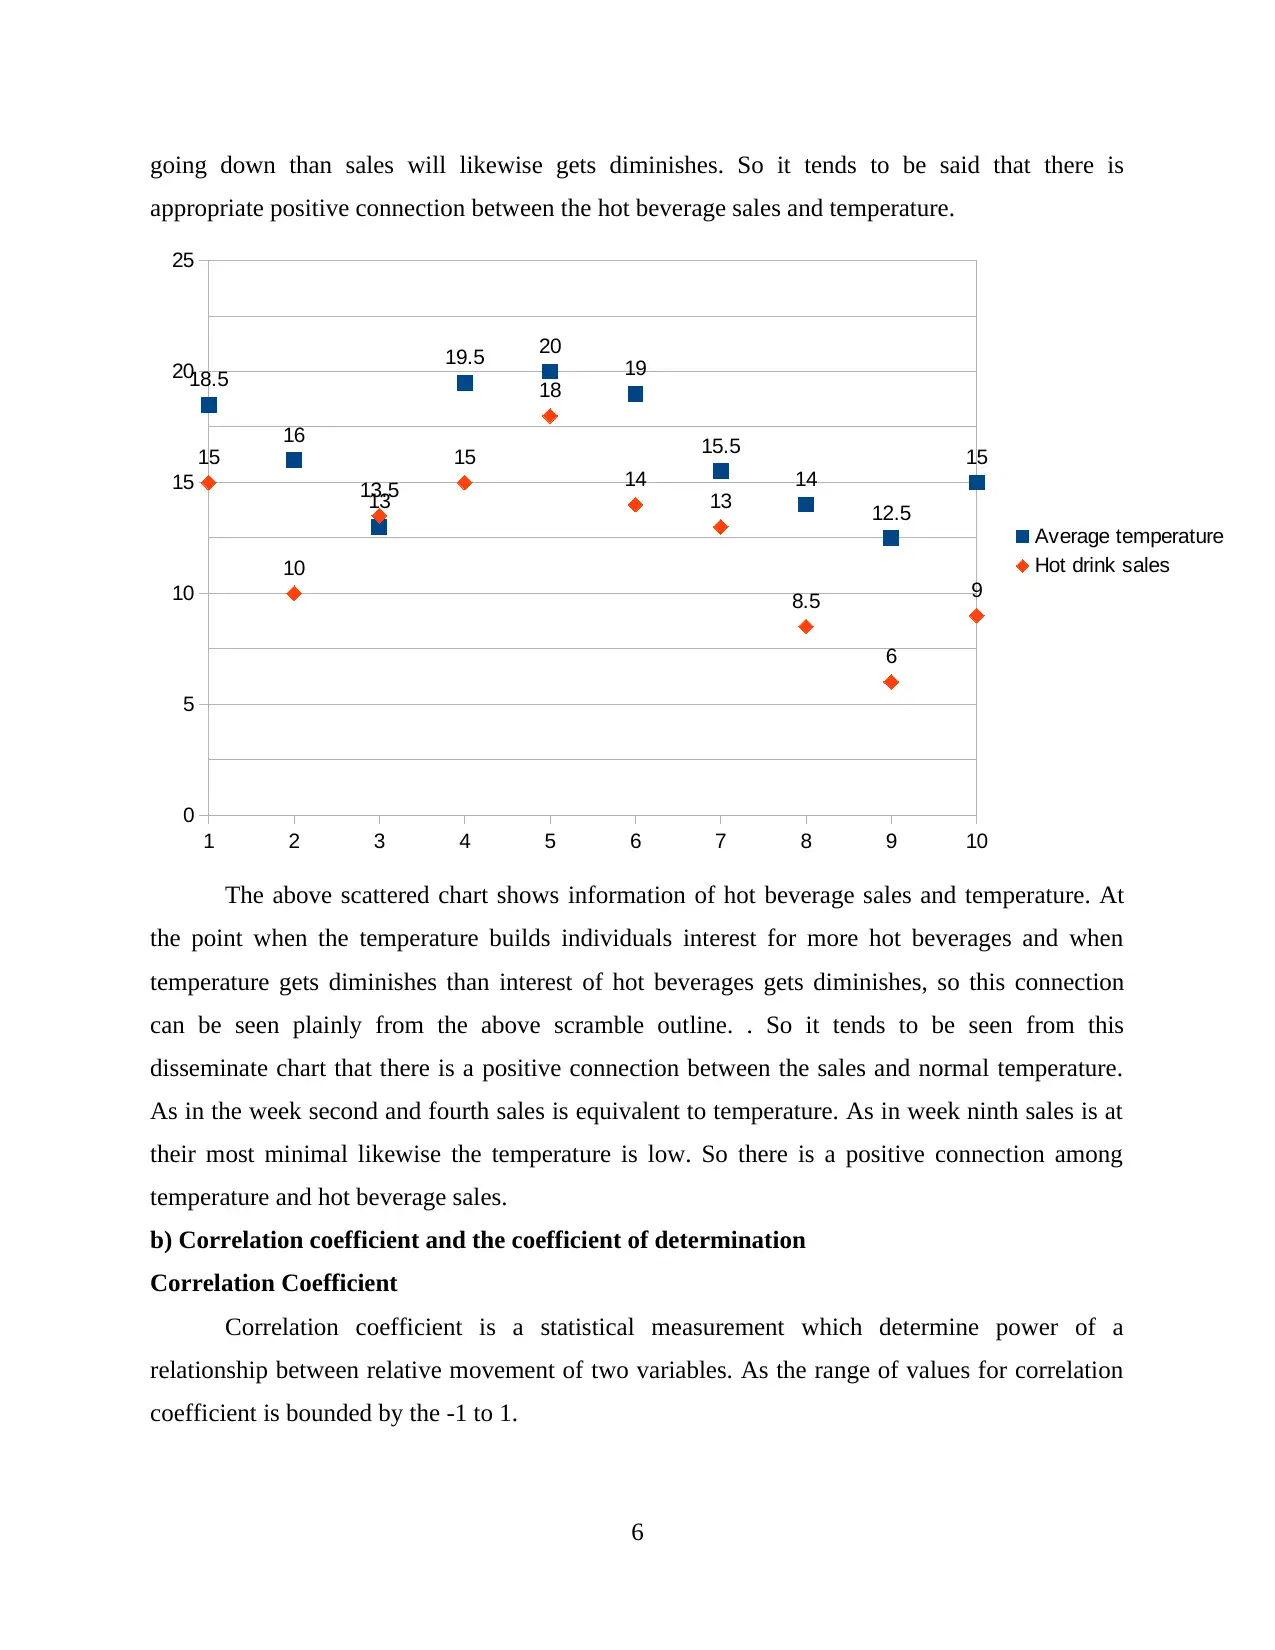
going down than sales will likewise gets diminishes. So it tends to be said that there is
appropriate positive connection between the hot beverage sales and temperature.
1 2 3 4 5 6 7 8 9 10
0
5
10
15
20
25
18.5
16
13
19.5 20
19
15.5
14
12.5
1515
10
13.5
15
18
14
13
8.5
6
9
Average temperature
Hot drink sales
The above scattered chart shows information of hot beverage sales and temperature. At
the point when the temperature builds individuals interest for more hot beverages and when
temperature gets diminishes than interest of hot beverages gets diminishes, so this connection
can be seen plainly from the above scramble outline. . So it tends to be seen from this
disseminate chart that there is a positive connection between the sales and normal temperature.
As in the week second and fourth sales is equivalent to temperature. As in week ninth sales is at
their most minimal likewise the temperature is low. So there is a positive connection among
temperature and hot beverage sales.
b) Correlation coefficient and the coefficient of determination
Correlation Coefficient
Correlation coefficient is a statistical measurement which determine power of a
relationship between relative movement of two variables. As the range of values for correlation
coefficient is bounded by the -1 to 1.
6
It is impossible to measure a non linear relationship between two variables. This correlation of
coefficient is very useful tool and it is used to forecast the information (Herrera and et. Al, 2016).
The strength of relationship depend on value of correlation coefficient. This tool is used by the
government, business house and individuals in order to forecast the future data according to
need. The various authors has given different different formulas in order to calculate the
correlation coefficient. As a basic formula which is used to calculate correlation of coefficient.
Coefficient of determination
As it is considered as output that originates from the examination of relapse. This is
deciphered as extent of fluctuation in the needy variable which is unsurprising from autonomous
variable (Gui and Aslam, 2017). This can be signified in rate additionally as 0.8 can be
composed as 80% . The higher coefficient of assurance is a pointer of solid match for the
perception. This is the square of relationship (r) which anticipated among y and x. Its range is 0
to 1. The fall of information focuses inside relapse condition can be anticipated from the
coefficient assurance. Where as the lower coefficient of assurance isn't considered as solid match
for perception. This shows change in the two arrangement of information. There is two factors in
assurance one is reliant and other one is autonomous. These factors are indicated by X and Y. As
recipe of assurance is examined as :
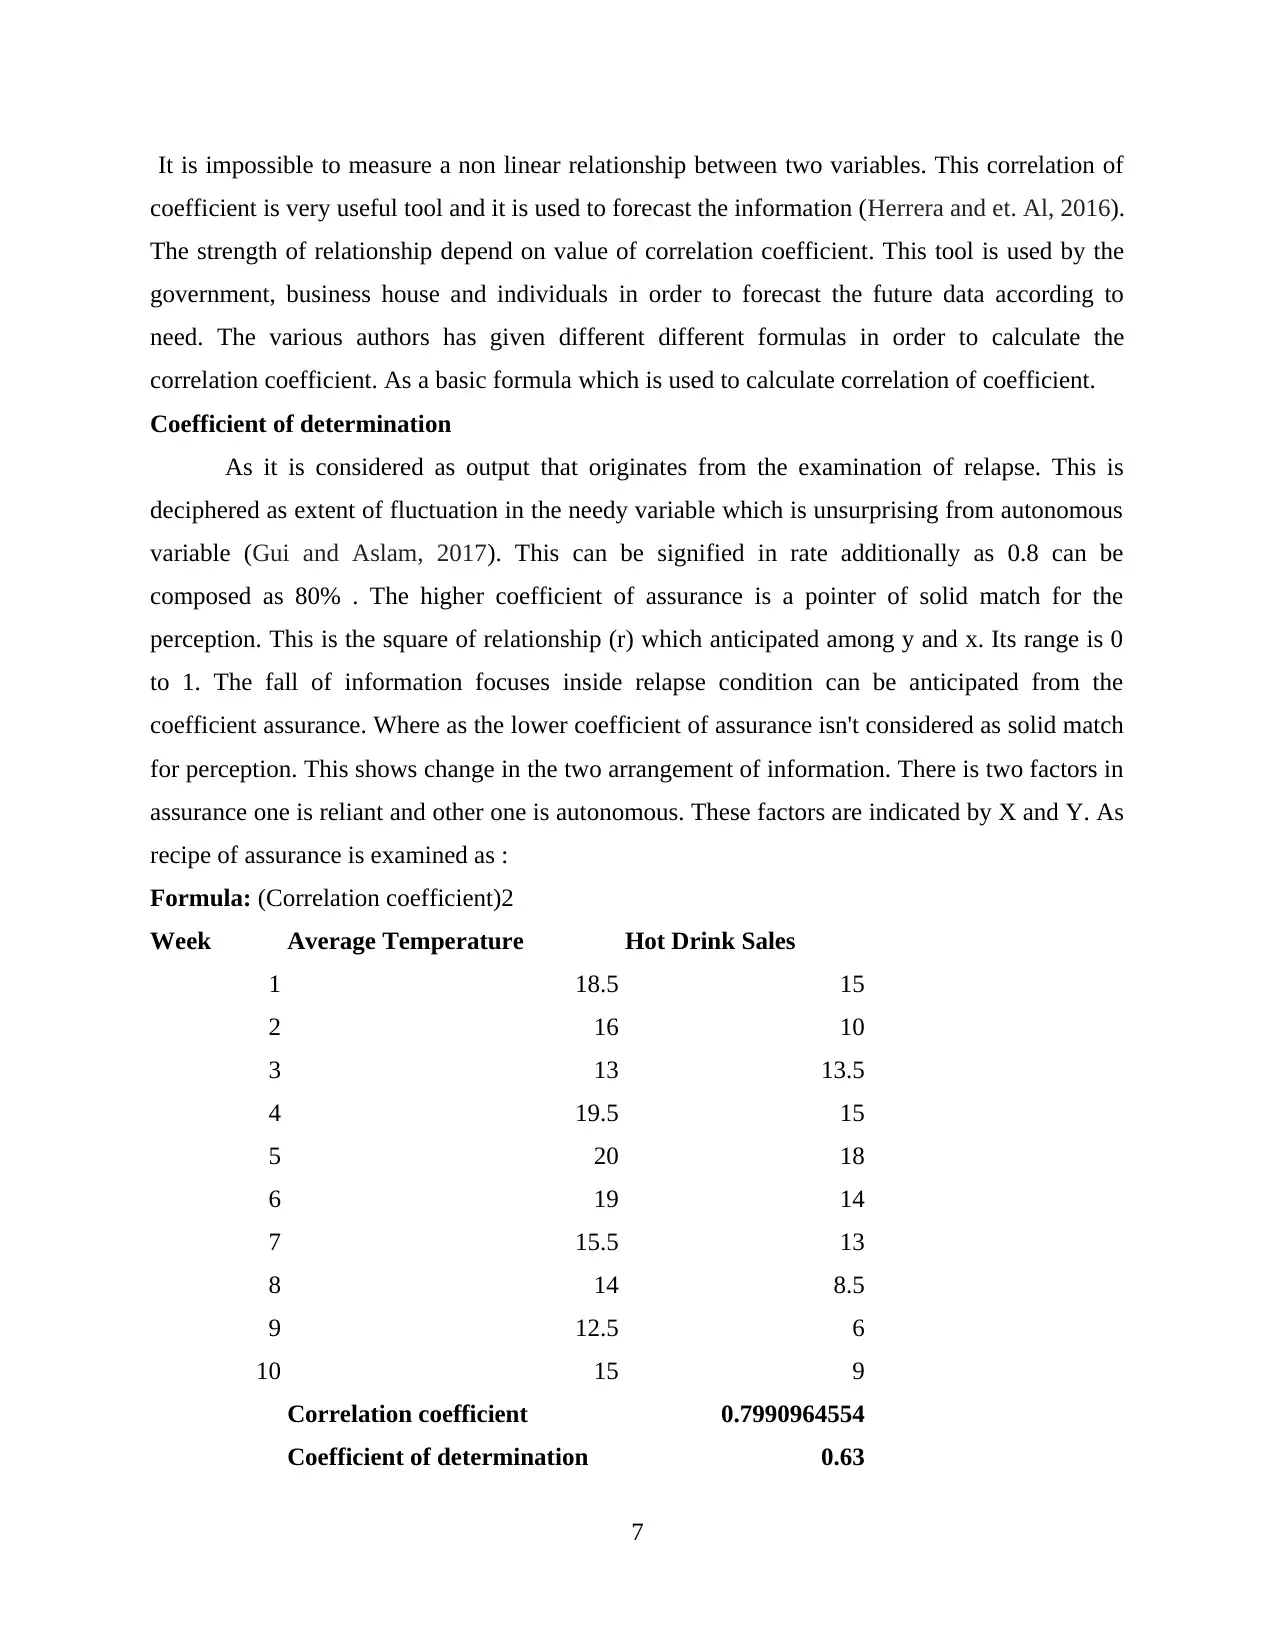
Formula: (Correlation coefficient)2
Week Average Temperature Hot Drink Sales
1 18.5 15
2 16 10
3 13 13.5
4 19.5 15
5 20 18
6 19 14
7 15.5 13
8 14 8.5
9 12.5 6
10 15 9
Correlation coefficient 0.7990964554
Coefficient of determination 0.63
7
coefficient is very useful tool and it is used to forecast the information (Herrera and et. Al, 2016).
The strength of relationship depend on value of correlation coefficient. This tool is used by the
government, business house and individuals in order to forecast the future data according to
need. The various authors has given different different formulas in order to calculate the
correlation coefficient. As a basic formula which is used to calculate correlation of coefficient.
Coefficient of determination
As it is considered as output that originates from the examination of relapse. This is
deciphered as extent of fluctuation in the needy variable which is unsurprising from autonomous
variable (Gui and Aslam, 2017). This can be signified in rate additionally as 0.8 can be
composed as 80% . The higher coefficient of assurance is a pointer of solid match for the
perception. This is the square of relationship (r) which anticipated among y and x. Its range is 0
to 1. The fall of information focuses inside relapse condition can be anticipated from the
coefficient assurance. Where as the lower coefficient of assurance isn't considered as solid match
for perception. This shows change in the two arrangement of information. There is two factors in
assurance one is reliant and other one is autonomous. These factors are indicated by X and Y. As
recipe of assurance is examined as :
Formula: (Correlation coefficient)2
Week Average Temperature Hot Drink Sales
1 18.5 15
2 16 10
3 13 13.5
4 19.5 15
5 20 18
6 19 14
7 15.5 13
8 14 8.5
9 12.5 6
10 15 9
Correlation coefficient 0.7990964554
Coefficient of determination 0.63
7
⊘ This is a preview!⊘
Do you want full access?
Subscribe today to unlock all pages.
Trusted by 1+ million students worldwide
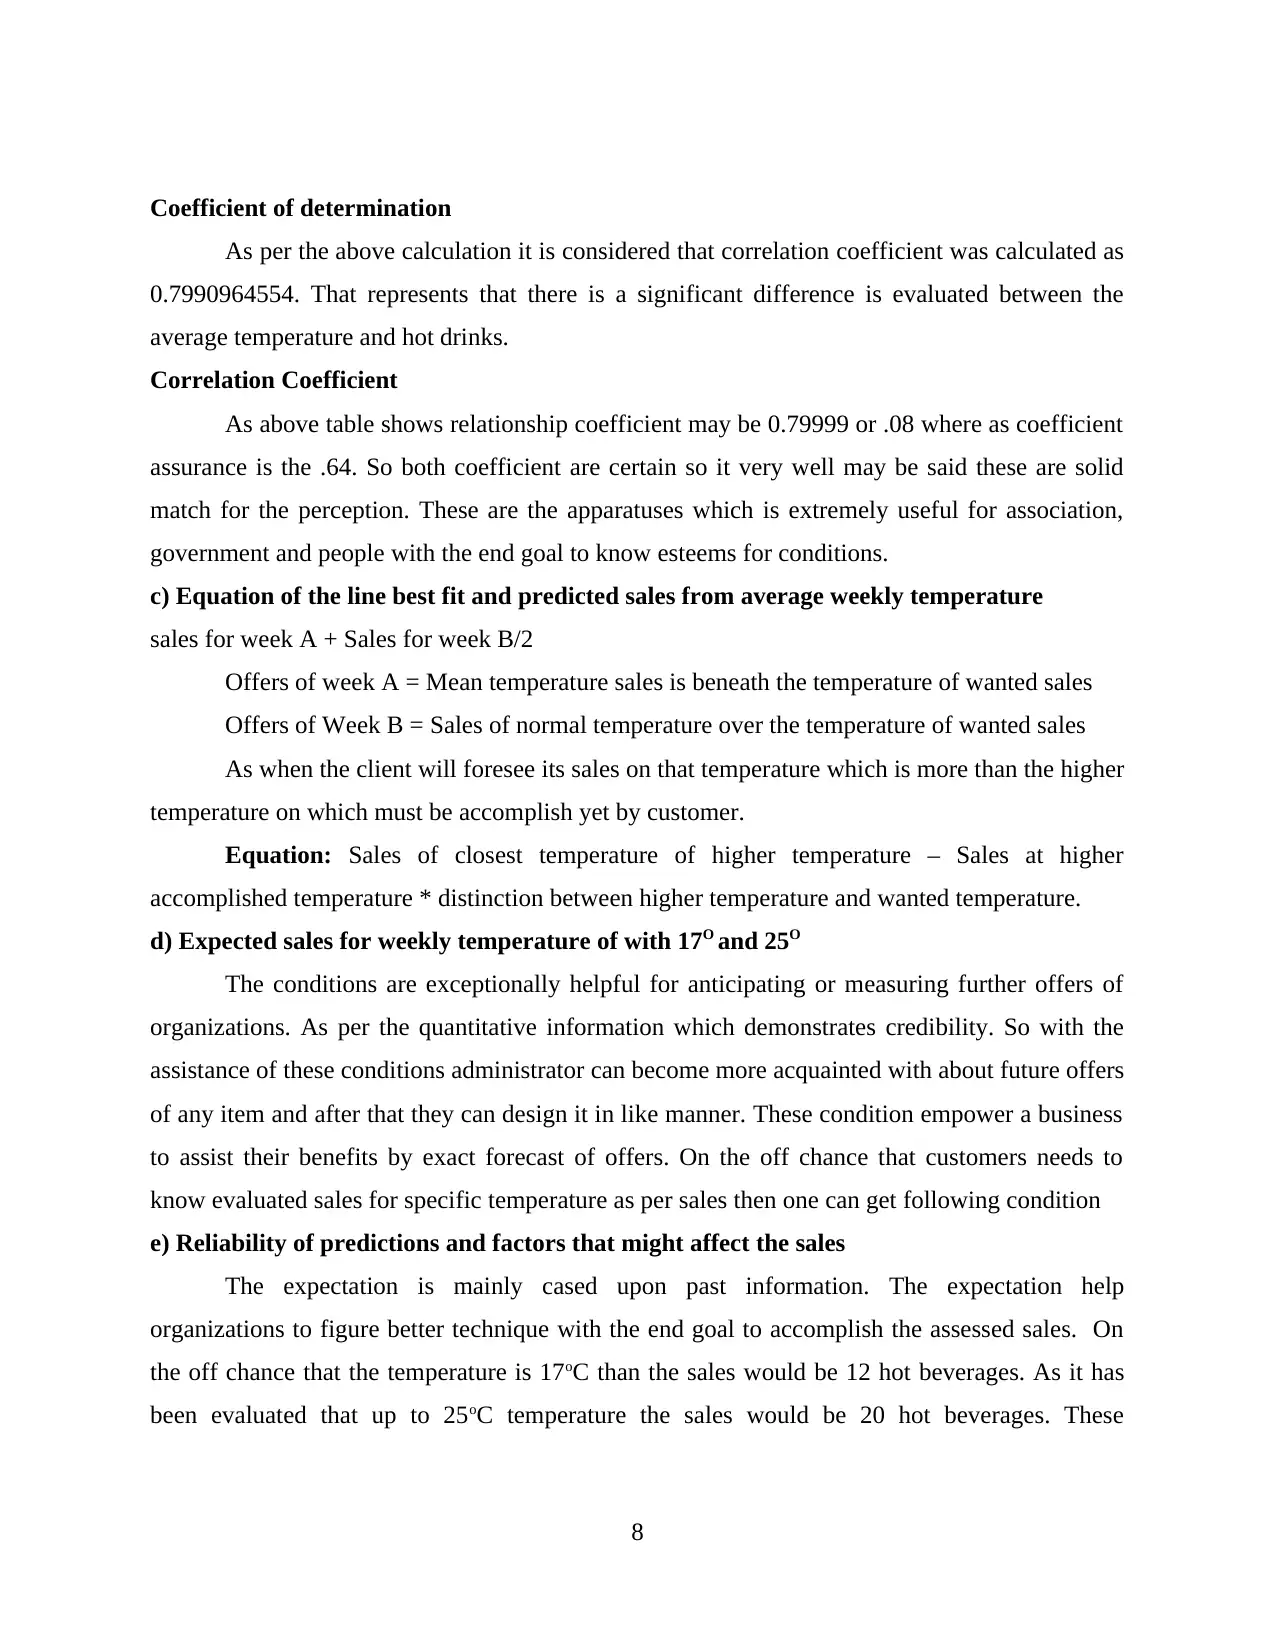
Coefficient of determination
As per the above calculation it is considered that correlation coefficient was calculated as
0.7990964554. That represents that there is a significant difference is evaluated between the
average temperature and hot drinks.
Correlation Coefficient
As above table shows relationship coefficient may be 0.79999 or .08 where as coefficient
assurance is the .64. So both coefficient are certain so it very well may be said these are solid
match for the perception. These are the apparatuses which is extremely useful for association,
government and people with the end goal to know esteems for conditions.
c) Equation of the line best fit and predicted sales from average weekly temperature
sales for week A + Sales for week B/2
Offers of week A = Mean temperature sales is beneath the temperature of wanted sales
Offers of Week B = Sales of normal temperature over the temperature of wanted sales
As when the client will foresee its sales on that temperature which is more than the higher
temperature on which must be accomplish yet by customer.
Equation: Sales of closest temperature of higher temperature – Sales at higher
accomplished temperature * distinction between higher temperature and wanted temperature.
d) Expected sales for weekly temperature of with 17O and 25O
The conditions are exceptionally helpful for anticipating or measuring further offers of
organizations. As per the quantitative information which demonstrates credibility. So with the
assistance of these conditions administrator can become more acquainted with about future offers
of any item and after that they can design it in like manner. These condition empower a business
to assist their benefits by exact forecast of offers. On the off chance that customers needs to
know evaluated sales for specific temperature as per sales then one can get following condition
e) Reliability of predictions and factors that might affect the sales
The expectation is mainly cased upon past information. The expectation help
organizations to figure better technique with the end goal to accomplish the assessed sales. On
the off chance that the temperature is 17oC than the sales would be 12 hot beverages. As it has
been evaluated that up to 25oC temperature the sales would be 20 hot beverages. These
8
Paraphrase This Document
Need a fresh take? Get an instant paraphrase of this document with our AI Paraphraser
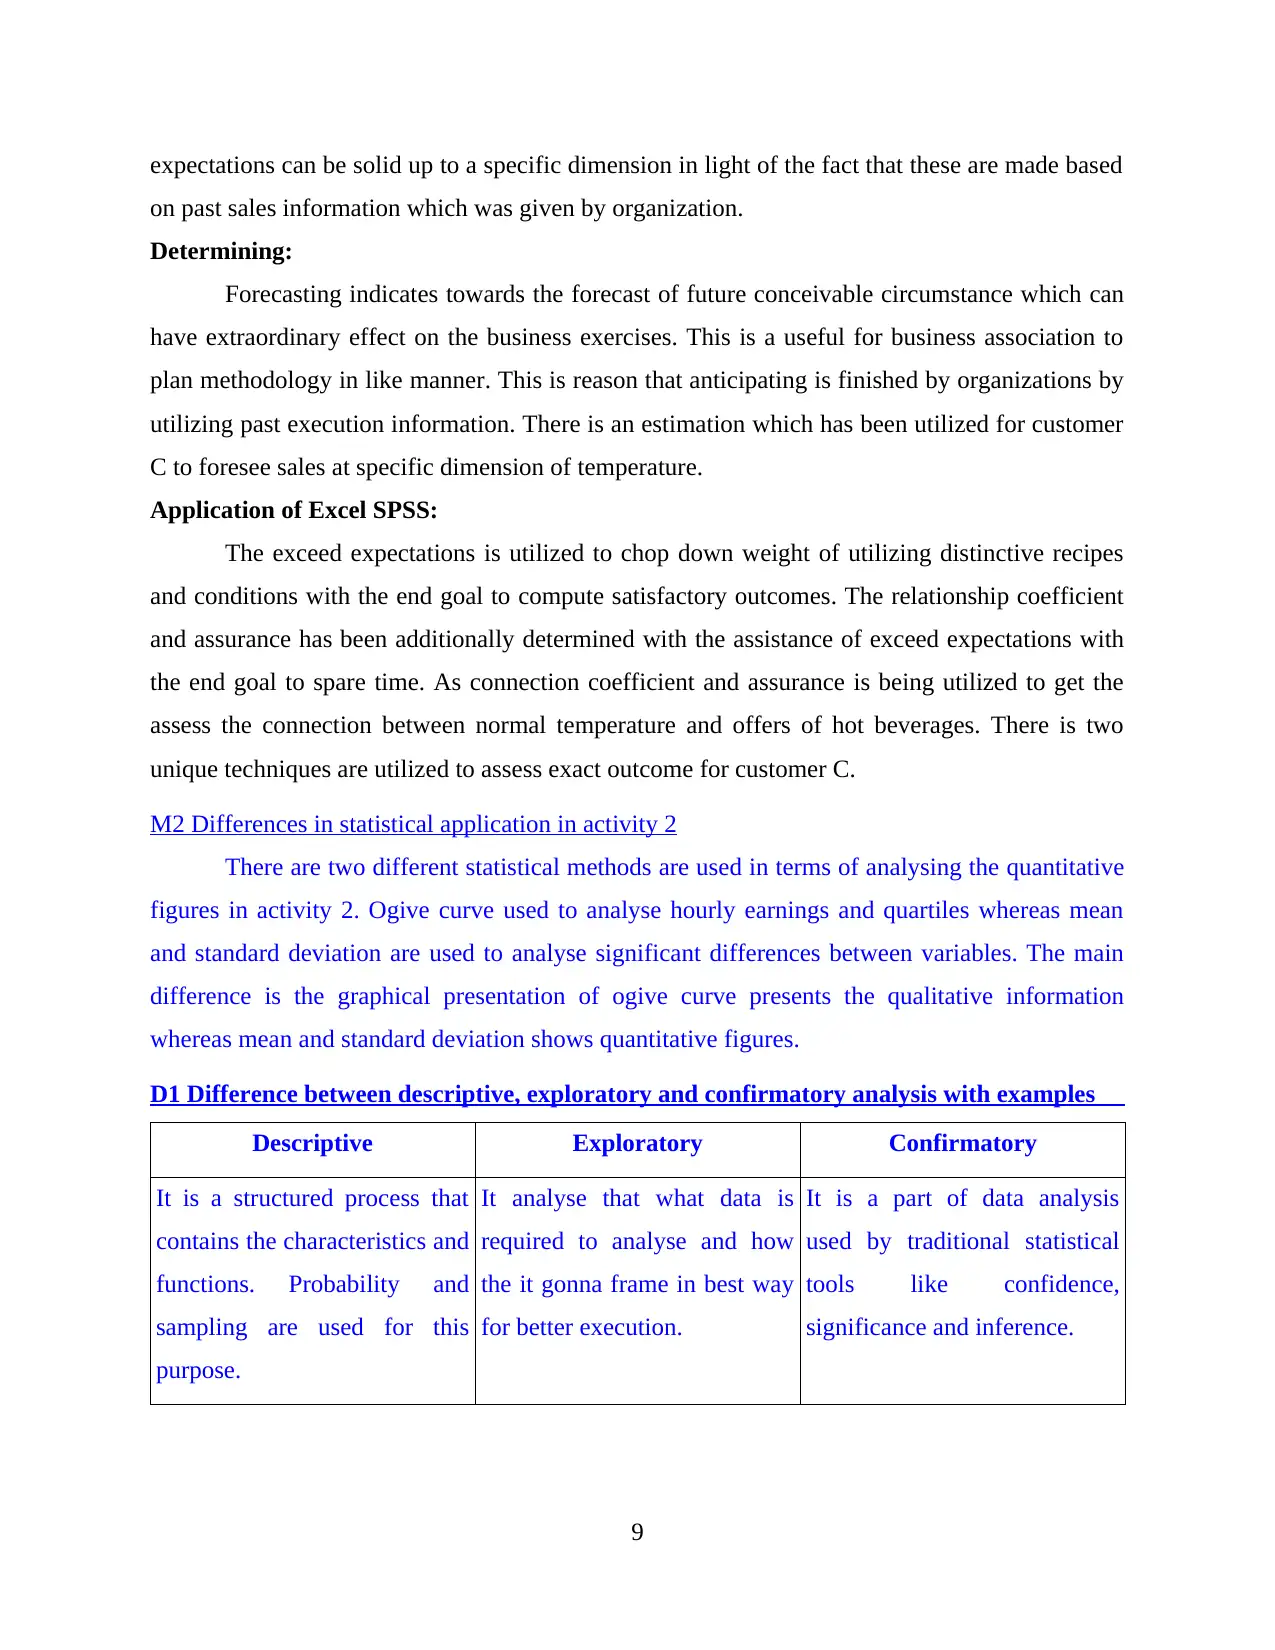
expectations can be solid up to a specific dimension in light of the fact that these are made based
on past sales information which was given by organization.
Determining:
Forecasting indicates towards the forecast of future conceivable circumstance which can
have extraordinary effect on the business exercises. This is a useful for business association to
plan methodology in like manner. This is reason that anticipating is finished by organizations by
utilizing past execution information. There is an estimation which has been utilized for customer
C to foresee sales at specific dimension of temperature.
Application of Excel SPSS:
The exceed expectations is utilized to chop down weight of utilizing distinctive recipes
and conditions with the end goal to compute satisfactory outcomes. The relationship coefficient
and assurance has been additionally determined with the assistance of exceed expectations with
the end goal to spare time. As connection coefficient and assurance is being utilized to get the
assess the connection between normal temperature and offers of hot beverages. There is two
unique techniques are utilized to assess exact outcome for customer C.
M2 Differences in statistical application in activity 2
There are two different statistical methods are used in terms of analysing the quantitative
figures in activity 2. Ogive curve used to analyse hourly earnings and quartiles whereas mean
and standard deviation are used to analyse significant differences between variables. The main
difference is the graphical presentation of ogive curve presents the qualitative information
whereas mean and standard deviation shows quantitative figures.
D1 Difference between descriptive, exploratory and confirmatory analysis with examples
Descriptive Exploratory Confirmatory
It is a structured process that
contains the characteristics and
functions. Probability and
sampling are used for this
purpose.
It analyse that what data is
required to analyse and how
the it gonna frame in best way
for better execution.
It is a part of data analysis
used by traditional statistical
tools like confidence,
significance and inference.
9
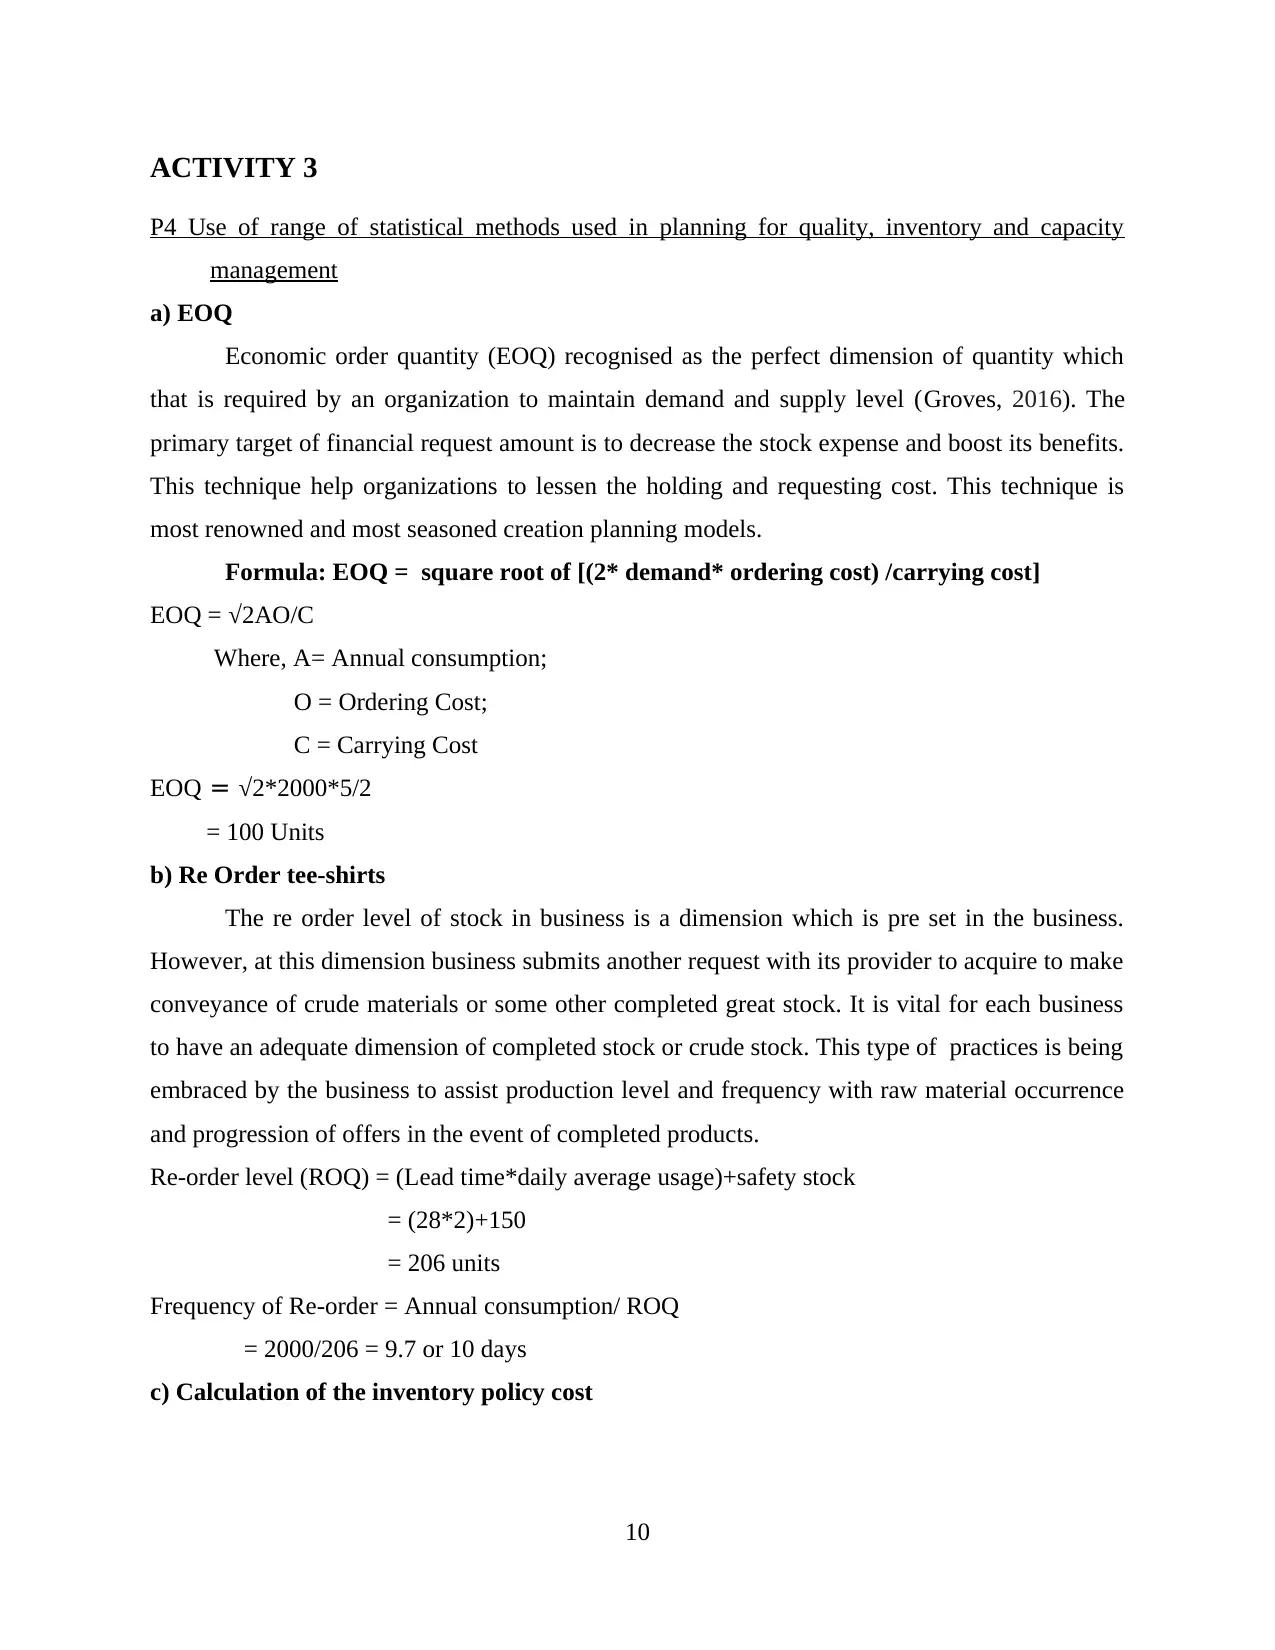
ACTIVITY 3
P4 Use of range of statistical methods used in planning for quality, inventory and capacity
management
a) EOQ
Economic order quantity (EOQ) recognised as the perfect dimension of quantity which
that is required by an organization to maintain demand and supply level (Groves, 2016). The
primary target of financial request amount is to decrease the stock expense and boost its benefits.
This technique help organizations to lessen the holding and requesting cost. This technique is
most renowned and most seasoned creation planning models.
Formula: EOQ = square root of [(2* demand* ordering cost) /carrying cost]
EOQ = √2AO/C
Where, A= Annual consumption;
O = Ordering Cost;
C = Carrying Cost
EOQ = √2*2000*5/2
= 100 Units
b) Re Order tee-shirts
The re order level of stock in business is a dimension which is pre set in the business.
However, at this dimension business submits another request with its provider to acquire to make
conveyance of crude materials or some other completed great stock. It is vital for each business
to have an adequate dimension of completed stock or crude stock. This type of practices is being
embraced by the business to assist production level and frequency with raw material occurrence
and progression of offers in the event of completed products.
Re-order level (ROQ) = (Lead time*daily average usage)+safety stock
= (28*2)+150
= 206 units
Frequency of Re-order = Annual consumption/ ROQ
= 2000/206 = 9.7 or 10 days
c) Calculation of the inventory policy cost
10
⊘ This is a preview!⊘
Do you want full access?
Subscribe today to unlock all pages.
Trusted by 1+ million students worldwide
1 out of 18
Related Documents


Your All-in-One AI-Powered Toolkit for Academic Success.
+13062052269
info@desklib.com
Available 24*7 on WhatsApp / Email
![[object Object]](/_next/static/media/star-bottom.7253800d.svg)
Unlock your academic potential
Copyright © 2020–2026 A2Z Services. All Rights Reserved. Developed and managed by ZUCOL.