Statistics for Management: Data Analysis and Business Decisions
VerifiedAdded on 2021/02/19
|10
|2587
|75
Report
AI Summary
This report delves into the application of statistics within a management context, providing a comprehensive overview of data analysis techniques and their significance in achieving business objectives and gaining a competitive advantage. The report defines statistics, explores data sources, and highlights the value of statistical methods in decision-making. It analyzes inductive and deductive approaches, examining their implications for business intelligence, and presents a case study involving the analysis of investment proposals and marketing campaign data. The analysis includes the suitability of various data analysis methods, results interpretation, and fact analysis, culminating in actionable insights for effective management strategies. The report also uses visual aids like charts and tables to enhance the understanding of the statistical concepts, showing the practical use of statistics in the modern business environment.

STATISTICS FOR MANAGEMENT
Paraphrase This Document
Need a fresh take? Get an instant paraphrase of this document with our AI Paraphraser
TABLE OF CONTENTS
INTRODUCTION...........................................................................................................................1
Part A...............................................................................................................................................1
(1)Defining statistics, its characteristics and benefits of its application.....................................1
(2)Sources and types of data and information businesses can access.........................................1
(3)Value of employing statistical methods when meeting business objectives and achieving
competitive advantage.................................................................................................................2
(4)Analysis of deductive and inductive approaches and what the implications are for business
intelligence..................................................................................................................................2
(5)Analysis of sample sets of data for making decisions............................................................3
(6)Suitability of data analysis method........................................................................................4
TASK B...........................................................................................................................................4
Analysis of results.......................................................................................................................4
Task C..............................................................................................................................................6
Analysis of facts..........................................................................................................................6
CONCLUSION................................................................................................................................7
REFERENCES................................................................................................................................................8
Figure 1Data analysis of investment proposals...............................................................................3
Table 1Products A, B and C varied campaign share in total number of campaigns run.................6
INTRODUCTION
Statistics is the one of the field that is gaining due importance in current time period. In the
present research study statistics and data is defined in detail and by using tools data is analyzed
in the report. At end conclusion section is prepared.
Part A
(1)Defining statistics, its characteristics and benefits of its application
Statistics is the field where by using varied approaches analysis of variables is done either
individually or collectively. There are some of the characteristics of statistics and same are
explained below. Aggregation of facts: In statistics aggregation of facts happened. Aggregation refers to
performing operations that consider bunch of data and return specific result like SUM,
MAX, MIN and STDEV etc (Little, Deboeck and Wu, 2015). Numerically expressed: In statistics all variables are numerically expressed. Even results
are obtained in text they need to be convert in to number through coding. Hence, it is
another important characteristic of statistics.
There are number of benefits of using statistics in the business. One of benefit is that by using
statistic one can identify whether significant change comes in cost of production due to fast
increase in price of raw materials. In other words, relationship between varied variables can be
identified by using statistics. If one knows relationship between variables then it can find out that
due to business operations any change comes in specific activity then what sort of change can
come in another activity.
(2)Sources and types of data and information businesses can access
There are multiple sources from where data business can access. Some of these sources are
CRM or customer service management software. Another source from where business can access
data are Amazon AWS where when pixel fire data goes to AWS server and through PostgreSQL
one can access entire data. PostgreSQL is always connected Amazon AWS. Type of data that
business can access (Silverman, 2018).
Qualitative: It is the data that is obtained from open ended questionnaire. Under this one
give answer in detail business manager need to ensure that data is converted in quantitative from
qualitative
1
⊘ This is a preview!⊘
Do you want full access?
Subscribe today to unlock all pages.
Trusted by 1+ million students worldwide
Quantitative: It is the numerical data which can be accessed by the firm from CRM systems
or PostgreSQL that is connected to Amazon AWS server.
(3)Value of employing statistical methods when meeting business objectives and achieving
competitive advantage
Statistics have great use for the managers in respect to making business decisions. Statistics
have wide use for the managers in respect to meeting of business objectives. By using approach,
one can easily identify progress that is made up till date to achieve objective. Multiple
descriptive statistical tools like mean and standard deviation are used to measure success of the
campaign. In order to achieve competitive advantage also statistics is used by the managers
(Tyanova and et.al., 2016). This is because by using statistics one can compare multiple variables
and may identify relationship between them. Results obtained on application of statistical tools
help managers in identifying whatever change comes in one variable due to another one. Hence,
analyst can easily identify whether performance is good or there is need to take steps to work on
weak areas in order to achieve competitive advantage. Thus, it can be said that there is great use
of statistical methods in respect to measuring progress of steps taken to achieve business
objective and competitive advantage. This is the reason due to which in today time period many
large size firms are focusing on preparing their own analytics team or they are taking service or
another firm for data analysis purpose.
(4)Analysis of deductive and inductive approaches and what the implications are for business
intelligence
Inductive and deductive both are different approaches. Companies usually use both
approaches at the workplace. In case of inductive approach first of all hypothesis is prepared and
data is tested to prepare new theory. On other hand, in case of deductive approach already theory
is prepared and same is tested by identifying whether null or alternative hypothesis is accepted.
Thus, it can be said that there is equal importance of both approaches for the firm. There are
serious consequences of following inductive approach. This is because if analyst will analyze
data in new way it can find out new things that are going on and was hidden till the date ( Sik,
2015). Thus, it can be said that inductive approach has serious and positive consequence for
business intelligence as it give new area where team need to work in order to address issues. On
other hand, in case of deductive approach BI team can identify that whatever trend from long
time prevailed few days ago also exist today or any new development happened. Thus, by using
2
Paraphrase This Document
Need a fresh take? Get an instant paraphrase of this document with our AI Paraphraser
deductive approach manager can easily identify whether steps previously taken need to be
perform this time again or any new measures will be required to handle situation. Thus, it can be
assumed that by using inductive and deductive approach business intelligence can be made
stronger.
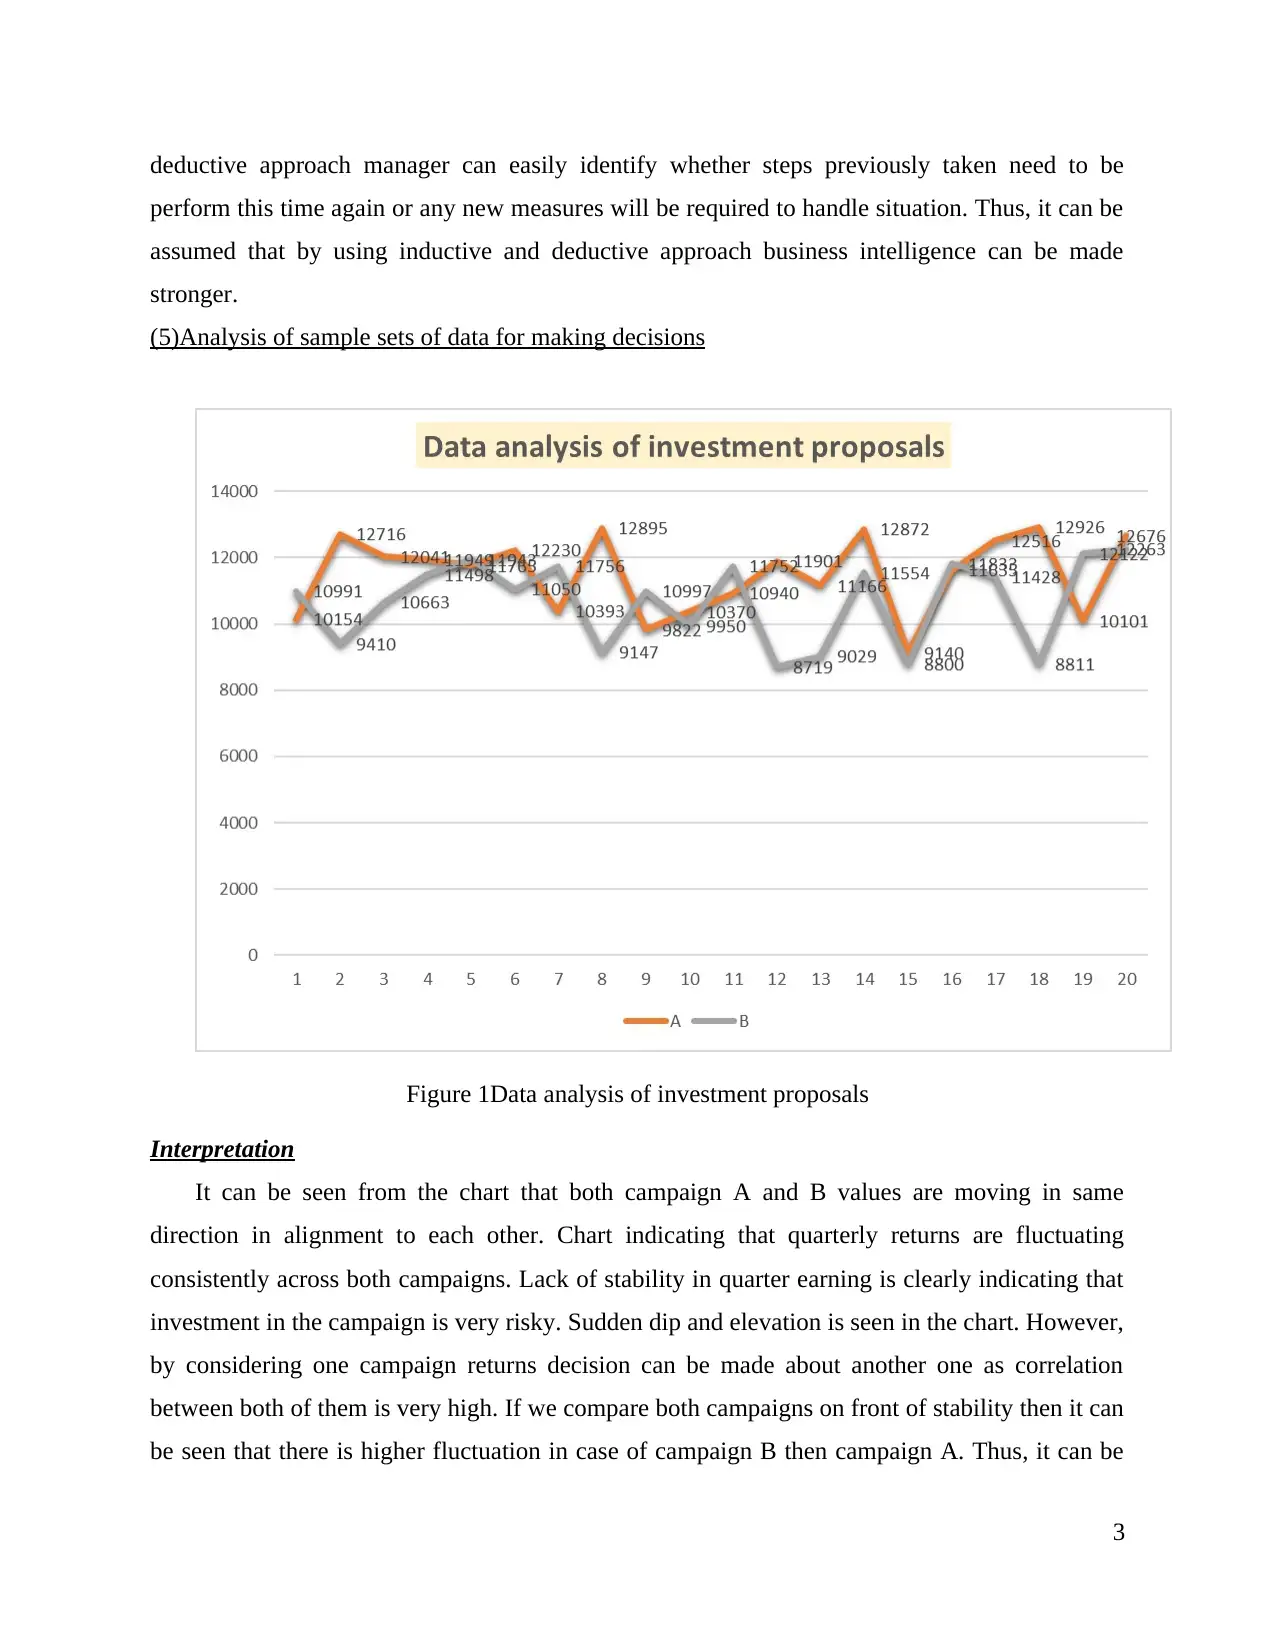
(5)Analysis of sample sets of data for making decisions
Figure 1Data analysis of investment proposals
Interpretation
It can be seen from the chart that both campaign A and B values are moving in same
direction in alignment to each other. Chart indicating that quarterly returns are fluctuating
consistently across both campaigns. Lack of stability in quarter earning is clearly indicating that
investment in the campaign is very risky. Sudden dip and elevation is seen in the chart. However,
by considering one campaign returns decision can be made about another one as correlation
between both of them is very high. If we compare both campaigns on front of stability then it can
be seen that there is higher fluctuation in case of campaign B then campaign A. Thus, it can be
3
perform this time again or any new measures will be required to handle situation. Thus, it can be
assumed that by using inductive and deductive approach business intelligence can be made
stronger.
(5)Analysis of sample sets of data for making decisions
Figure 1Data analysis of investment proposals
Interpretation
It can be seen from the chart that both campaign A and B values are moving in same
direction in alignment to each other. Chart indicating that quarterly returns are fluctuating
consistently across both campaigns. Lack of stability in quarter earning is clearly indicating that
investment in the campaign is very risky. Sudden dip and elevation is seen in the chart. However,
by considering one campaign returns decision can be made about another one as correlation
between both of them is very high. If we compare both campaigns on front of stability then it can
be seen that there is higher fluctuation in case of campaign B then campaign A. Thus, it can be
3
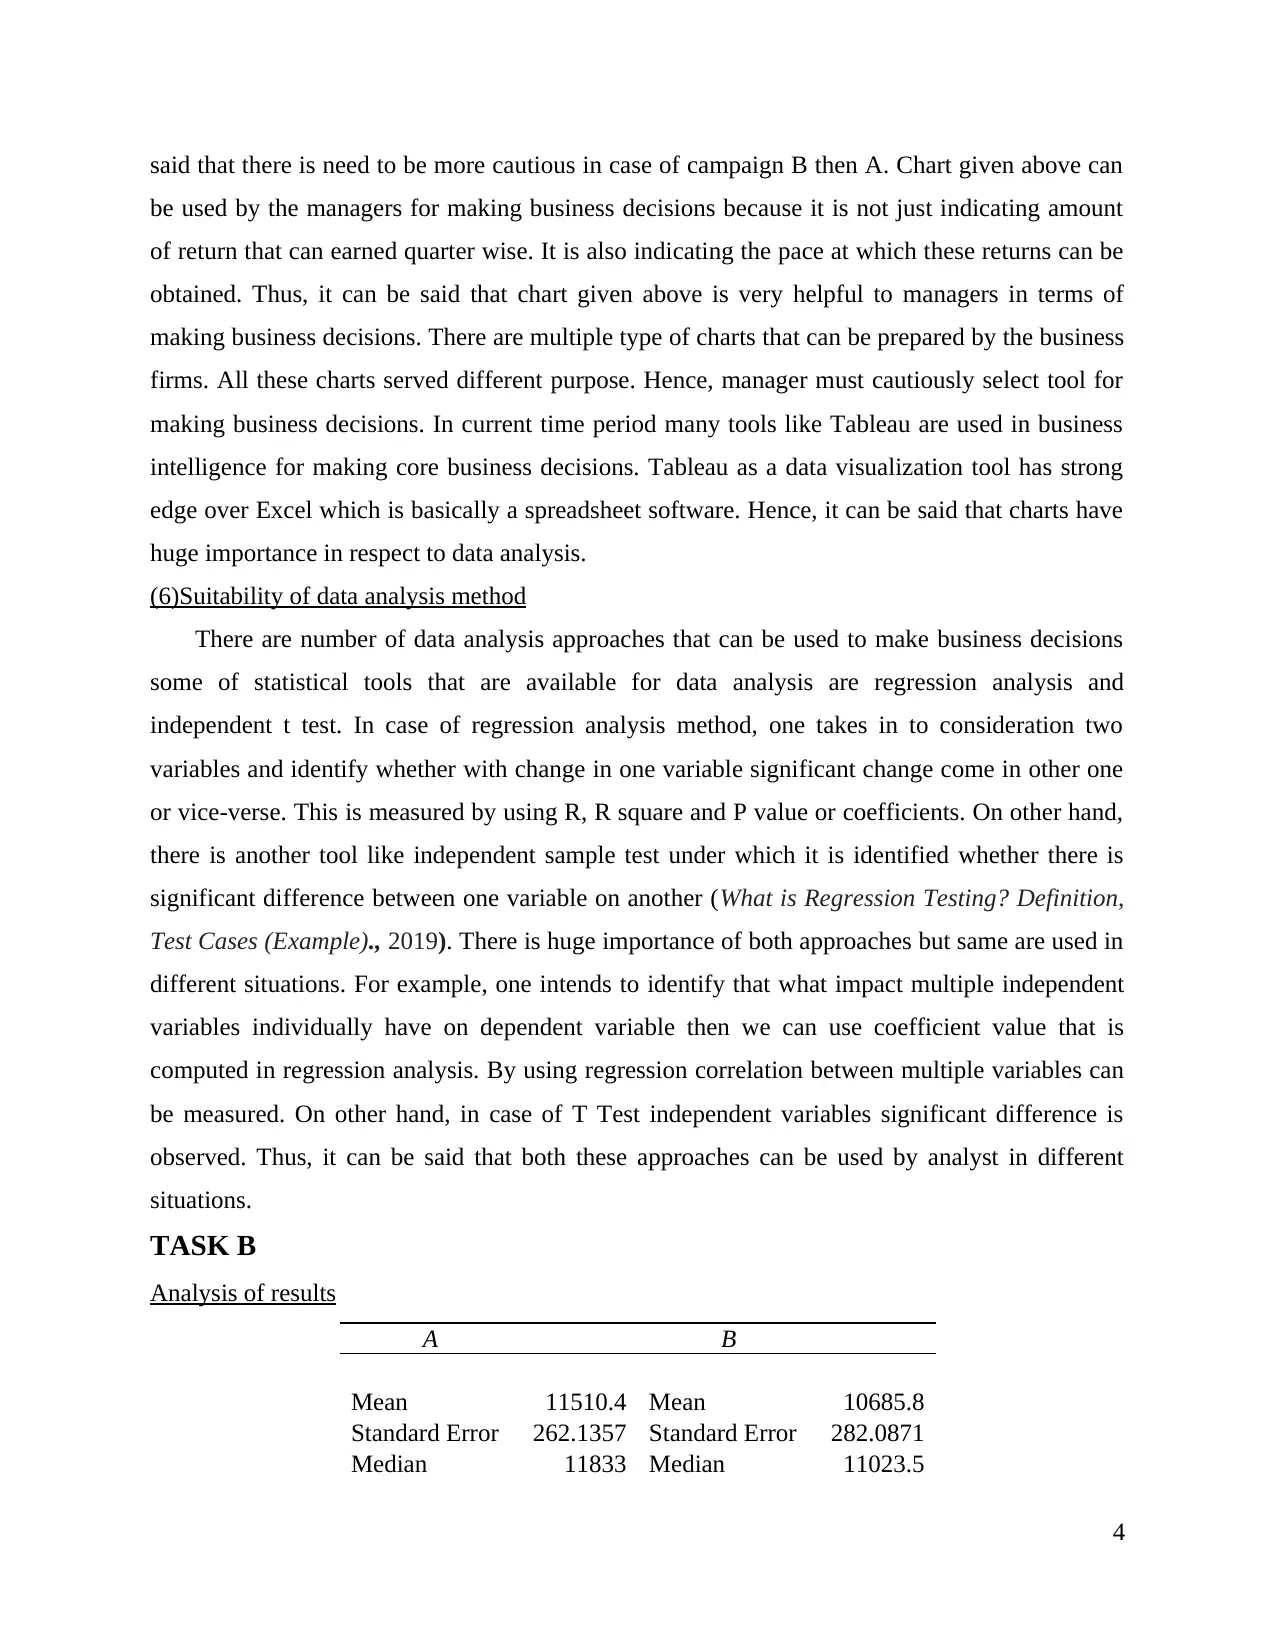
said that there is need to be more cautious in case of campaign B then A. Chart given above can
be used by the managers for making business decisions because it is not just indicating amount
of return that can earned quarter wise. It is also indicating the pace at which these returns can be
obtained. Thus, it can be said that chart given above is very helpful to managers in terms of
making business decisions. There are multiple type of charts that can be prepared by the business
firms. All these charts served different purpose. Hence, manager must cautiously select tool for
making business decisions. In current time period many tools like Tableau are used in business
intelligence for making core business decisions. Tableau as a data visualization tool has strong
edge over Excel which is basically a spreadsheet software. Hence, it can be said that charts have
huge importance in respect to data analysis.
(6)Suitability of data analysis method
There are number of data analysis approaches that can be used to make business decisions
some of statistical tools that are available for data analysis are regression analysis and
independent t test. In case of regression analysis method, one takes in to consideration two
variables and identify whether with change in one variable significant change come in other one
or vice-verse. This is measured by using R, R square and P value or coefficients. On other hand,
there is another tool like independent sample test under which it is identified whether there is
significant difference between one variable on another (What is Regression Testing? Definition,
Test Cases (Example)., 2019). There is huge importance of both approaches but same are used in
different situations. For example, one intends to identify that what impact multiple independent
variables individually have on dependent variable then we can use coefficient value that is
computed in regression analysis. By using regression correlation between multiple variables can
be measured. On other hand, in case of T Test independent variables significant difference is
observed. Thus, it can be said that both these approaches can be used by analyst in different
situations.
TASK B
Analysis of results
A B
Mean 11510.4 Mean 10685.8
Standard Error 262.1357 Standard Error 282.0871
Median 11833 Median 11023.5
4
⊘ This is a preview!⊘
Do you want full access?
Subscribe today to unlock all pages.
Trusted by 1+ million students worldwide
Mode #N/A Mode #N/A
Standard
Deviation 1172.307
Standard
Deviation 1261.532
Sample
Variance 1374303
Sample
Variance 1591463
Kurtosis -0.97967 Kurtosis -1.40951
Skewness -0.48926 Skewness -0.49647
Range 3786 Range 3544
Minimum 9140 Minimum 8719
Maximum 12926 Maximum 12263
Sum 230208 Sum 213716
Count 20 Count 20
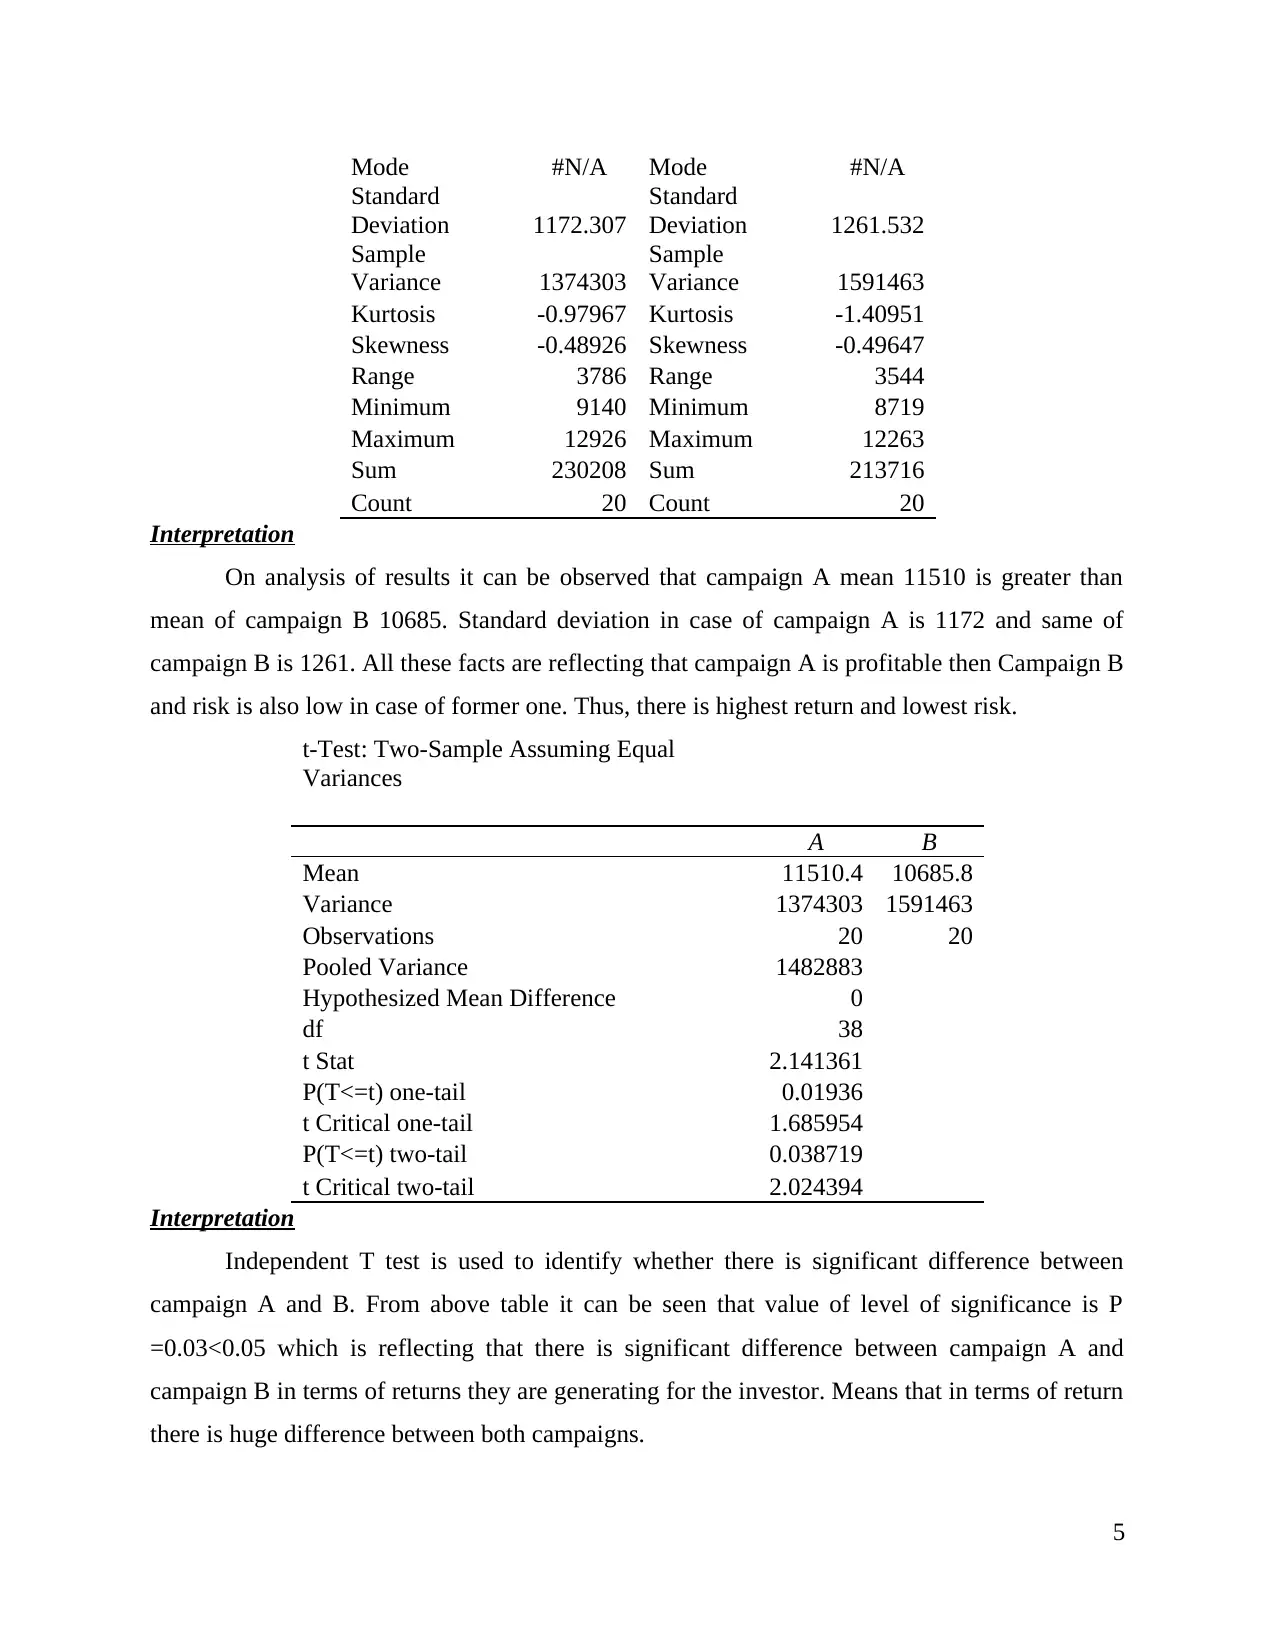
Interpretation
On analysis of results it can be observed that campaign A mean 11510 is greater than
mean of campaign B 10685. Standard deviation in case of campaign A is 1172 and same of
campaign B is 1261. All these facts are reflecting that campaign A is profitable then Campaign B
and risk is also low in case of former one. Thus, there is highest return and lowest risk.
t-Test: Two-Sample Assuming Equal
Variances
A B
Mean 11510.4 10685.8
Variance 1374303 1591463
Observations 20 20
Pooled Variance 1482883
Hypothesized Mean Difference 0
df 38
t Stat 2.141361
P(T<=t) one-tail 0.01936
t Critical one-tail 1.685954
P(T<=t) two-tail 0.038719
t Critical two-tail 2.024394
Interpretation
Independent T test is used to identify whether there is significant difference between
campaign A and B. From above table it can be seen that value of level of significance is P
=0.03<0.05 which is reflecting that there is significant difference between campaign A and
campaign B in terms of returns they are generating for the investor. Means that in terms of return
there is huge difference between both campaigns.
5
Standard
Deviation 1172.307
Standard
Deviation 1261.532
Sample
Variance 1374303
Sample
Variance 1591463
Kurtosis -0.97967 Kurtosis -1.40951
Skewness -0.48926 Skewness -0.49647
Range 3786 Range 3544
Minimum 9140 Minimum 8719
Maximum 12926 Maximum 12263
Sum 230208 Sum 213716
Count 20 Count 20
Interpretation
On analysis of results it can be observed that campaign A mean 11510 is greater than
mean of campaign B 10685. Standard deviation in case of campaign A is 1172 and same of
campaign B is 1261. All these facts are reflecting that campaign A is profitable then Campaign B
and risk is also low in case of former one. Thus, there is highest return and lowest risk.
t-Test: Two-Sample Assuming Equal
Variances
A B
Mean 11510.4 10685.8
Variance 1374303 1591463
Observations 20 20
Pooled Variance 1482883
Hypothesized Mean Difference 0
df 38
t Stat 2.141361
P(T<=t) one-tail 0.01936
t Critical one-tail 1.685954
P(T<=t) two-tail 0.038719
t Critical two-tail 2.024394
Interpretation
Independent T test is used to identify whether there is significant difference between
campaign A and B. From above table it can be seen that value of level of significance is P
=0.03<0.05 which is reflecting that there is significant difference between campaign A and
campaign B in terms of returns they are generating for the investor. Means that in terms of return
there is huge difference between both campaigns.
5
Paraphrase This Document
Need a fresh take? Get an instant paraphrase of this document with our AI Paraphraser
Task C
Analysis of facts
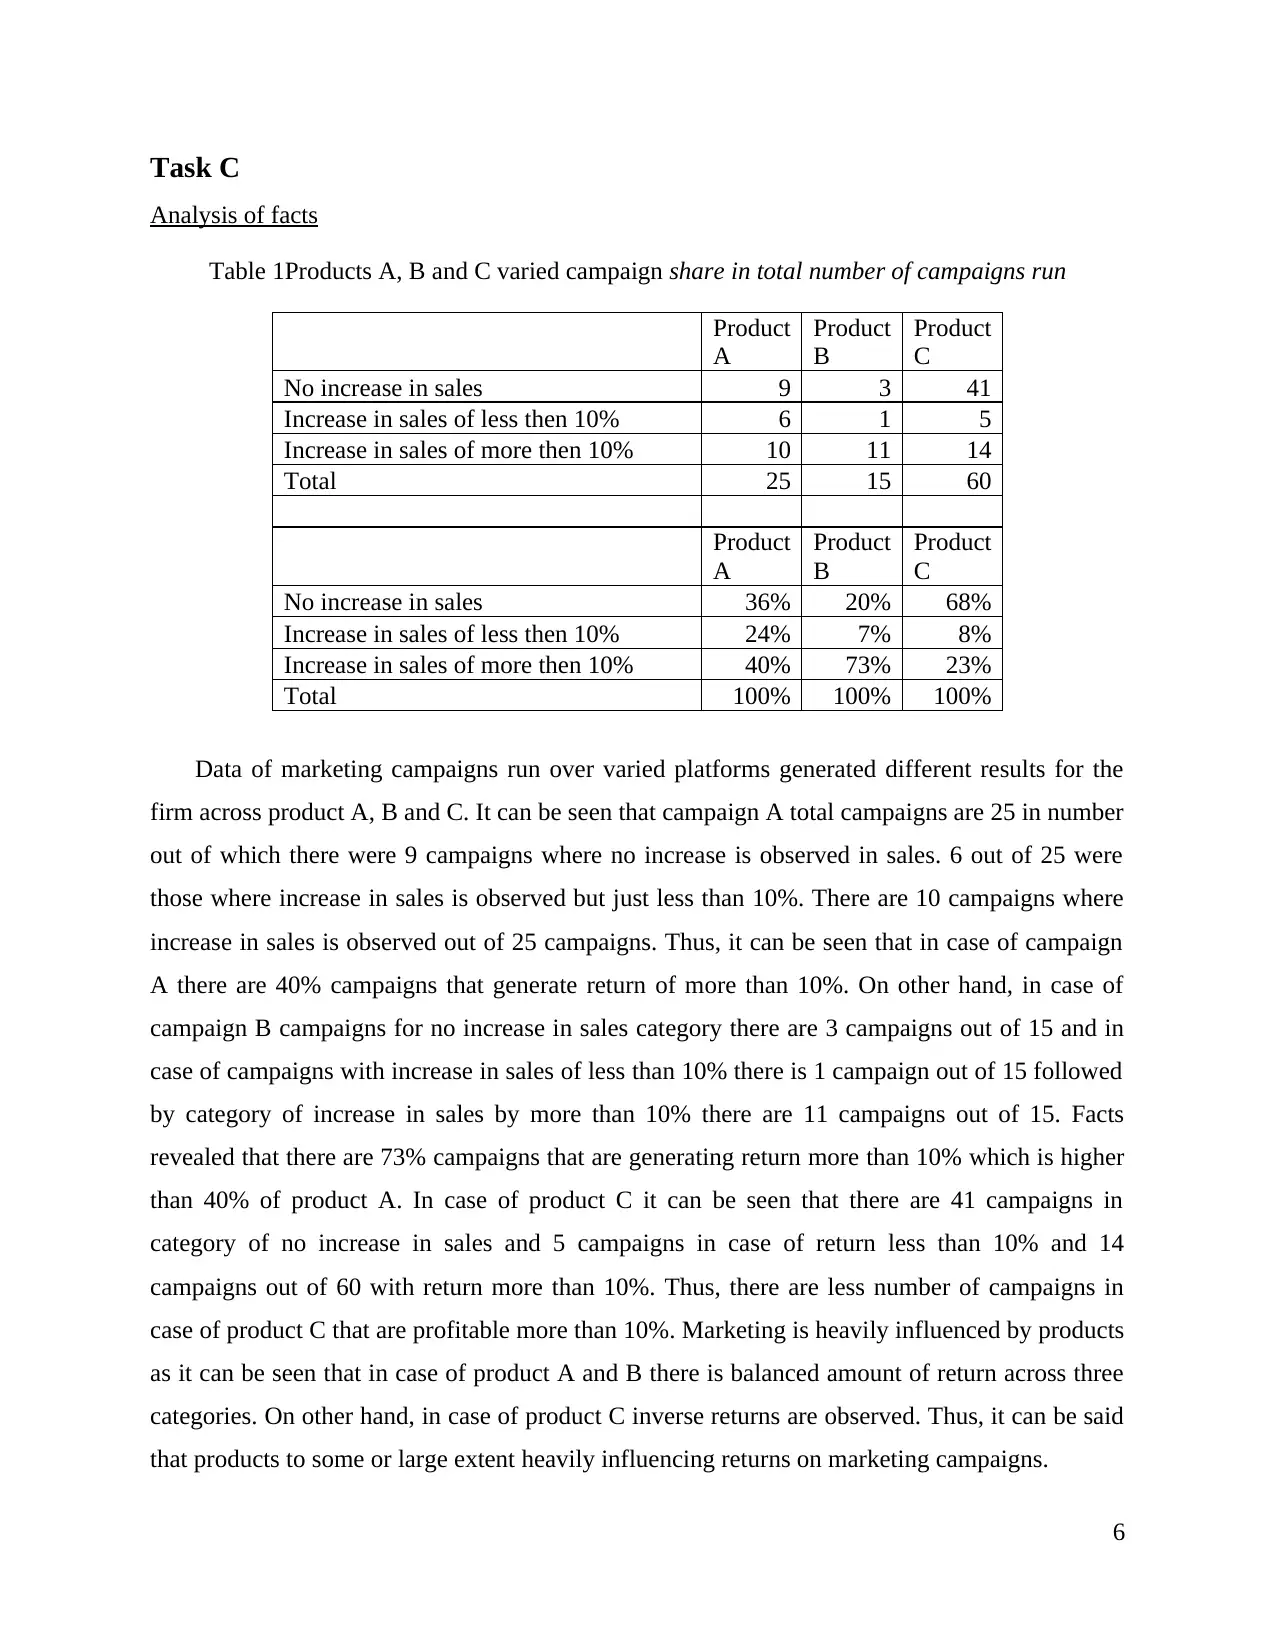
Table 1Products A, B and C varied campaign share in total number of campaigns run
Product
A
Product
B
Product
C
No increase in sales 9 3 41
Increase in sales of less then 10% 6 1 5
Increase in sales of more then 10% 10 11 14
Total 25 15 60
Product
A
Product
B
Product
C
No increase in sales 36% 20% 68%
Increase in sales of less then 10% 24% 7% 8%
Increase in sales of more then 10% 40% 73% 23%
Total 100% 100% 100%
Data of marketing campaigns run over varied platforms generated different results for the
firm across product A, B and C. It can be seen that campaign A total campaigns are 25 in number
out of which there were 9 campaigns where no increase is observed in sales. 6 out of 25 were
those where increase in sales is observed but just less than 10%. There are 10 campaigns where
increase in sales is observed out of 25 campaigns. Thus, it can be seen that in case of campaign
A there are 40% campaigns that generate return of more than 10%. On other hand, in case of
campaign B campaigns for no increase in sales category there are 3 campaigns out of 15 and in
case of campaigns with increase in sales of less than 10% there is 1 campaign out of 15 followed
by category of increase in sales by more than 10% there are 11 campaigns out of 15. Facts
revealed that there are 73% campaigns that are generating return more than 10% which is higher
than 40% of product A. In case of product C it can be seen that there are 41 campaigns in
category of no increase in sales and 5 campaigns in case of return less than 10% and 14
campaigns out of 60 with return more than 10%. Thus, there are less number of campaigns in
case of product C that are profitable more than 10%. Marketing is heavily influenced by products
as it can be seen that in case of product A and B there is balanced amount of return across three
categories. On other hand, in case of product C inverse returns are observed. Thus, it can be said
that products to some or large extent heavily influencing returns on marketing campaigns.
6
Analysis of facts
Table 1Products A, B and C varied campaign share in total number of campaigns run
Product
A
Product
B
Product
C
No increase in sales 9 3 41
Increase in sales of less then 10% 6 1 5
Increase in sales of more then 10% 10 11 14
Total 25 15 60
Product
A
Product
B
Product
C
No increase in sales 36% 20% 68%
Increase in sales of less then 10% 24% 7% 8%
Increase in sales of more then 10% 40% 73% 23%
Total 100% 100% 100%
Data of marketing campaigns run over varied platforms generated different results for the
firm across product A, B and C. It can be seen that campaign A total campaigns are 25 in number
out of which there were 9 campaigns where no increase is observed in sales. 6 out of 25 were
those where increase in sales is observed but just less than 10%. There are 10 campaigns where
increase in sales is observed out of 25 campaigns. Thus, it can be seen that in case of campaign
A there are 40% campaigns that generate return of more than 10%. On other hand, in case of
campaign B campaigns for no increase in sales category there are 3 campaigns out of 15 and in
case of campaigns with increase in sales of less than 10% there is 1 campaign out of 15 followed
by category of increase in sales by more than 10% there are 11 campaigns out of 15. Facts
revealed that there are 73% campaigns that are generating return more than 10% which is higher
than 40% of product A. In case of product C it can be seen that there are 41 campaigns in
category of no increase in sales and 5 campaigns in case of return less than 10% and 14
campaigns out of 60 with return more than 10%. Thus, there are less number of campaigns in
case of product C that are profitable more than 10%. Marketing is heavily influenced by products
as it can be seen that in case of product A and B there is balanced amount of return across three
categories. On other hand, in case of product C inverse returns are observed. Thus, it can be said
that products to some or large extent heavily influencing returns on marketing campaigns.
6

CONCLUSION
It is concluded that there is great importance of statistics for the managers because by using
same business performance can be evaluated to great extent and areas where work need to be
done can be identified. This lead to improvement in business performance. Hence, managers
must greatly use statistics in the business.
7
⊘ This is a preview!⊘
Do you want full access?
Subscribe today to unlock all pages.
Trusted by 1+ million students worldwide
REFERENCES
Books and Journals
Little, T.D., Deboeck, P. and Wu, W., 2015. Longitudinal data analysis. Emerging Trends in the
Social and Behavioral Sciences: An Interdisciplinary, Searchable, and Linkable Resource.
pp.1-17.
Sik, K., 2015. Tradition or modernism in grammar teaching: deductive vs. inductive approaches.
Procedia-Social and Behavioral Sciences. 197. pp.2141-2144.
Silverman, B.W., 2018. Density estimation for statistics and data analysis. Routledge.
Tyanova, S. and et.al., 2016. The Perseus computational platform for comprehensive analysis of
(prote) omics data. Nature methods. 13(9). p.731.
Online
What is Regression Testing? Definition, Test Cases (Example)., 2019. [Online]. Available
through:< https://www.guru99.com/regression-testing.html>.
8
1 out of 10
Related Documents


Your All-in-One AI-Powered Toolkit for Academic Success.
+13062052269
info@desklib.com
Available 24*7 on WhatsApp / Email
![[object Object]](/_next/static/media/star-bottom.7253800d.svg)
Unlock your academic potential
Copyright © 2020–2026 A2Z Services. All Rights Reserved. Developed and managed by ZUCOL.