Statistics for Management: Comprehensive Statistical Analysis Report
VerifiedAdded on 2020/07/22
|19
|3977
|326
Report
AI Summary
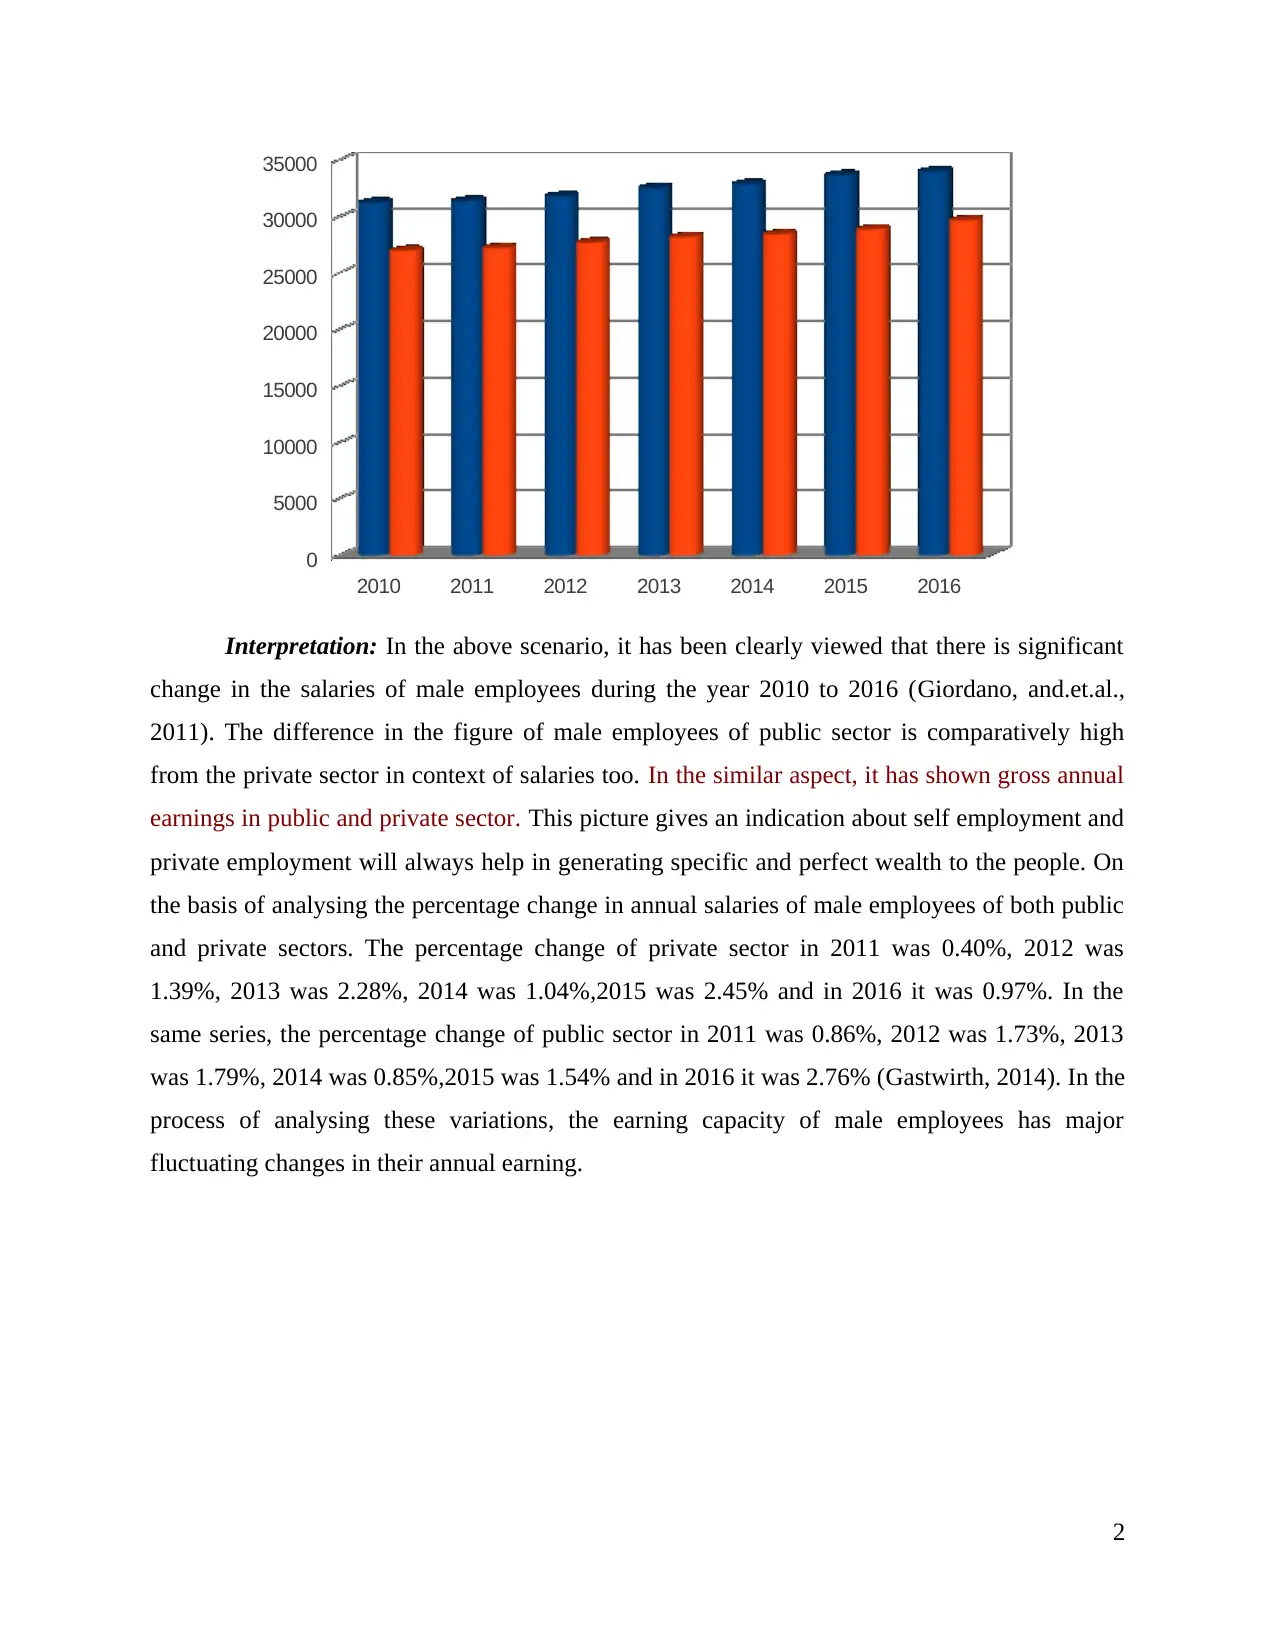
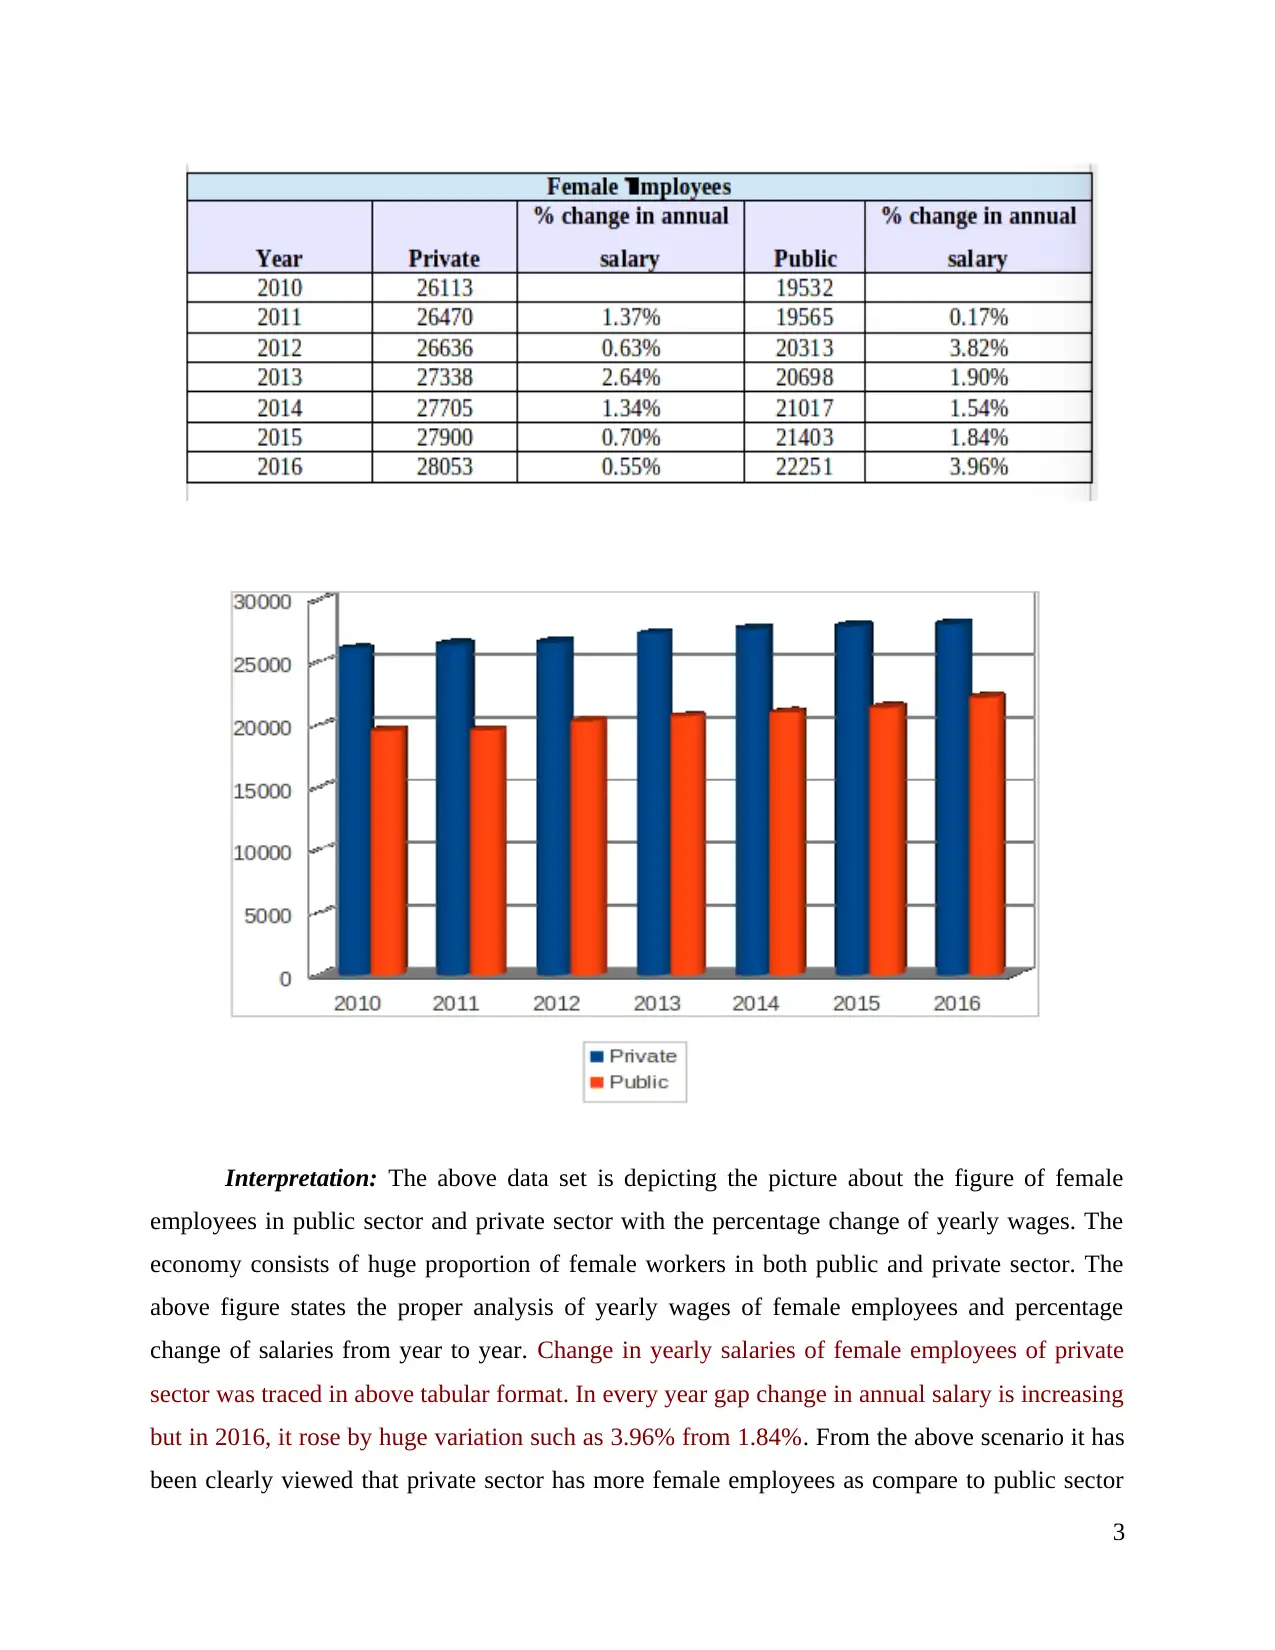
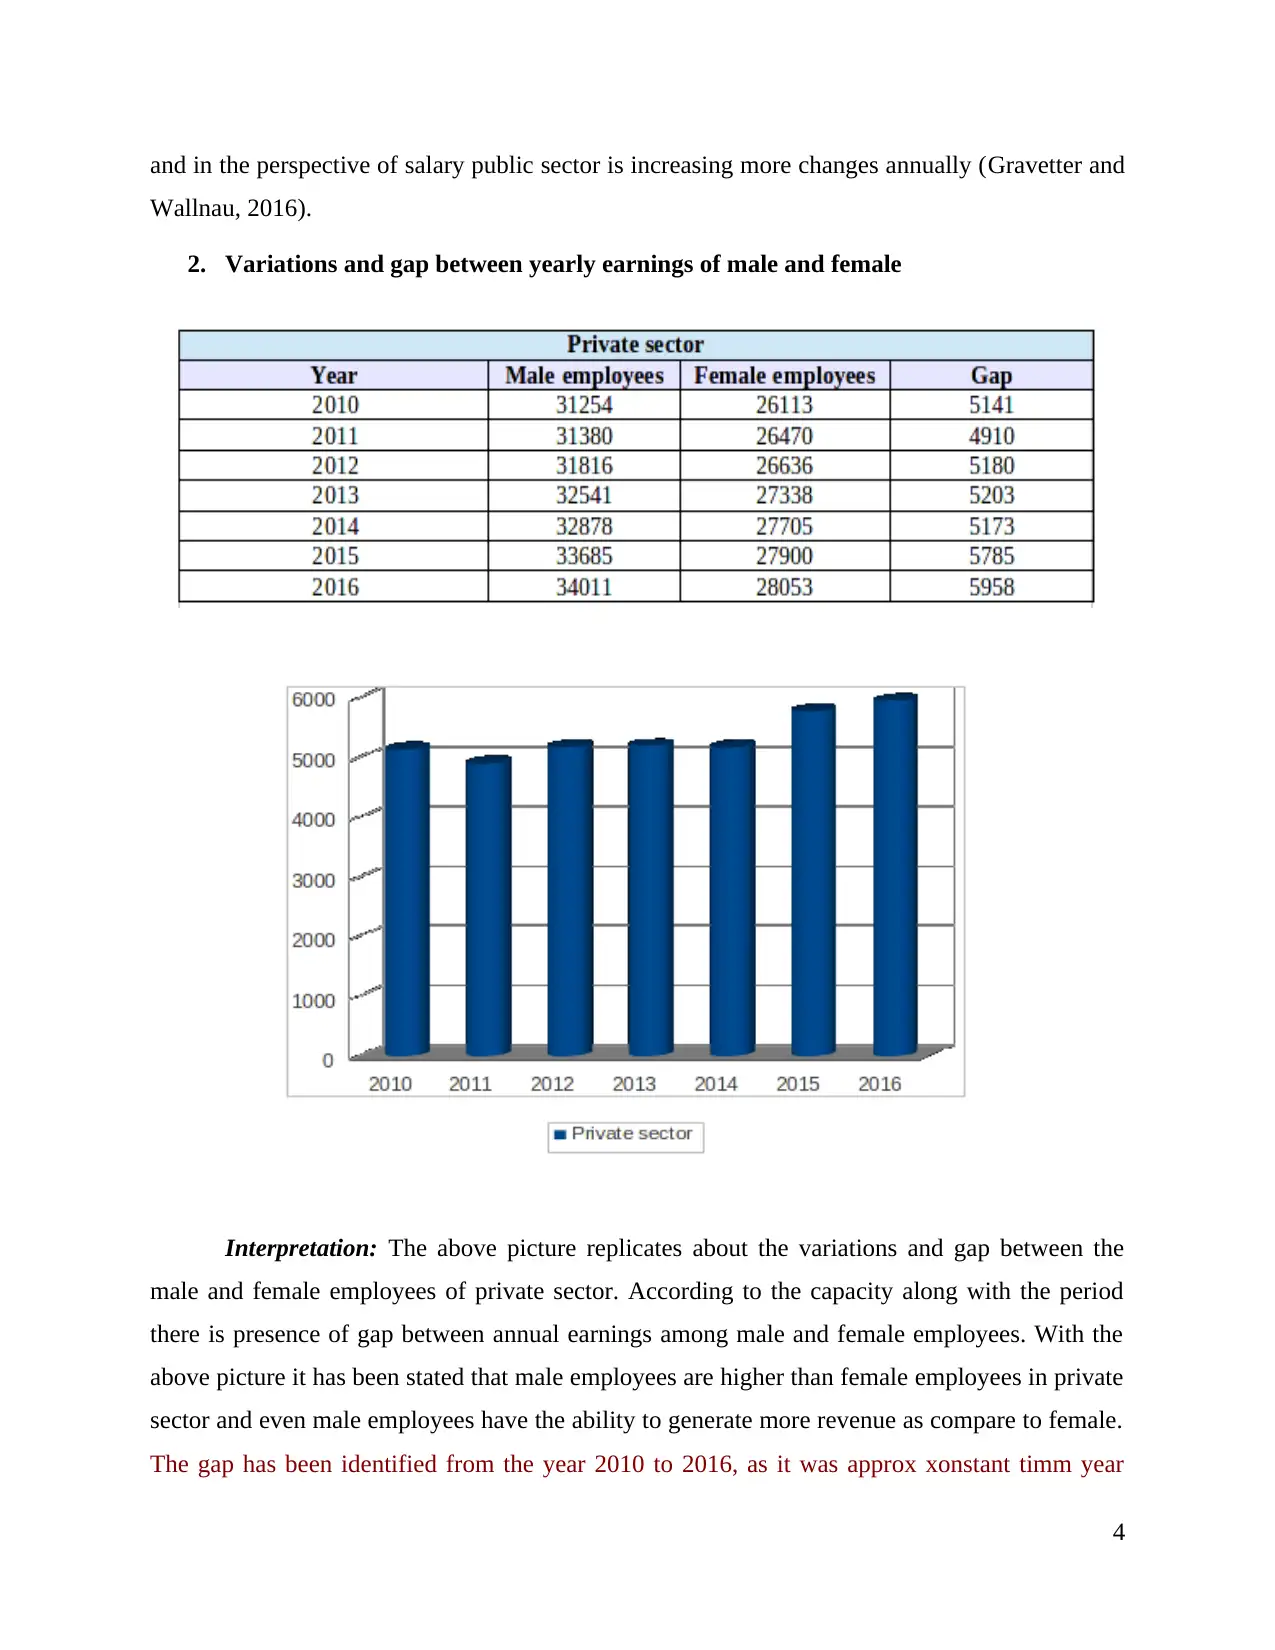
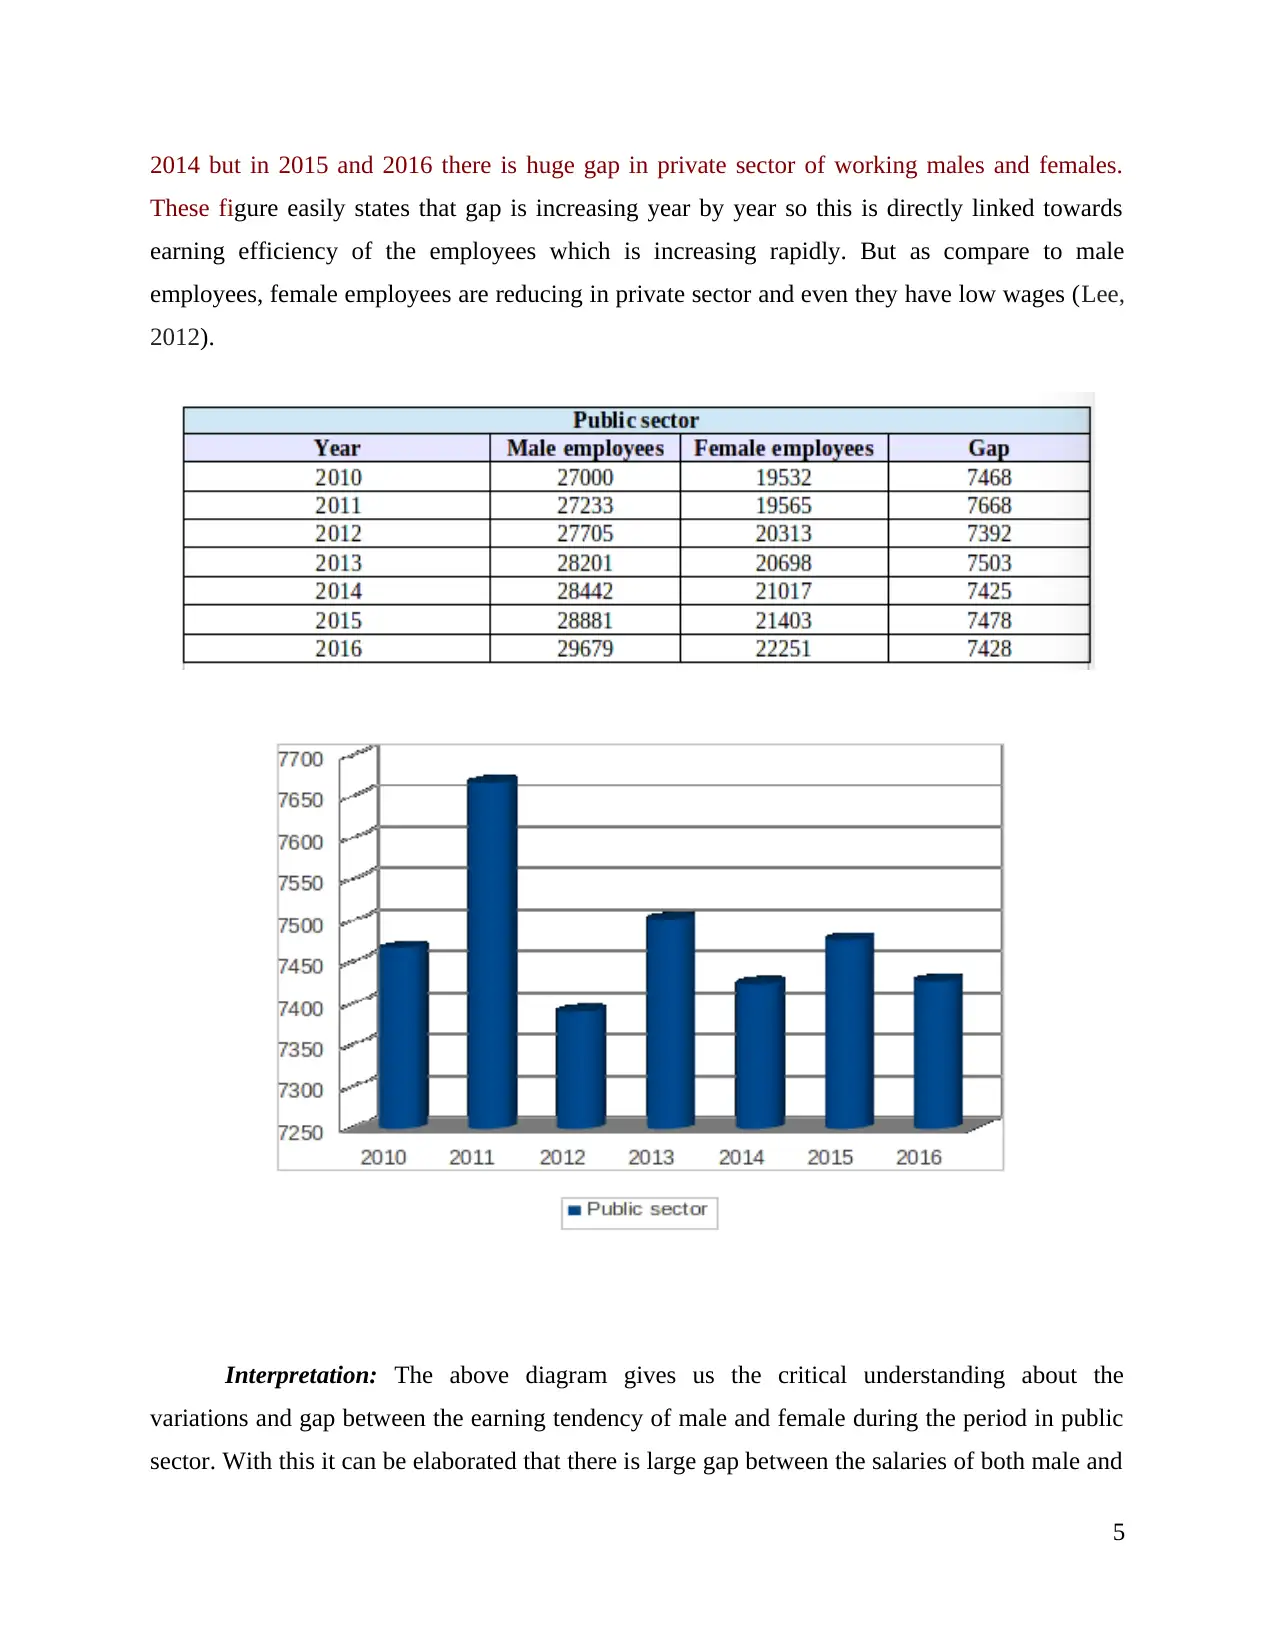
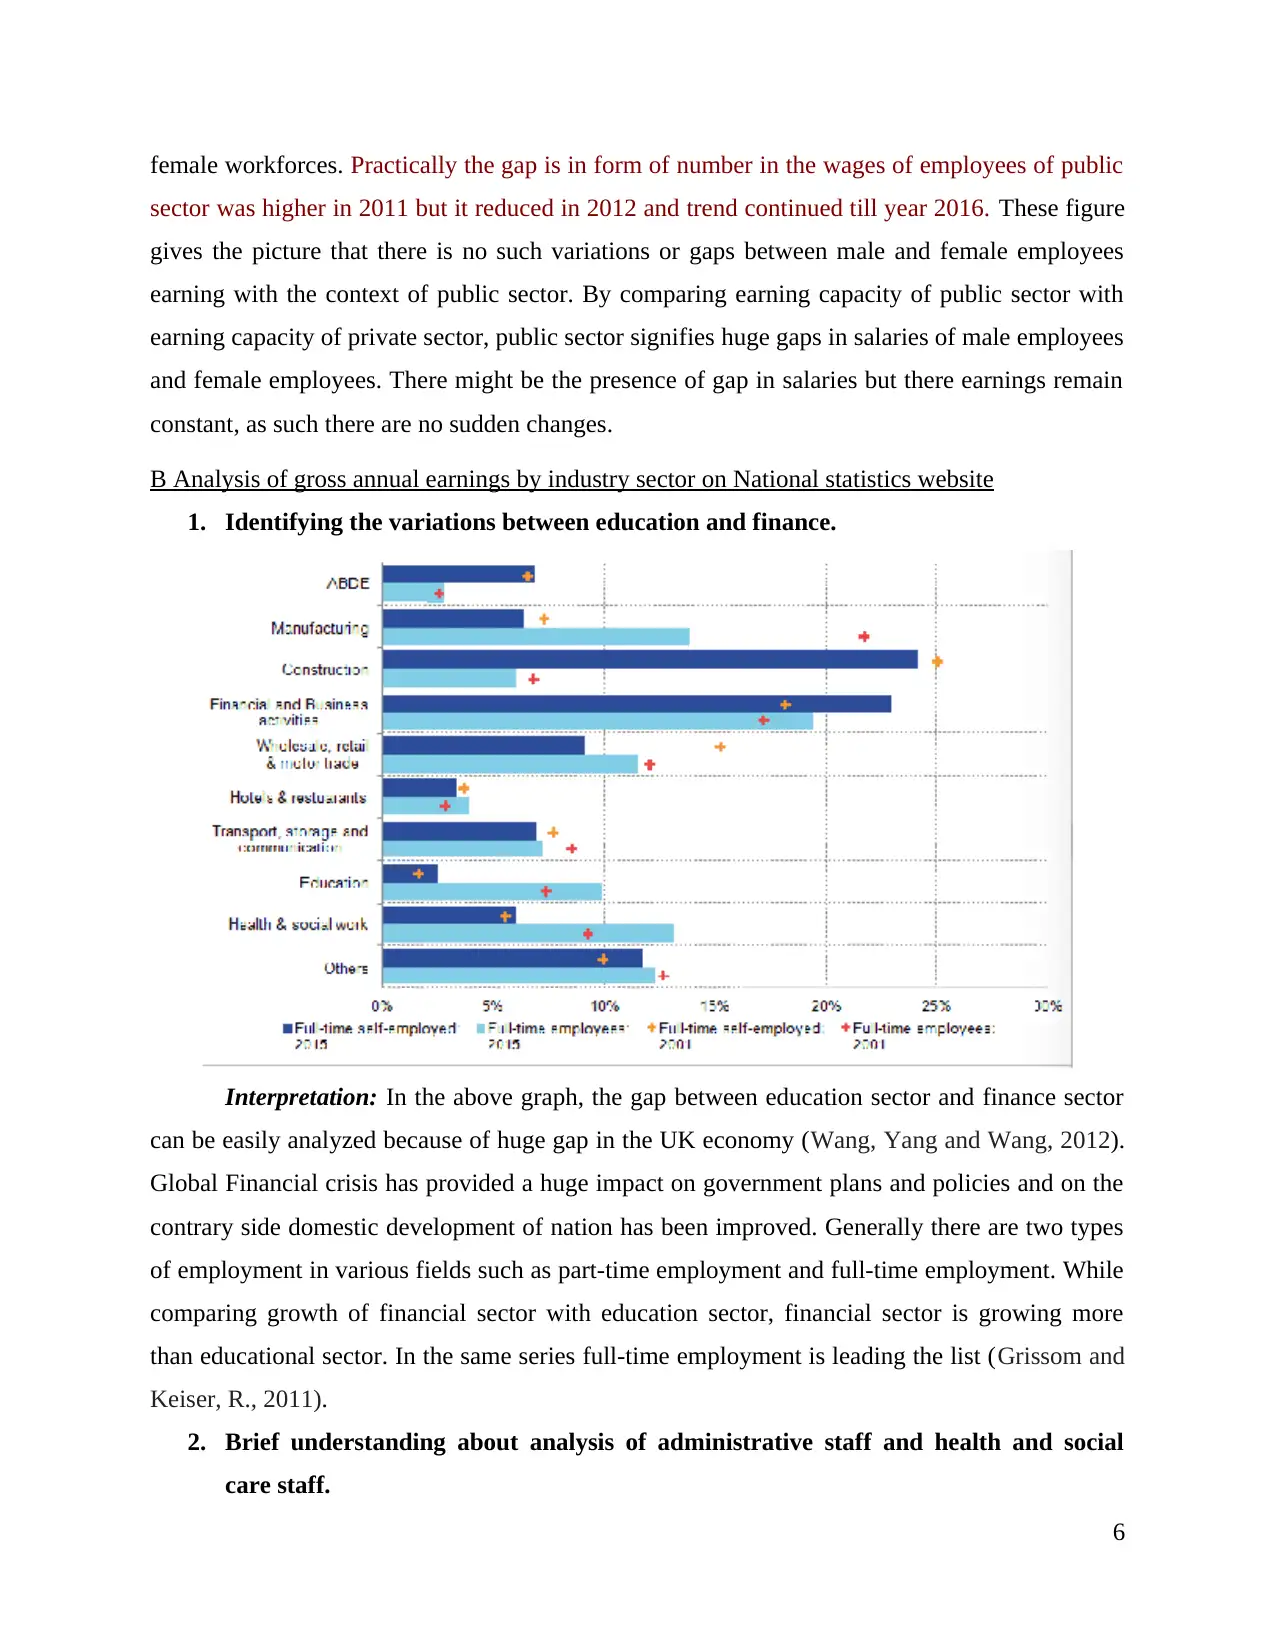
This report provides a comprehensive statistical analysis for management, focusing on various aspects of data analysis and interpretation. It begins with an introduction outlining the use of statistical tools in determining data sets for favorable outcomes within firms, particularly in accounting and finance. The report then delves into Activity 1, which analyzes gross annual earnings in both public and private sectors, comparing male and female worker salaries from 2010 to 2016. It also examines variations and gaps in yearly earnings between genders. Activity 2 explores the analysis of gross annual earnings by industry sector, using data from the National Statistics website, with a focus on education versus finance, and administrative versus health and social care staff. This section also includes the analysis of hourly payments across different regions in the UK, using statistical measures like mean, mode, median, and standard deviation. Activity 3 analyzes the number of annual deliveries made by suppliers, identifying the Economic Order Quantity (EOQ) and recommending a total variable cost model. Finally, Activity 4 presents line charts and Ogive charts to identify gross earnings of male and female workers and cumulative sales percentages, respectively. The report concludes with a summary of findings and references.

STATISTICS FOR
MANAGEMENT
MANAGEMENT
Paraphrase This Document
Need a fresh take? Get an instant paraphrase of this document with our AI Paraphraser

TABLE OF CONTENTS
INTRODUCTION...........................................................................................................................1
ACTIVITY 1....................................................................................................................................1
A Information related to annual earning................................................................................1
B Analysis of gross annual earnings by industry sector on National statistics website.........6
ACTIVITY 2....................................................................................................................................7
ACTIVITY 3..................................................................................................................................10
A Analysis the numbers of annual deliveries made by suppliers.........................................10
B Number of bags were being delivered in each period......................................................10
C Identifying the EOQ..........................................................................................................11
D. Recommendation for total variable cost model...............................................................12
ACTIVITY 4..................................................................................................................................13
A Preparation of line chart which identifies the gross earning of male and female workers
during 2010 to 2016..............................................................................................................13
B. Presentation of Ogive chart which identifies the cumulative % of sales.........................15
CONCLUSION..............................................................................................................................15
REFERENCES..............................................................................................................................16

INTRODUCTION
To determine data set and have the favourable outcomes on which firms implicate
various measuring techniques. There are mainly use of accounting, financial and statistical tools.
However, implicating such techniques which gives appropriate analysis through all the
operational framework. Moreover, in the present assessment there will be determination of
various facts and figures which comprises with the statistical data. It consists of analysing the
data set which contains the detailed annual salaries of male and female workers in the private and
public sectors of jobs. There will be measurements of the order quantity based on Economic
Order Quantity technique which ascertains the reorder level of organisation. The influences of
mean, mode, median techniques will bring the appropriate outcomes to the researchers on which
they will generate appropriate decisions and changes in operational activities.
ACTIVITY 1
A Information related to annual earning
1. Gross annual earning in public and private sector:
In the public and private sector there is small but positive changes in gross annual salaries from
the year 2010. There is drastic and strong effect in wages which are acquired by male and female
employees in public and private sector such as:
Male Workers
Year Private
% change in yearly
wages Public
% change in yearly
wages
2010 31254 27000
2011 31380 0.40% 27233 0.86%
2012 31816 1.39% 27705 1.73%
2013 32541 2.28% 28201 1.79%
2014 32878 1.04% 28442 0.85%
2015 33685 2.45% 28881 1.54%
2016 34011 0.97% 29679 2.76%
1
⊘ This is a preview!⊘
Do you want full access?
Subscribe today to unlock all pages.

Trusted by 1+ million students worldwide

2010 2011 2012 2013 2014 2015 2016
0
5000
10000
15000
20000
25000
30000
35000
Interpretation: In the above scenario, it has been clearly viewed that there is significant
change in the salaries of male employees during the year 2010 to 2016 (Giordano, and.et.al.,
2011). The difference in the figure of male employees of public sector is comparatively high
from the private sector in context of salaries too. In the similar aspect, it has shown gross annual
earnings in public and private sector. This picture gives an indication about self employment and
private employment will always help in generating specific and perfect wealth to the people. On
the basis of analysing the percentage change in annual salaries of male employees of both public
and private sectors. The percentage change of private sector in 2011 was 0.40%, 2012 was
1.39%, 2013 was 2.28%, 2014 was 1.04%,2015 was 2.45% and in 2016 it was 0.97%. In the
same series, the percentage change of public sector in 2011 was 0.86%, 2012 was 1.73%, 2013
was 1.79%, 2014 was 0.85%,2015 was 1.54% and in 2016 it was 2.76% (Gastwirth, 2014). In the
process of analysing these variations, the earning capacity of male employees has major
fluctuating changes in their annual earning.
2
Paraphrase This Document
Need a fresh take? Get an instant paraphrase of this document with our AI Paraphraser

Interpretation: The above data set is depicting the picture about the figure of female
employees in public sector and private sector with the percentage change of yearly wages. The
economy consists of huge proportion of female workers in both public and private sector. The
above figure states the proper analysis of yearly wages of female employees and percentage
change of salaries from year to year. Change in yearly salaries of female employees of private
sector was traced in above tabular format. In every year gap change in annual salary is increasing
but in 2016, it rose by huge variation such as 3.96% from 1.84%. From the above scenario it has
been clearly viewed that private sector has more female employees as compare to public sector
3

and in the perspective of salary public sector is increasing more changes annually (Gravetter and
Wallnau, 2016).
2. Variations and gap between yearly earnings of male and female
Interpretation: The above picture replicates about the variations and gap between the
male and female employees of private sector. According to the capacity along with the period
there is presence of gap between annual earnings among male and female employees. With the
above picture it has been stated that male employees are higher than female employees in private
sector and even male employees have the ability to generate more revenue as compare to female.
The gap has been identified from the year 2010 to 2016, as it was approx xonstant timm year
4
⊘ This is a preview!⊘
Do you want full access?
Subscribe today to unlock all pages.

Trusted by 1+ million students worldwide

2014 but in 2015 and 2016 there is huge gap in private sector of working males and females.
These figure easily states that gap is increasing year by year so this is directly linked towards
earning efficiency of the employees which is increasing rapidly. But as compare to male
employees, female employees are reducing in private sector and even they have low wages (Lee,
2012).
Interpretation: The above diagram gives us the critical understanding about the
variations and gap between the earning tendency of male and female during the period in public
sector. With this it can be elaborated that there is large gap between the salaries of both male and
5
Paraphrase This Document
Need a fresh take? Get an instant paraphrase of this document with our AI Paraphraser

female workforces. Practically the gap is in form of number in the wages of employees of public
sector was higher in 2011 but it reduced in 2012 and trend continued till year 2016. These figure
gives the picture that there is no such variations or gaps between male and female employees
earning with the context of public sector. By comparing earning capacity of public sector with
earning capacity of private sector, public sector signifies huge gaps in salaries of male employees
and female employees. There might be the presence of gap in salaries but there earnings remain
constant, as such there are no sudden changes.
B Analysis of gross annual earnings by industry sector on National statistics website
1. Identifying the variations between education and finance.
Interpretation: In the above graph, the gap between education sector and finance sector
can be easily analyzed because of huge gap in the UK economy (Wang, Yang and Wang, 2012).
Global Financial crisis has provided a huge impact on government plans and policies and on the
contrary side domestic development of nation has been improved. Generally there are two types
of employment in various fields such as part-time employment and full-time employment. While
comparing growth of financial sector with education sector, financial sector is growing more
than educational sector. In the same series full-time employment is leading the list (Grissom and
Keiser, R., 2011).
2. Brief understanding about analysis of administrative staff and health and social
care staff.
6

Interpretation: The above chart signifies about various information which is helping in
the analysis of fruitfulness of social care sector and health sector and even administrative
departments. Higher growth can be observed from the perspective of long term health and social
care services. For improving health care department, the UK government should be able to make
plans according to this. It will lead to have sufficient amount of increment on the basis of growth
and profitability. Usually the revenue which has been generated should be retained by country
which are mainly via services and efforts which are made by health and care department.
ACTIVITY 2
1. The hourly payment of various regions in UK
There is proper estimation and analysis of hourly payments in the various region of UK, for
determining of the statistical measurements in the context of proposed data set. Statistical
techniques like mean, mode, median and standard deviations (Turkyilmaz and.et.al, 2011).
2.1.A Median estimate
Mean
7
⊘ This is a preview!⊘
Do you want full access?
Subscribe today to unlock all pages.

Trusted by 1+ million students worldwide

Median
Interpretation: The above table gives an analysis of Ogive chart, which is measuring
specific mean, mode and median analysis. This is measuring the earning capacity such as
workers who worked below 10 hours has margin capacity of 8%, the revenue generated is 46%
of worker who worked 10-20 hour, between 20- 30 hours has produced revenue of 26%, between
30-40 hours has produced revenue of 14% and between 40-50 hours has generated revenue of
6%. In the same series the median analysis is 19.13 gives a result that 10-20 and 20-30 hours
workers are creating more efficiency and revenue as compared to other category of workers. The
mean value of 21.4 giving a positive side for determination of fruitfulness of sales personnel
earnings (Shonin, Van Gordon. And Griffiths., 2014).
2.1.B Standard deviation
8
Paraphrase This Document
Need a fresh take? Get an instant paraphrase of this document with our AI Paraphraser

Interpretation: The above table gives us the analysis of standard deviation of the given
data set as per hourly work done by the employees of South east workers (Wan, Wang and Tong,
, 2014). The mean value of the given data set is 21.4 which will be proper for analysis. The data
set gives the standard deviation of 10.15 which is less than compared to mean of the data set.
Thus, it is giving positive side that margin of labor force who are working hourly is appropriate.
B. Comparison of earnings of two regions
Interpretation: For the proper analysis of the earning capacity by statistical
measurements of two regions of UK can be done by mean, median and standard deviation of
North west employees and South east employees. During the analysis it has been clarified that
South east consists of more efficient employees as compared to North west region. The mean
value of North west and South east is 16.70 and 21.4 respectively, so mean value of south east is
more favorable in the prospective of better earnings and generating more revenue by the
employees. The outcome of standard deviation of both regions has major variations, north west
and south east as 7.4 and 10.15 respectively and in same series median value of this region are
14.50 and 19.13 respectively (Philippon and Reshef, 2012). So it can be said that there are
various changes in the outcomes. But on the basis of median analysis, north west consists of
more efficient workers. But in the overall analysis South east region has the perfect growth and
has more capability for generating revenue.
9

ACTIVITY 3
A Analysis the numbers of annual deliveries made by suppliers
In order to analyse the level of deliveries of rice bags made by suppliers in an operational
period to the supermarket, there will be implication of various techniques which will be helpful
in ascertaining the adequate analysis of the facts (Kuppuswamy and Bayus, 2018). Moreover, it
will be beneficial to the professionals in order to analyse the efficiency of and cost effectiveness
in business. Thus, the measurements are as follows:
Details Outcomes
No. of days (annually) 365
Supermarket off for 5 days
Total annual delivery 365 – 5 = 360 days
No. of days delivered 12
Industry made 30 deliveries annually
360 days /12 days = 30 deliveries
Interpretation: By considering the efficiency of business and suppliers it has been
analysed here that the suppliers are efficient in terms of making the 30 deliveries in an operating
period. The analysis is based on considering various conditions such as 5 days in a year the
supermarket has been closed in a year which ascertains that there are 360 days of working.
Moreover, there are 12 days on which the suppliers made deliveries to the supermarket. Thus, it
comprises with the outcomes that there are total 30 deliveries of rice bags has been performed by
suppliers.
B Number of bags were being delivered in each period
In relation with analysing the numbers of deliveries made by the rice bag suppliers in a
year. There will be need to analyse the numbers of bags which being delivered by them (Padon,
Maloney and Cappella, 2017). Therefore, in consideration with the previous outcomes there will
be measurements of no. of products which were being supplied by them.
Details
Outcomes
(In £)
Yearly demands 450000
No. of deliveries 30
10
⊘ This is a preview!⊘
Do you want full access?
Subscribe today to unlock all pages.

Trusted by 1+ million students worldwide
1 out of 19
Related Documents

Your All-in-One AI-Powered Toolkit for Academic Success.
+13062052269
info@desklib.com
Available 24*7 on WhatsApp / Email
Unlock your academic potential
Copyright © 2020–2025 A2Z Services. All Rights Reserved. Developed and managed by ZUCOL.