David Game College: Statistics for Management Report
VerifiedAdded on 2023/01/17
|30
|4113
|22
Report
AI Summary
This report provides a comprehensive overview of statistics for management, focusing on its application in the business context. It begins with an introduction to statistics, covering key features and various methods used for data gathering, analysis, and interpretation. The report then delves into the sources and types of data relevant to organizations like Samsung, exploring the differences between samples and populations. It highlights the importance of statistical methods in achieving competitive advantages, particularly for a company like Samsung operating in the digital industry. Furthermore, the report distinguishes between inferential and descriptive statistics, illustrating their consequences for business intelligence and decision-making. The analysis includes data from companies like Apple, Microsoft, Amazon, and Netflix, with detailed statistical summaries and regression analysis to support the findings. The report concludes by emphasizing the significance of statistical techniques in enhancing business performance and achieving organizational goals.

Statistics for Management
Paraphrase This Document
Need a fresh take? Get an instant paraphrase of this document with our AI Paraphraser
Table of Contents
Contents
INTRODUCTION...........................................................................................................................1
TASK 1............................................................................................................................................1
PART A...........................................................................................................................................1
1. Overview of statistics, with important features and overview of methods........................1
2. Sources and types of data or data, that organisation can assess.........................................2
3. Difference between a sample and a population..................................................................3
4. Importance of statistical methods to attain the competitive advantages for Samsung.......4
5. Distinguish among inferential statistics and descriptive with consequences for business
intelligence.............................................................................................................................4
PART B............................................................................................................................................6
REFERENCES..............................................................................................................................25
APPENDICES...............................................................................................................................26
INTRODUCTION
Statistics applies to a data gathering, structure, study and understanding in numerical
research. It offers a range of methods for modelling and forecasting organizational data, which
helps to make decisions about accounting, advertising as well as other services (Mendenhall and
Sincich, 2016). The current document will gather in-depth quantitative management
understanding, such as its use to solve company difficulties. Samsung is selected as a developer,
supplier and retailer in the UK for such a research, which deals with electronics. This includes
various sources and information forms, allowing businesses to track rivals' successful and
unsuccessful results in order to develop methods for enhancing their own output. To this end, the
importance of using statistical methods is also addressed in this document in order to meet the
respective company's business goals. In addition, important distinctions among empirical and
inferential statistics are illustrated, with consequences for business goals.
TASK 1
PART A
1. Overview of statistics, with important features and overview of methods
Using a variety of methods, analytics could be described as a resource for gathering,
analysing and interpreting significant data. This includes table, comparison through inference,
pattern prediction and much more, which are categorized as empirical and concise through two
types of metrics (Rasmussen and Ulrich, 2015). Statistics could be described as a calculus
department which really primarily deals with registering and analysing mathematical data, as per
Prof Bowled.
Main features of statistics:
Stats are composite of truths: Information gathered by statistical techniques rarely contains
individual or independent numbers, since it is difficult to compare these data, to draw a particular
conclusion (Cremers and Pareek, 2016).
Statistical data should be obtained in a logical way: the data must always be compiled
routinely, with an acceptable method, to take financial judgments or make a sensible conclusion
(Siva and et. al., 2016).
Data should be represented in quantitative sort: even data presented mathematically can be
used as statistical techniques. Thus subjective information such as intellect, attractiveness,
1
⊘ This is a preview!⊘
Do you want full access?
Subscribe today to unlock all pages.
Trusted by 1+ million students worldwide
including dismissive knowledge which could not be represented in quantitative type should not
be used on same (Kreps, 2019).
Overview of statistical methods:
As per the opinion of John Dillard, it is important to consider the adequate statistical
methods in the age of information to evaluate an information and infer the appropriate outcome.
It involves
Mean: this approach makes it easier to identify a general trend of a set of data in
evaluating the estimated value of broad data. But using this approach on information that has
distorted distribution can provide inaccurate information, which has a significant effect on the
result made to achieve business objectives (Martins and Isouard, 2015).
Hypothesis testing: This process, also recognized as probability testing that is used to
check if a theory is valid for a set of data, otherwise it will consider alternative hypothesis. In
probability theory we consider the null hypothesis unless the test's meaning value is higher than
that of the specified meaning point. Unless the meaning quality is lower than that of the
predicted meaning, otherwise the null hypothesis must be dismissed (Gerrish, 2016).
Standard deviations: It is applicable specifically to information that is widely distributed
for average, that allows to quickly determine the distribution of datasets. However, if results with
odd warbling such as large volumes of anomalies or anti-normal shrieked graph cannot be
collected by implementing standard approach of variance (Jiraporn, Leelalai and Tong, 2016).
Sample size determination: It is hard to obtain reliable results if calculating significant
population data such as business data about revenue, client base and much more. Thus, taking a
test of information with both the correct size is important in order to achieve an accurate number.
So if the survey doesn't include specified parameters, mistakes may also be created (Valenti and
et. al., 2017).
Correlation and Regression: All approaches were used to assess the interconnectedness or
partnership among any information which can be used to evaluate trends. In the regression study,
we calculate a coefficient of sample correlation, precisely the factor of similarity of Pearson
Consumer Moment. The coefficient of test association, marked r (Hubbard, 2015).
2. Sources and types of data or data, that organisation can assess
A company such as Samsung, that runs its digital company in different countries, could use
a number of sources to gain economic benefits. This includes statistical sources that are used to
2
Paraphrase This Document
Need a fresh take? Get an instant paraphrase of this document with our AI Paraphraser
gather data for official purposes such as census reporting and non-statistical sources that are used
to gather information for administrative purposes (Gerrish, 2016).
Methods of statistical information gathering:
Survey: This tool is also considered a survey sample used only to measure the features of
high population information. Using that same approach allows the company to easily determine
the present and past pattern, but it may also trigger mistake. Samsung could use this source to
gain input on both the product quality and products from consumers and other shareholders in
order to make more improvements (Wang and et. al., 2016).
Government and Semi-government sources: Such outlets include information on an
organization's local and national company performance, making it easy to accomplish a goal
through collection of data. Company executives could use this semi-statistical tool to gather data
on the strong position of their own company and other rivals operating in same industry.
Census: An evaluation of data is focused for each and every community object. The
benefit of using such an approach is that data becomes more relevant. It does, however, entail
high costs and time to process and process data (Jiraporn, Leelalai and Tong, 2016).
Types of statistical data:
Primary data: This contains qualitative raw business information, i.e. non-manufacturing
data that can be gathered from sources such as survey, questionnaire, and much more. Primary
information is 'genuine' in the context that they had not undergone quantitative activities and are
authentic (Hubbard, 2015).
Secondary data: This comprises of data that might be subject to empirical analysis and it
can be obtained by governmental and semi-governmental organization, newspapers as well as
further media sources. It indicates that - in the past certain authors or scholars have already
obtained it data and are available in either written or undisclosed type (Valenti and et. al., 2017).
3. Difference between a sample and a population
A community contains whole items from a specific information set about that measures
such as average, mean and method are used to infer desired outcome. But if a community
comprises of large amounts of data, then it is difficult to apply these techniques, as in such cases
the probability of failure is high. While test means larger data volume that is extracted from
either a larger population and contains each item that needs results to be obtained. Applying
statistical techniques to the test provides the advantage of measuring more reliable results to
3
slight or zero errors. One of the key difference between the population and sample is gathering of
data, as in population complete data form the data set is recognised whereas in sample only one
or more observations are considered to evaluate the key measures of research or survey
(Hubbard, 2015).
4. Importance of statistical methods to attain the competitive advantages for Samsung
In order to accomplish highly competitive strengths in digital industry, where rivalry is
strong, it is important that Samsung gather data about opponents ' last five years of success, their
sales, and much more. Notifying a director focused on teacher performance improvement is one
of the functions of metrics in industry. Most businesses often obtain around - the-job information
on employee satisfaction and morale, which can be monitored not just to keep workers engaged
but to also insure that they do not move elsewhere certain roles. Executives gathers key
information on the performance of workers, like the variety of tasks performed or the quantity
generated (Hubbard, 2015). In order to accomplish productivity, the information is analysed
parallel to organisational objective. Through implementing statistical techniques such as
comparison, variation analysis (ANNOVA), hypothesis testing, and much more, the
corresponding company's executives will take effective methods to enhance and boost financial
performance.
5. Distinguish among inferential statistics and descriptive with consequences for business
intelligence
Inferential and descriptive statistics are seen as two distinct sections of statistics which serve
to collect data, evaluate to analyse outcomes, but also with diverse goals. if the study depends on
inferential statistics and descriptive statistics, as usual people, lacks understanding of such two
types of statistics, is very hard to identify. Inferential statistics, as the aspects, are someone who
defines the community. Descriptive statistics identify the community through which information
could be obtained, while inferential helps by comparing the results out of the same population to
achieve the generalization. Depending on the surveys, descriptive statistics were used to
generalize the population. thus, among quantitative and linear regressions, i.e. what you do with
your data, there's a big difference. The fundamental distinction between offensive sections can
be clarified as follows:
It describes the probability of performance or business loss in an enterprise This approach
depicts visual data such as maps, graphs and charts.
4
⊘ This is a preview!⊘
Do you want full access?
Subscribe today to unlock all pages.
Trusted by 1+ million students worldwide
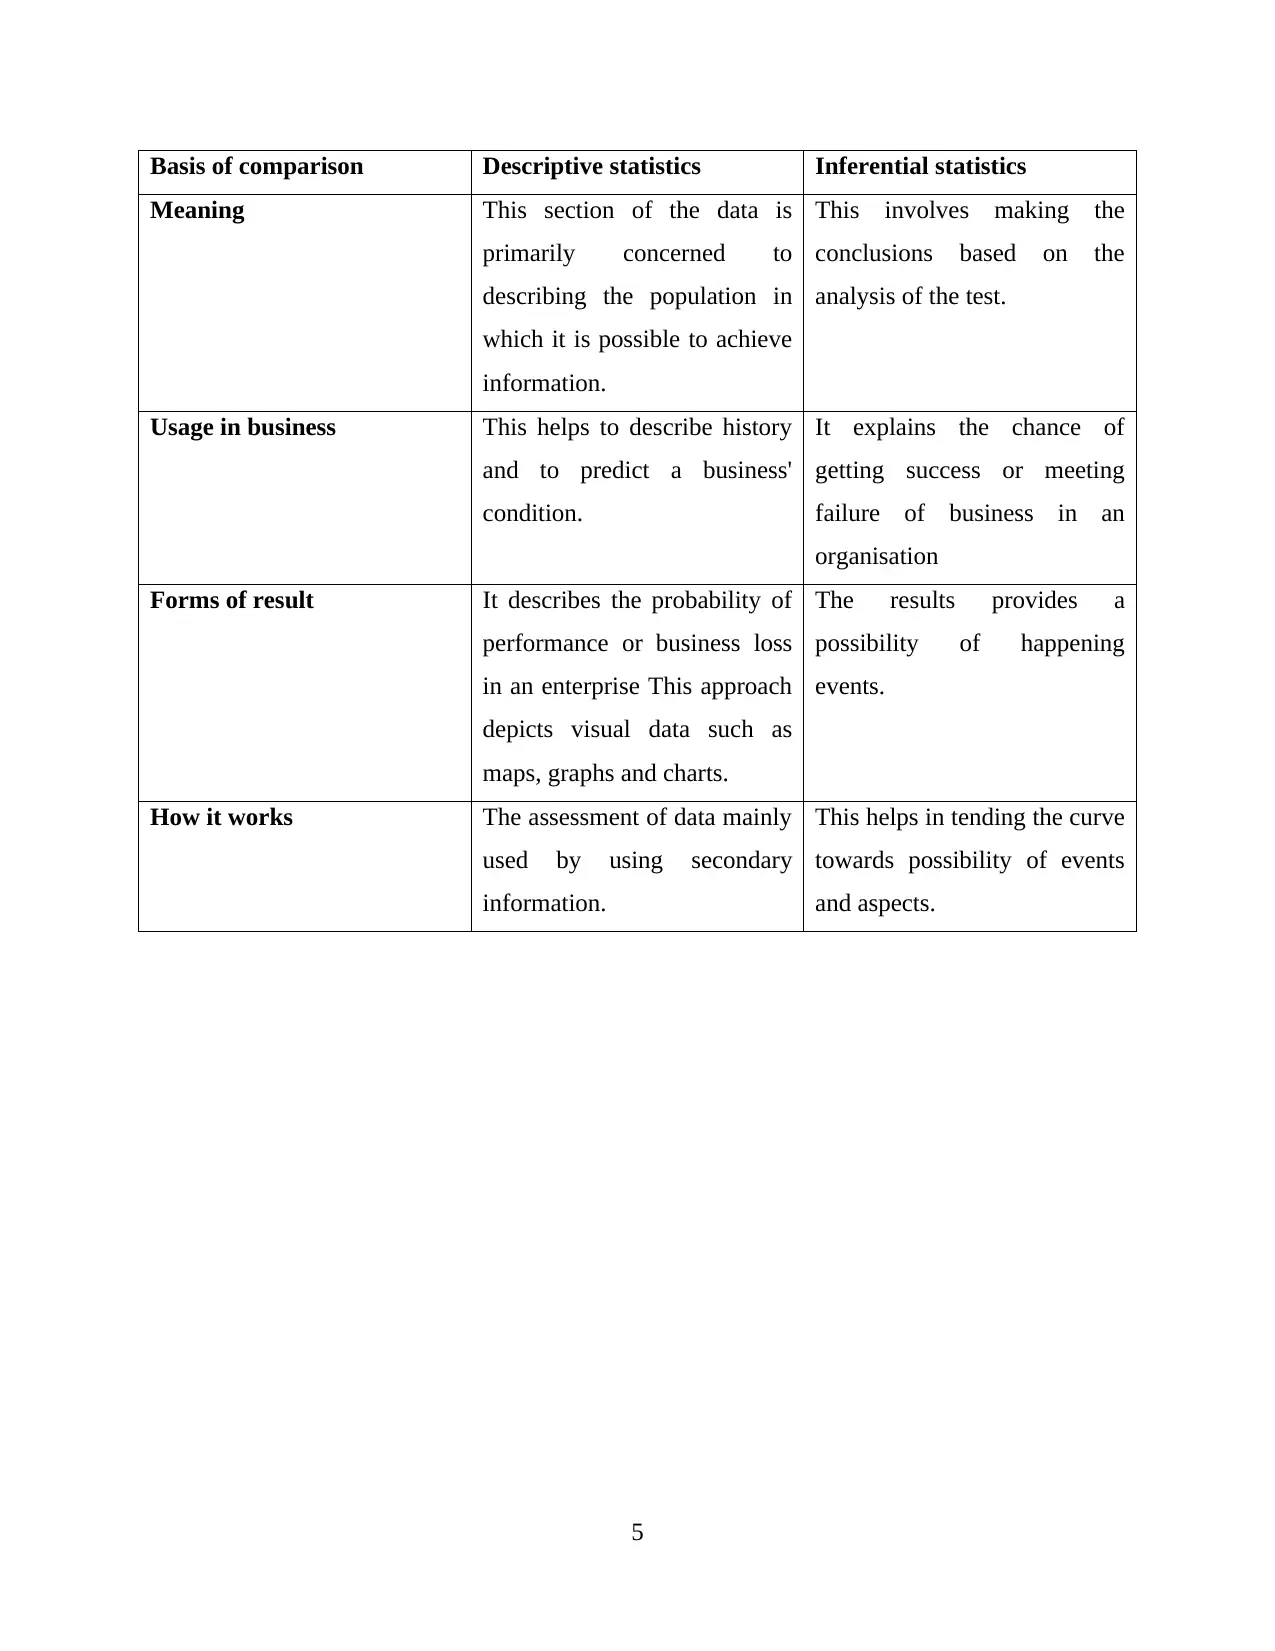
Basis of comparison Descriptive statistics Inferential statistics
Meaning This section of the data is
primarily concerned to
describing the population in
which it is possible to achieve
information.
This involves making the
conclusions based on the
analysis of the test.
Usage in business This helps to describe history
and to predict a business'
condition.
It explains the chance of
getting success or meeting
failure of business in an
organisation
Forms of result It describes the probability of
performance or business loss
in an enterprise This approach
depicts visual data such as
maps, graphs and charts.
The results provides a
possibility of happening
events.
How it works The assessment of data mainly
used by using secondary
information.
This helps in tending the curve
towards possibility of events
and aspects.
5
Paraphrase This Document
Need a fresh take? Get an instant paraphrase of this document with our AI Paraphraser
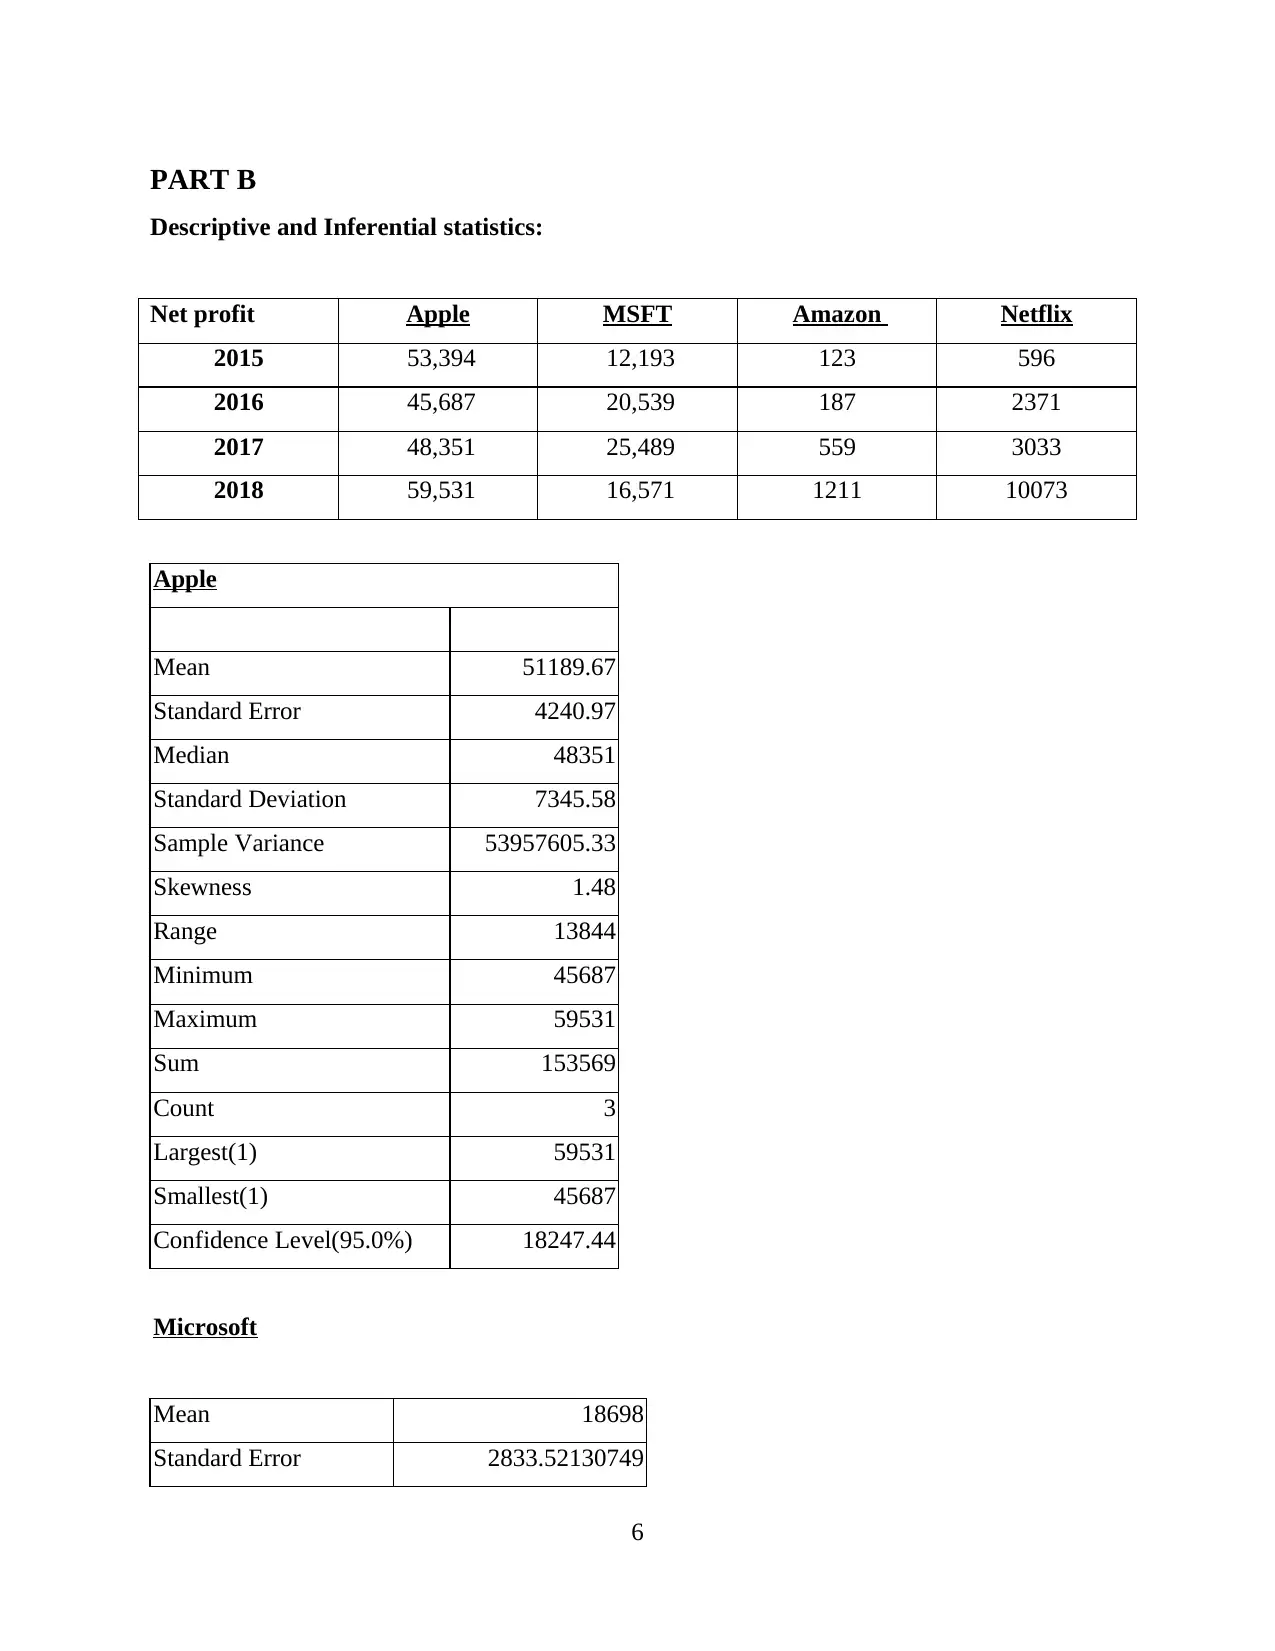
PART B
Descriptive and Inferential statistics:
Net profit Apple MSFT Amazon Netflix
2015 53,394 12,193 123 596
2016 45,687 20,539 187 2371
2017 48,351 25,489 559 3033
2018 59,531 16,571 1211 10073
Apple
Mean 51189.67
Standard Error 4240.97
Median 48351
Standard Deviation 7345.58
Sample Variance 53957605.33
Skewness 1.48
Range 13844
Minimum 45687
Maximum 59531
Sum 153569
Count 3
Largest(1) 59531
Smallest(1) 45687
Confidence Level(95.0%) 18247.44
Microsoft
Mean 18698
Standard Error 2833.52130749
6
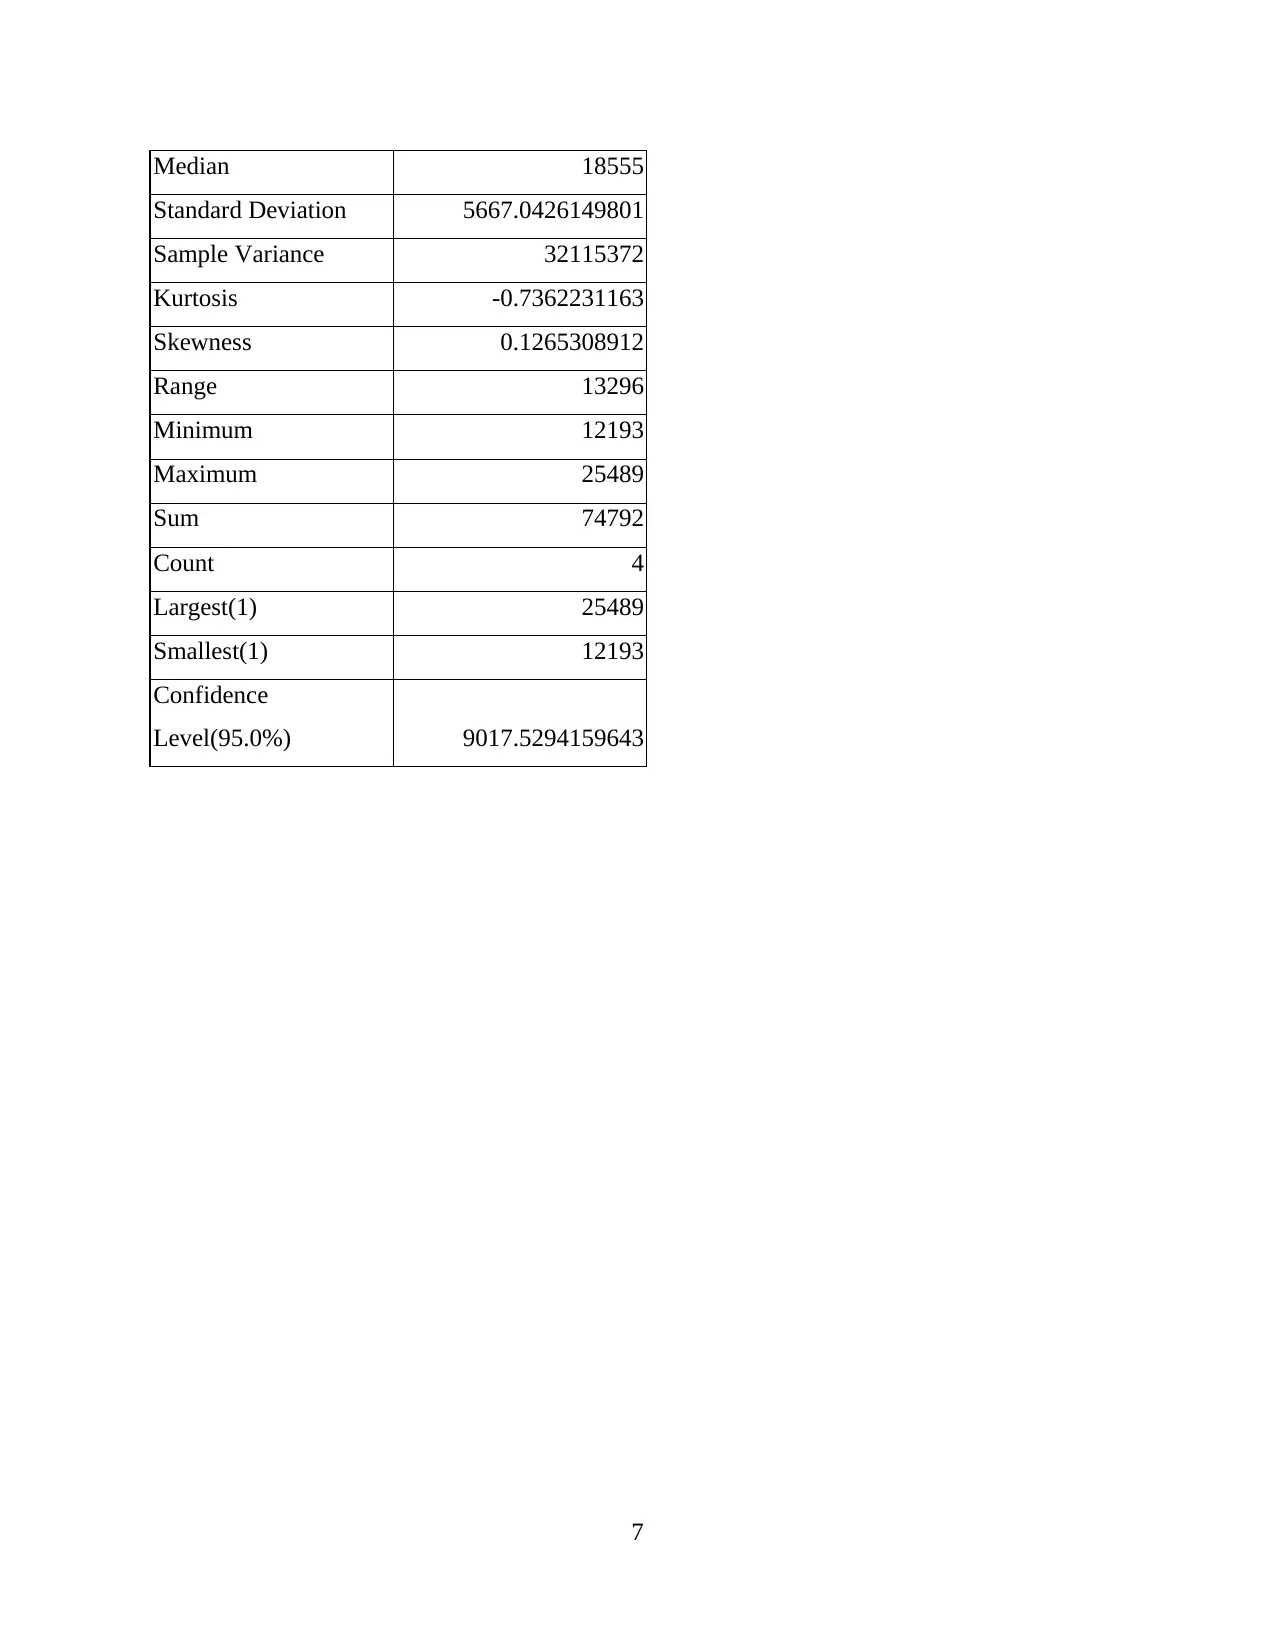
Median 18555
Standard Deviation 5667.0426149801
Sample Variance 32115372
Kurtosis -0.7362231163
Skewness 0.1265308912
Range 13296
Minimum 12193
Maximum 25489
Sum 74792
Count 4
Largest(1) 25489
Smallest(1) 12193
Confidence
Level(95.0%) 9017.5294159643
7
Standard Deviation 5667.0426149801
Sample Variance 32115372
Kurtosis -0.7362231163
Skewness 0.1265308912
Range 13296
Minimum 12193
Maximum 25489
Sum 74792
Count 4
Largest(1) 25489
Smallest(1) 12193
Confidence
Level(95.0%) 9017.5294159643
7
⊘ This is a preview!⊘
Do you want full access?
Subscribe today to unlock all pages.
Trusted by 1+ million students worldwide
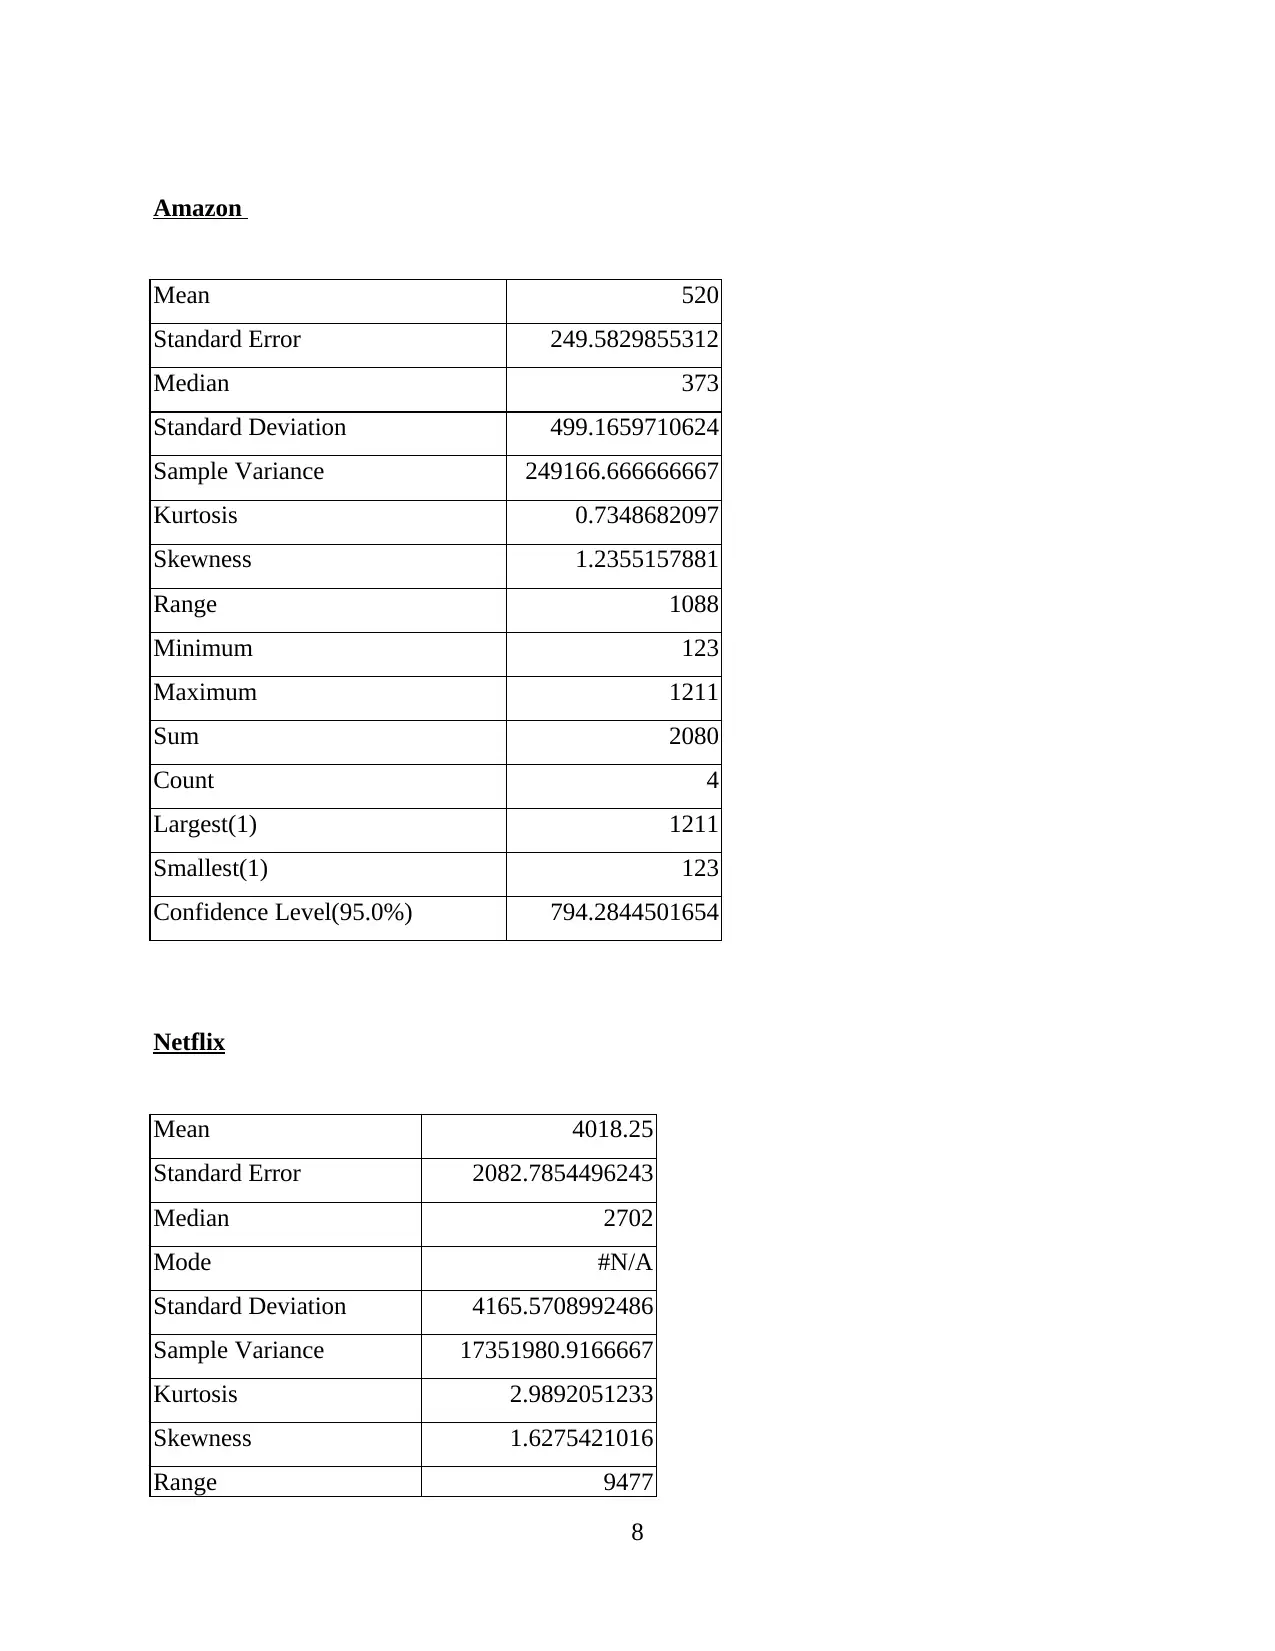
Amazon
Mean 520
Standard Error 249.5829855312
Median 373
Standard Deviation 499.1659710624
Sample Variance 249166.666666667
Kurtosis 0.7348682097
Skewness 1.2355157881
Range 1088
Minimum 123
Maximum 1211
Sum 2080
Count 4
Largest(1) 1211
Smallest(1) 123
Confidence Level(95.0%) 794.2844501654
Netflix
Mean 4018.25
Standard Error 2082.7854496243
Median 2702
Mode #N/A
Standard Deviation 4165.5708992486
Sample Variance 17351980.9166667
Kurtosis 2.9892051233
Skewness 1.6275421016
Range 9477
8
Paraphrase This Document
Need a fresh take? Get an instant paraphrase of this document with our AI Paraphraser
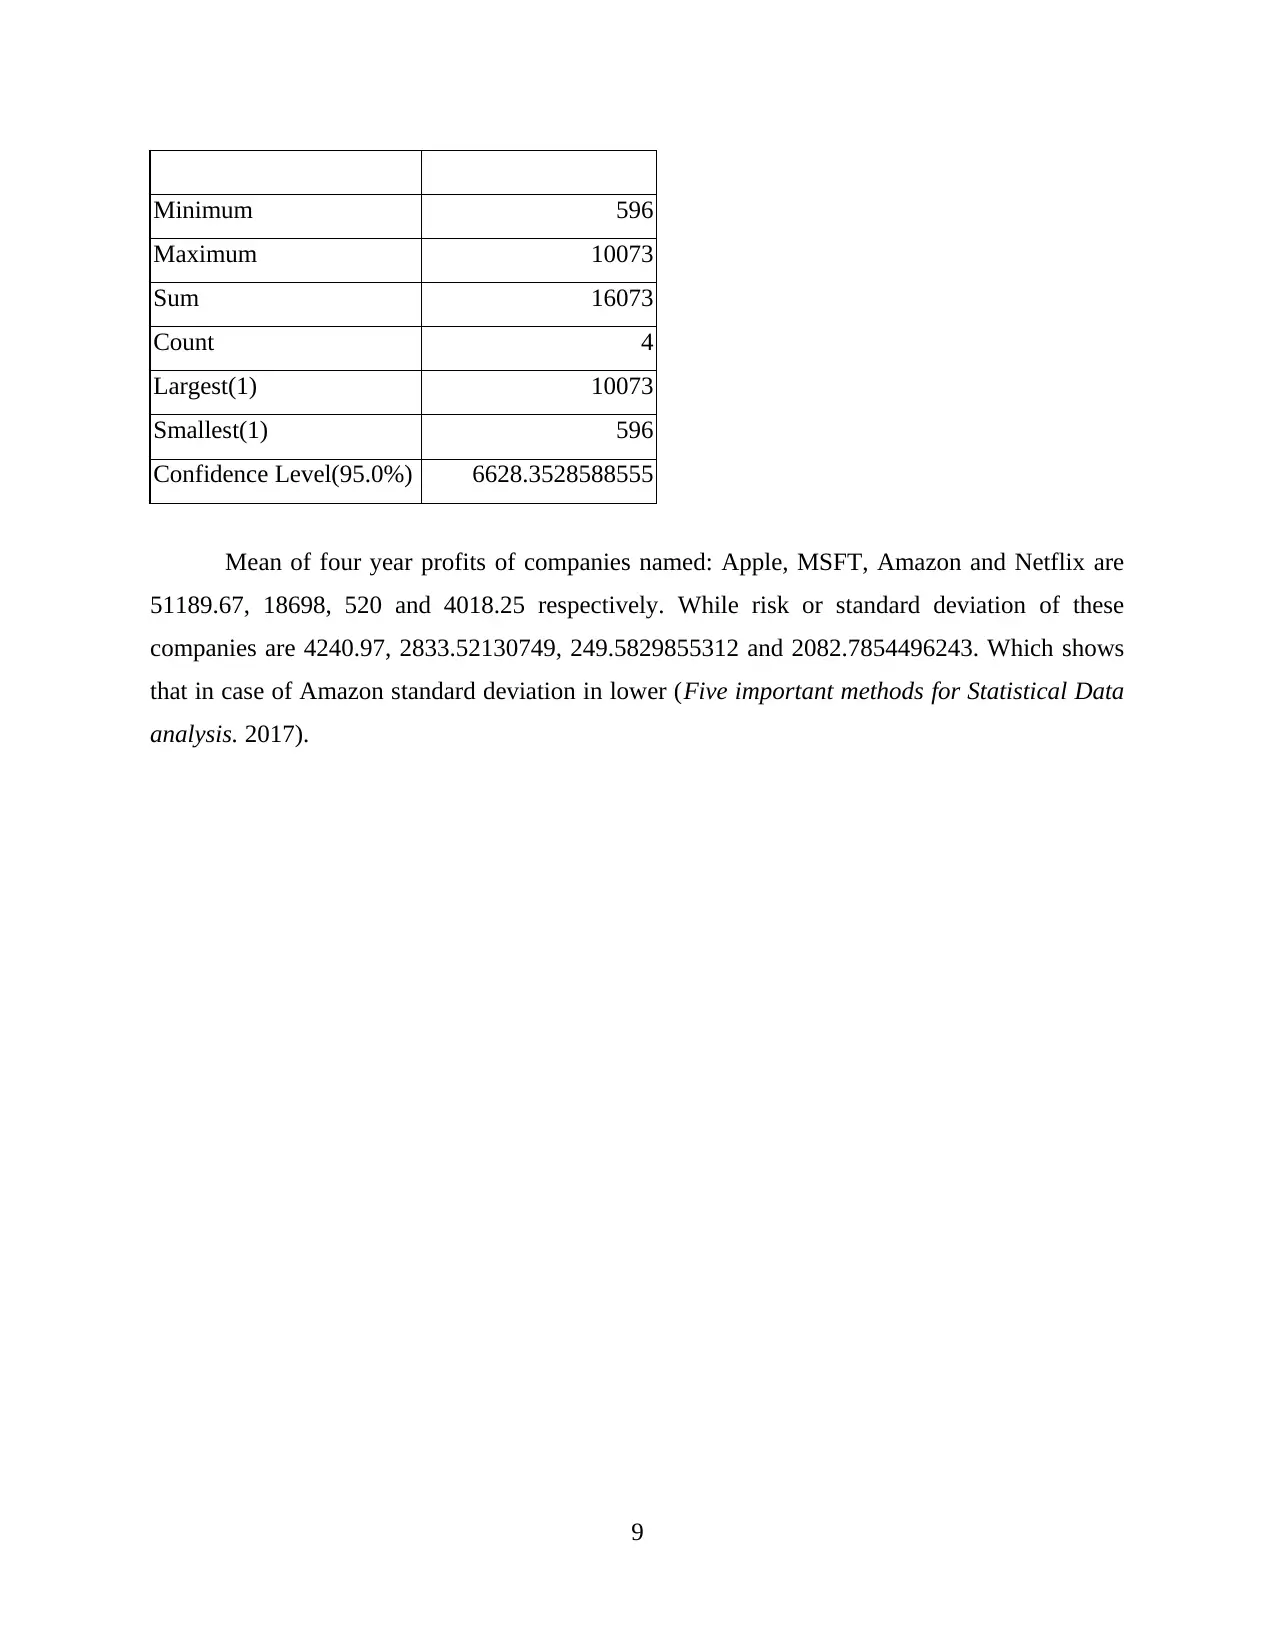
Minimum 596
Maximum 10073
Sum 16073
Count 4
Largest(1) 10073
Smallest(1) 596
Confidence Level(95.0%) 6628.3528588555
Mean of four year profits of companies named: Apple, MSFT, Amazon and Netflix are
51189.67, 18698, 520 and 4018.25 respectively. While risk or standard deviation of these
companies are 4240.97, 2833.52130749, 249.5829855312 and 2082.7854496243. Which shows
that in case of Amazon standard deviation in lower (Five important methods for Statistical Data
analysis. 2017).
9
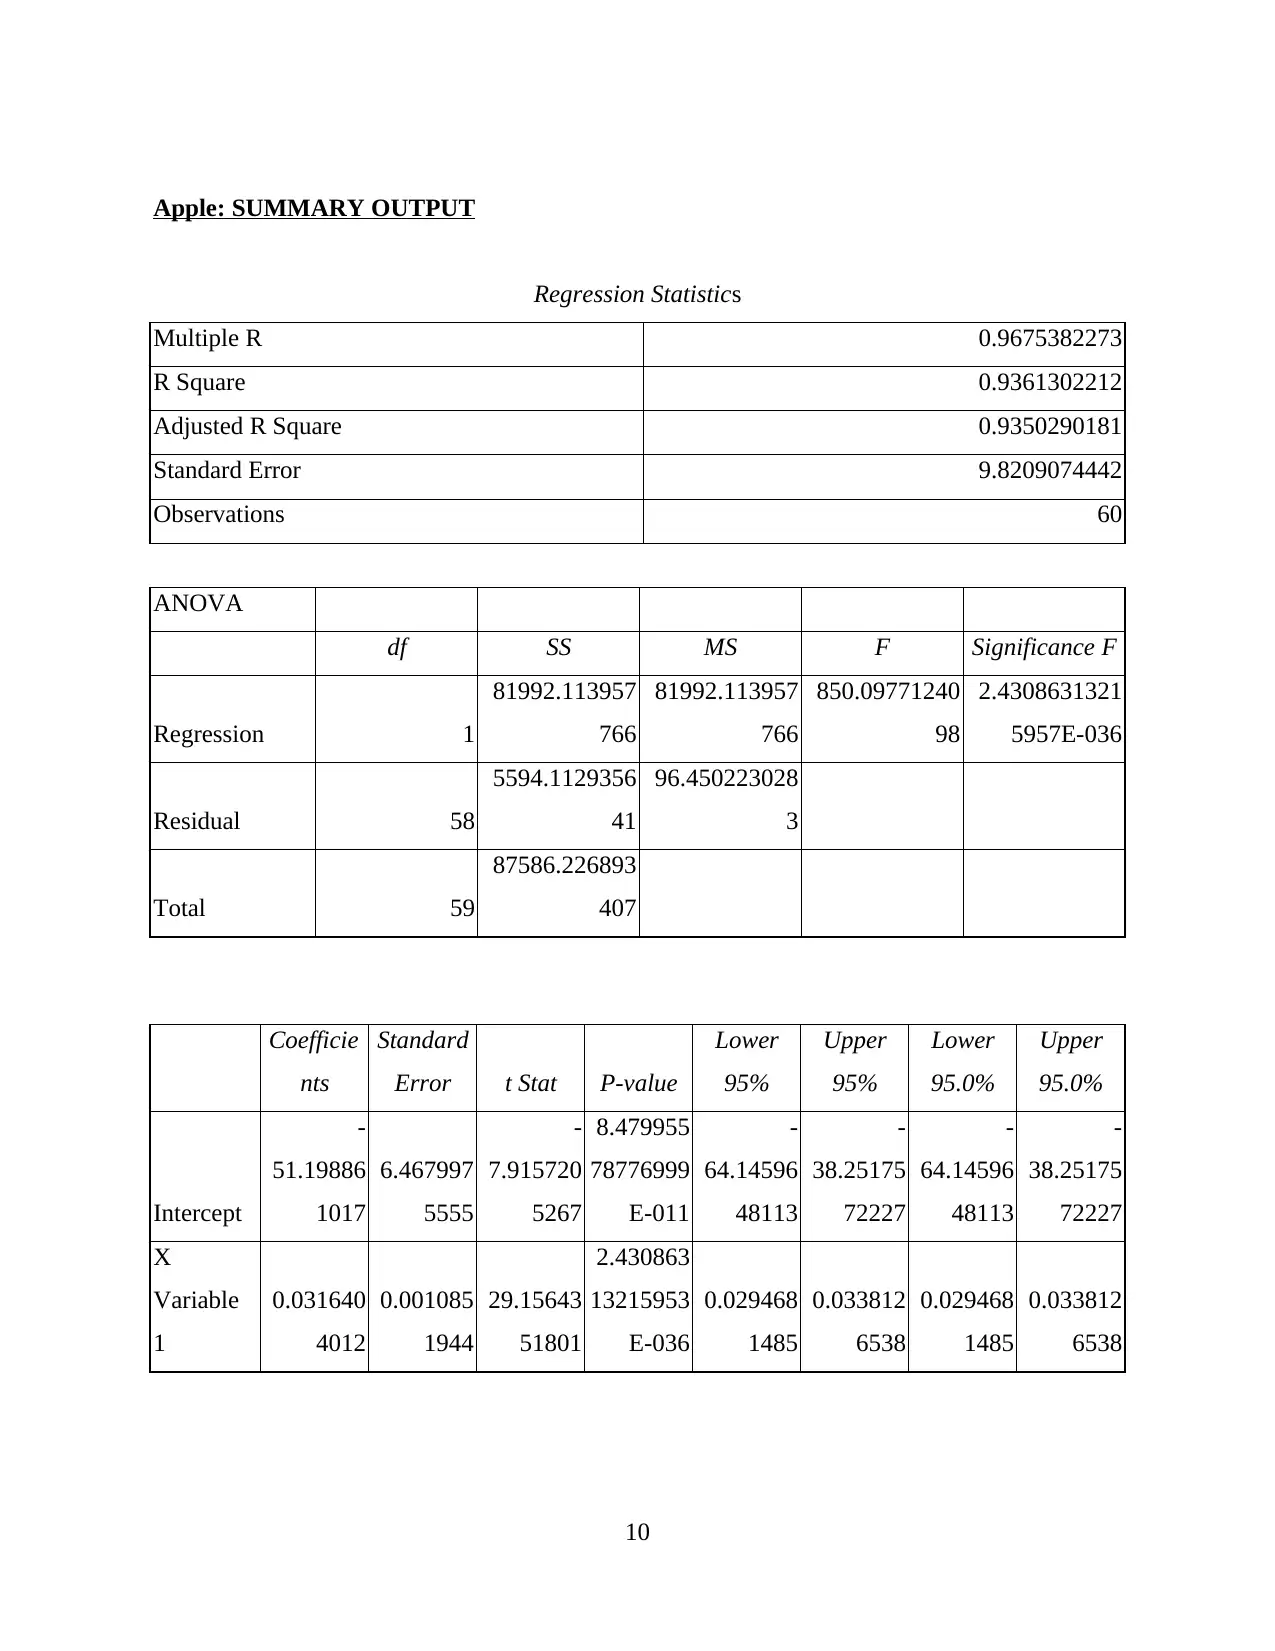
Apple: SUMMARY OUTPUT
Regression Statistics
Multiple R 0.9675382273
R Square 0.9361302212
Adjusted R Square 0.9350290181
Standard Error 9.8209074442
Observations 60
ANOVA
df SS MS F Significance F
Regression 1
81992.113957
766
81992.113957
766
850.09771240
98
2.4308631321
5957E-036
Residual 58
5594.1129356
41
96.450223028
3
Total 59
87586.226893
407
Coefficie
nts
Standard
Error t Stat P-value
Lower
95%
Upper
95%
Lower
95.0%
Upper
95.0%
Intercept
-
51.19886
1017
6.467997
5555
-
7.915720
5267
8.479955
78776999
E-011
-
64.14596
48113
-
38.25175
72227
-
64.14596
48113
-
38.25175
72227
X
Variable
1
0.031640
4012
0.001085
1944
29.15643
51801
2.430863
13215953
E-036
0.029468
1485
0.033812
6538
0.029468
1485
0.033812
6538
10
⊘ This is a preview!⊘
Do you want full access?
Subscribe today to unlock all pages.
Trusted by 1+ million students worldwide
1 out of 30
Related Documents


Your All-in-One AI-Powered Toolkit for Academic Success.
+13062052269
info@desklib.com
Available 24*7 on WhatsApp / Email
![[object Object]](/_next/static/media/star-bottom.7253800d.svg)
Unlock your academic potential
Copyright © 2020–2026 A2Z Services. All Rights Reserved. Developed and managed by ZUCOL.