Statistics for Management: Understanding Data and Business Decisions

Verified

Added on  2023/01/24

|20
|934
|98
Report
AI Summary
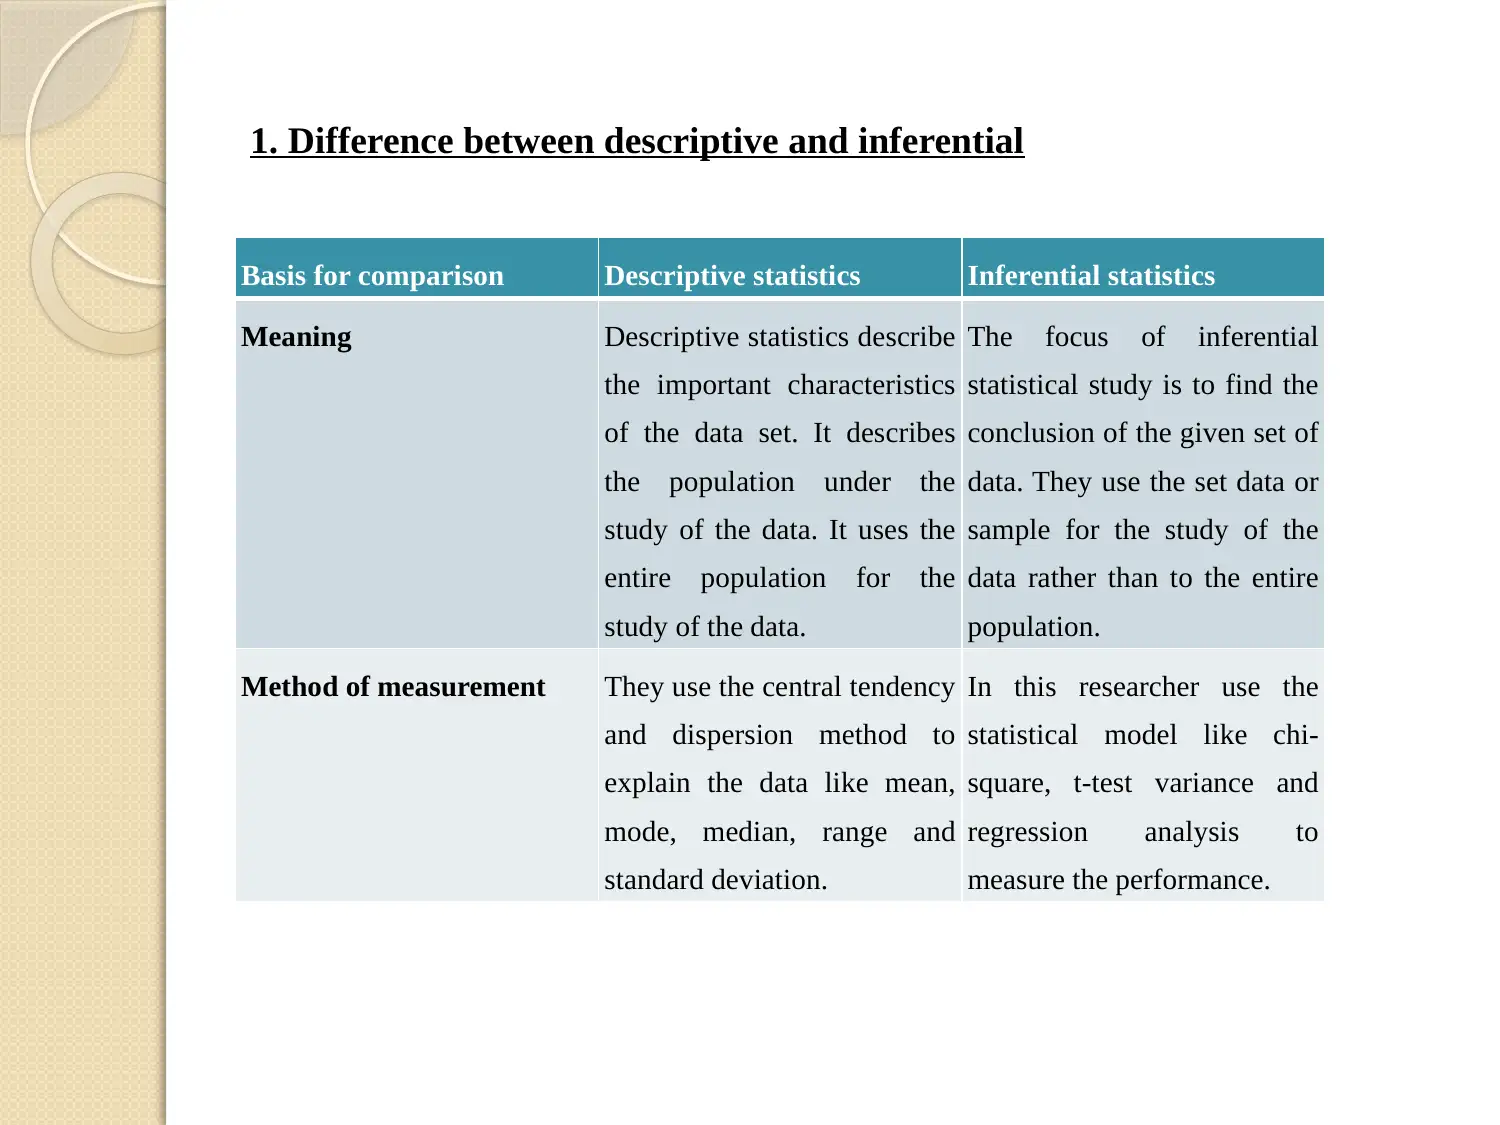
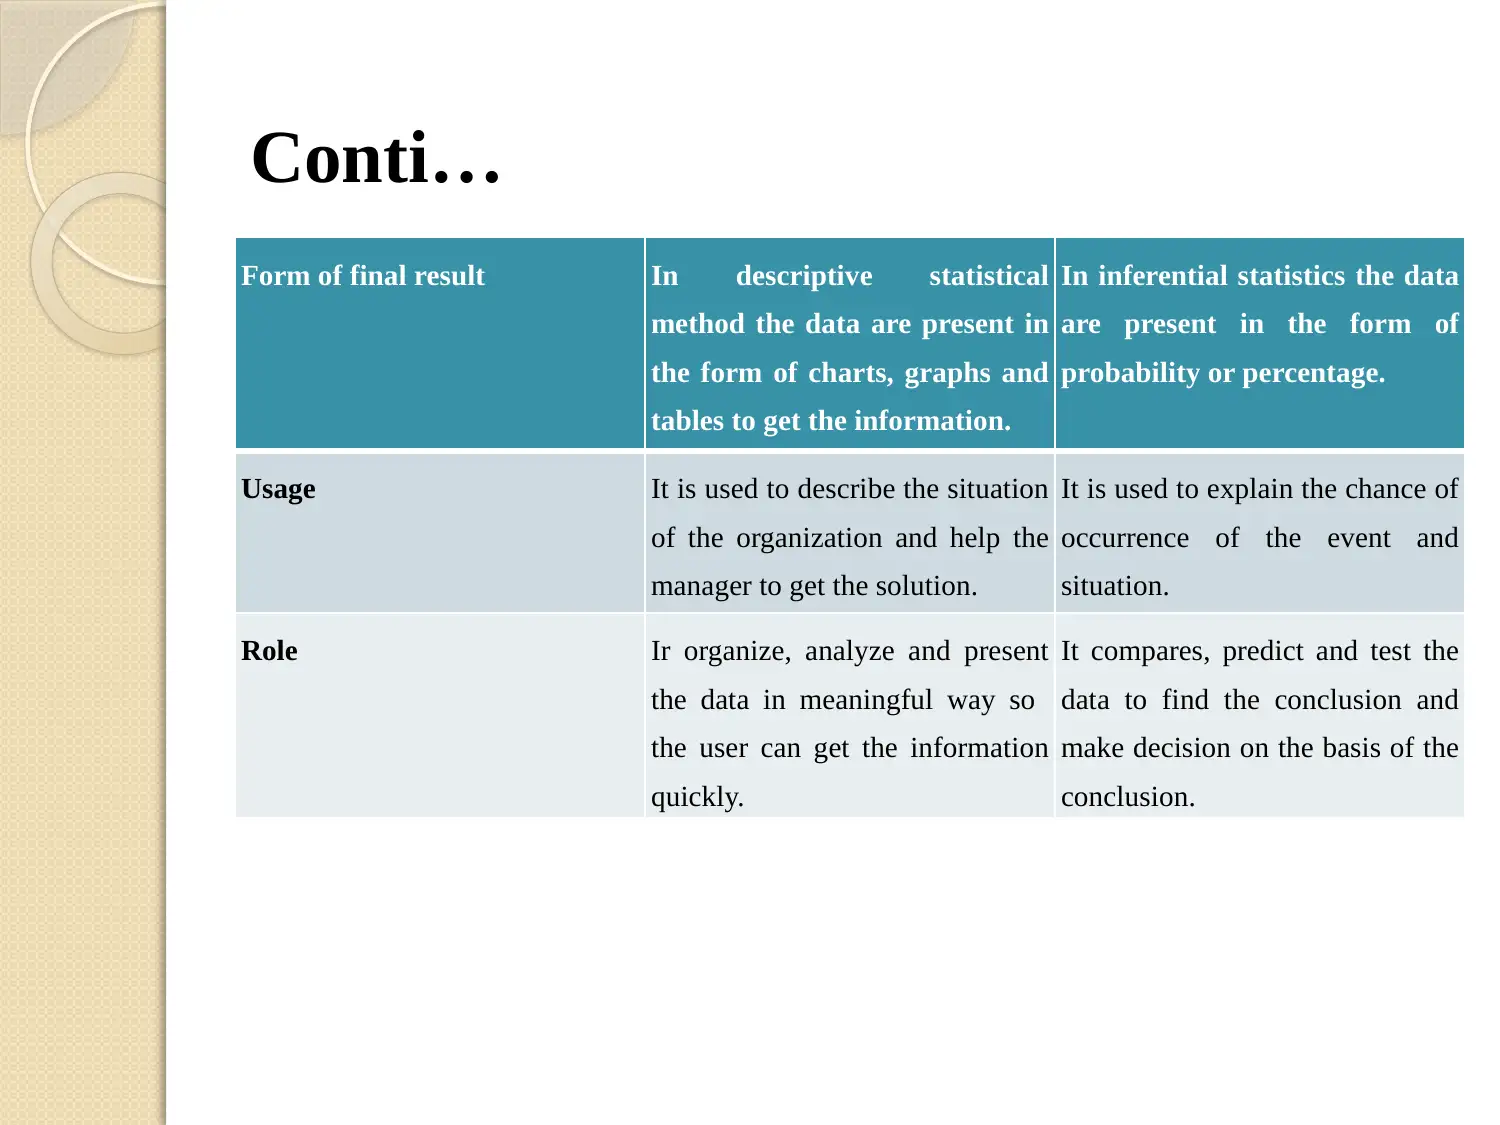
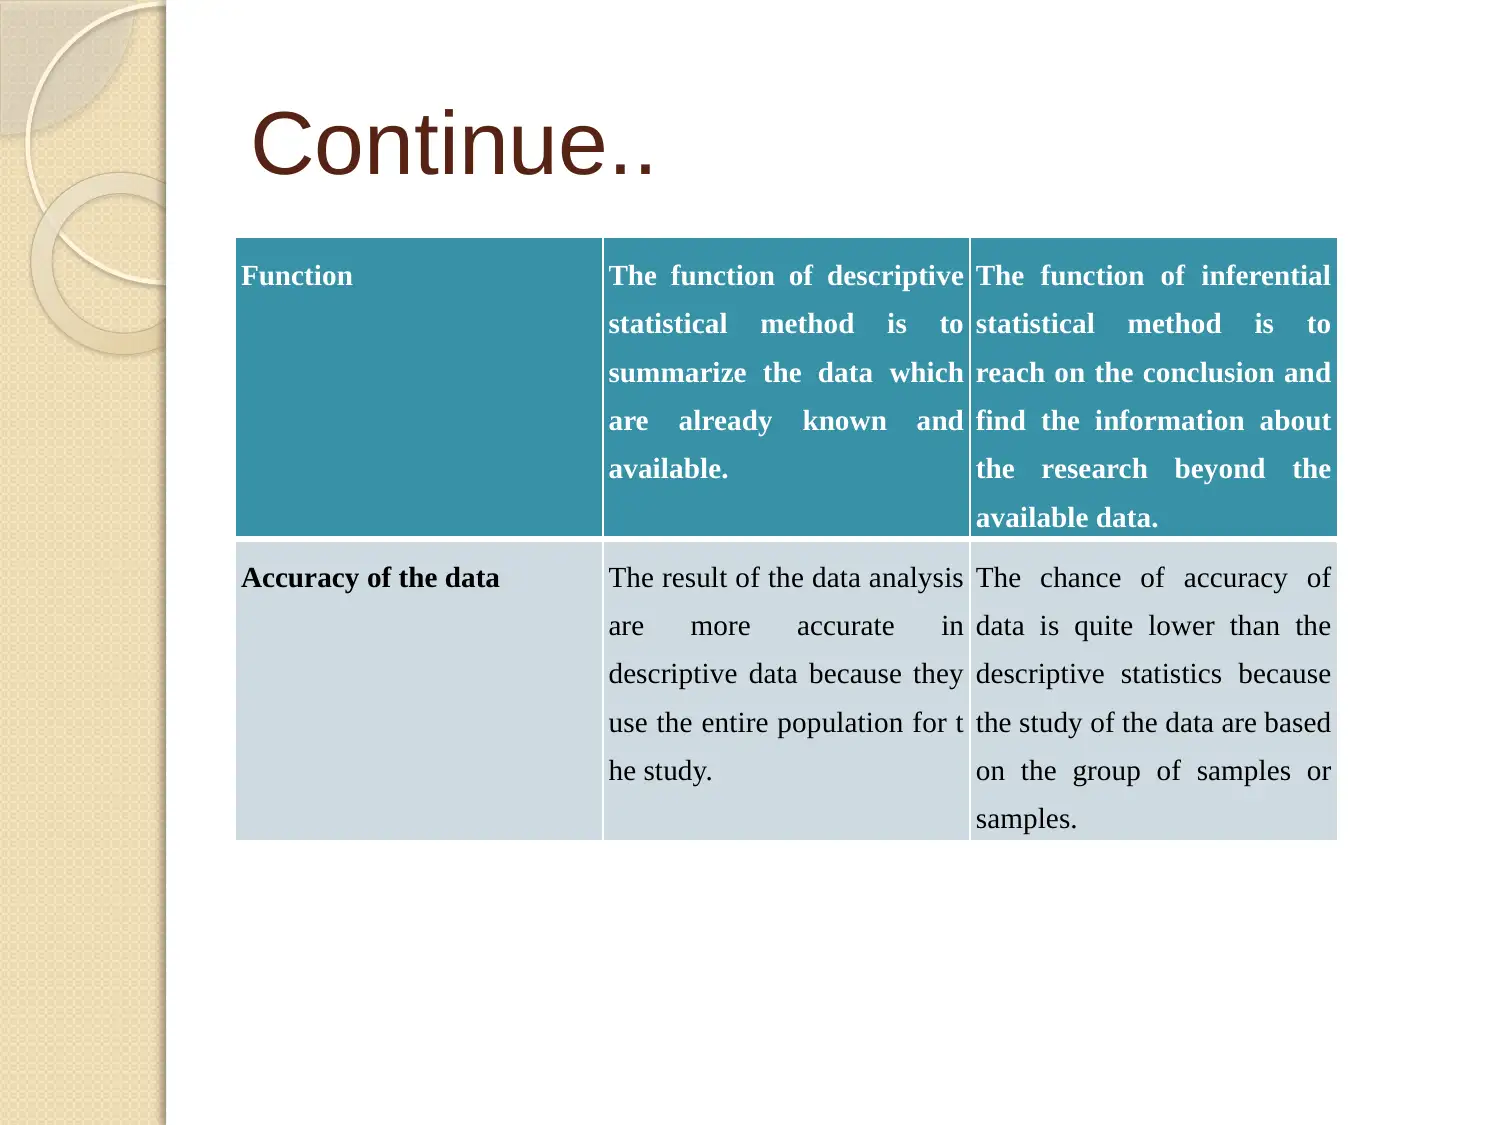
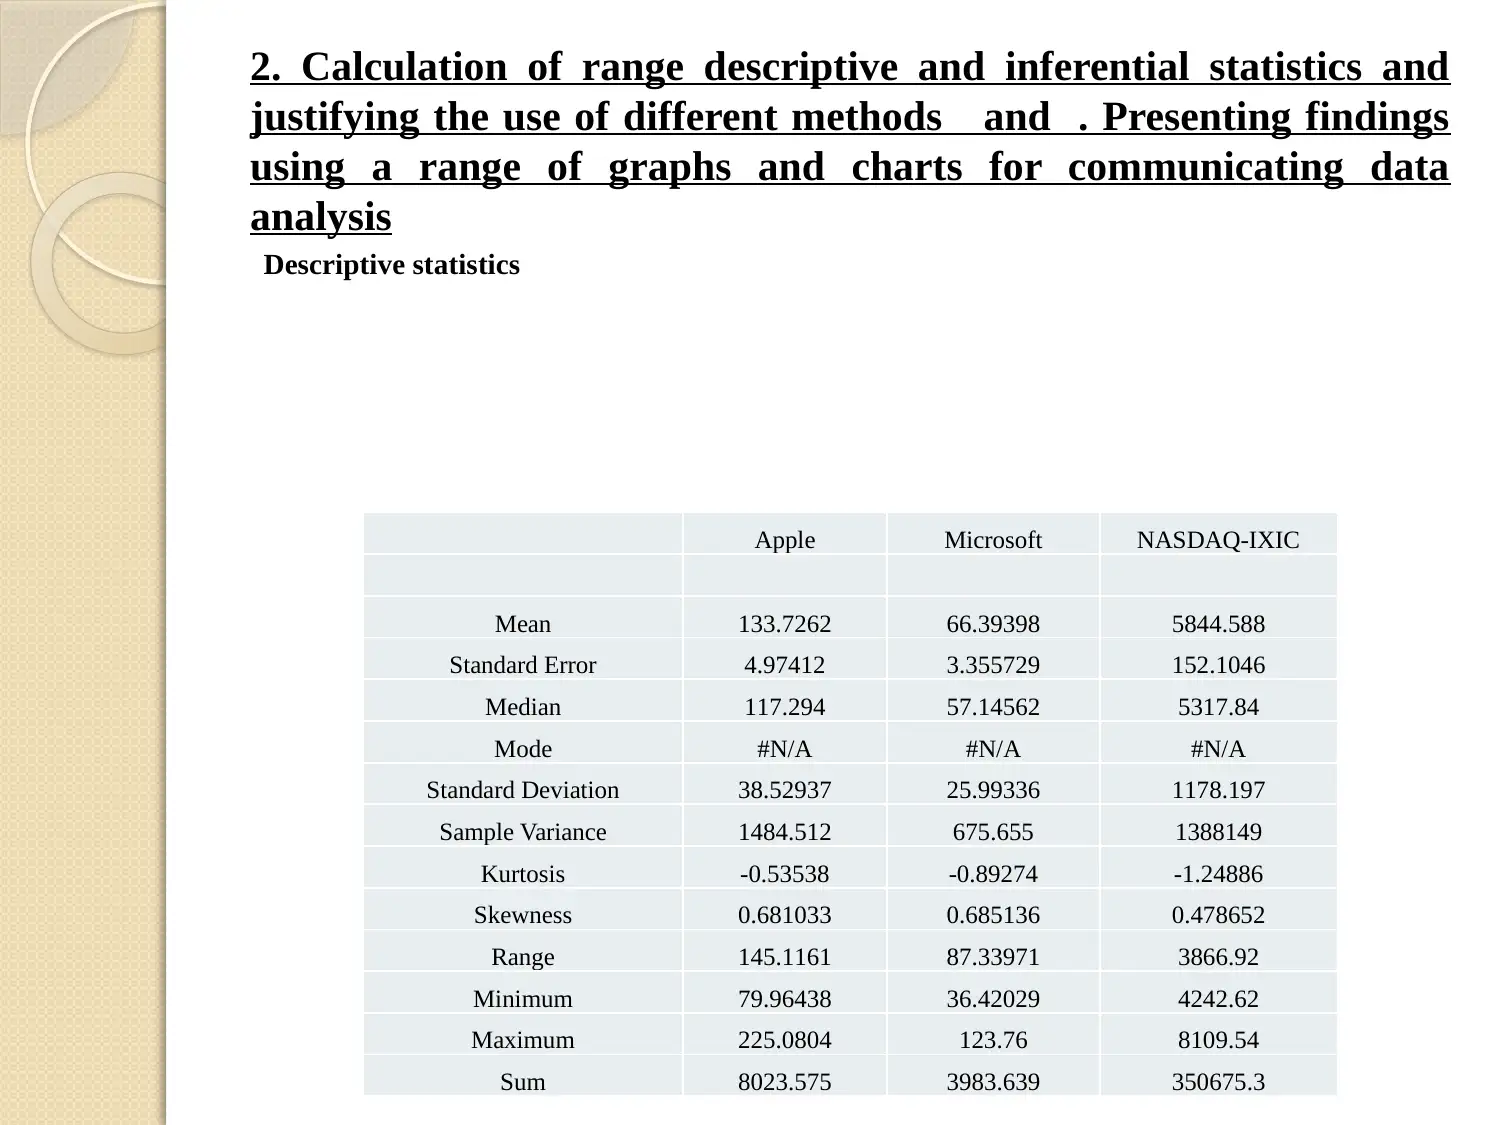
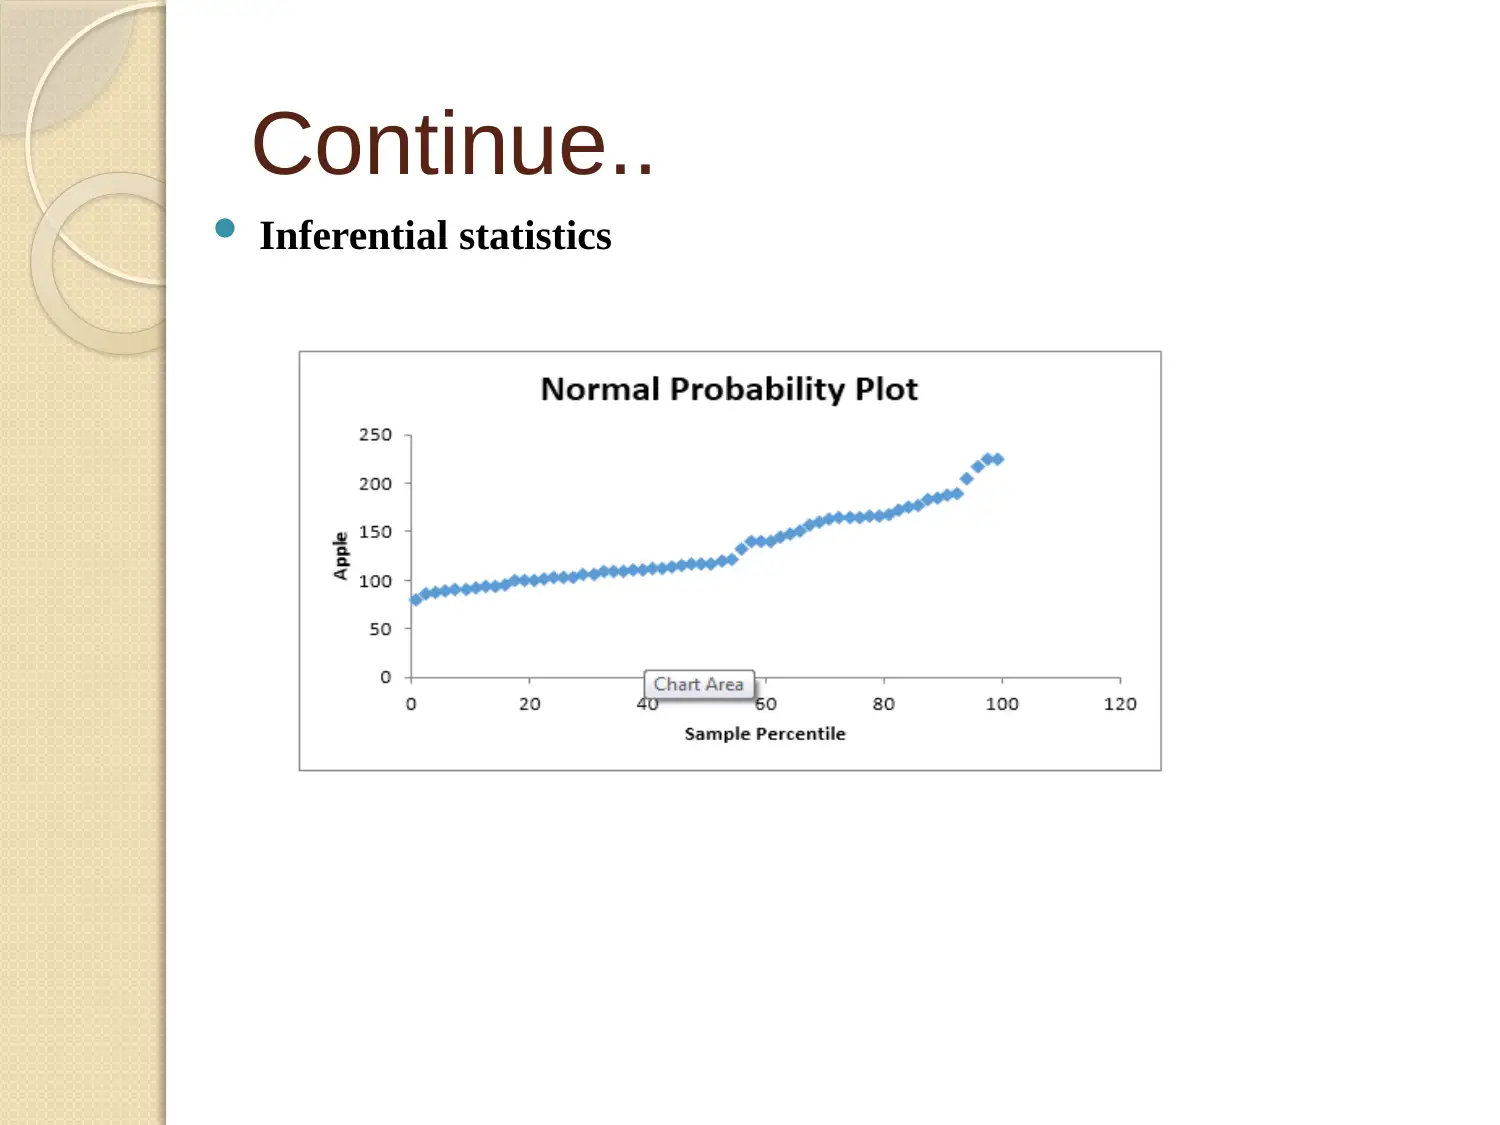
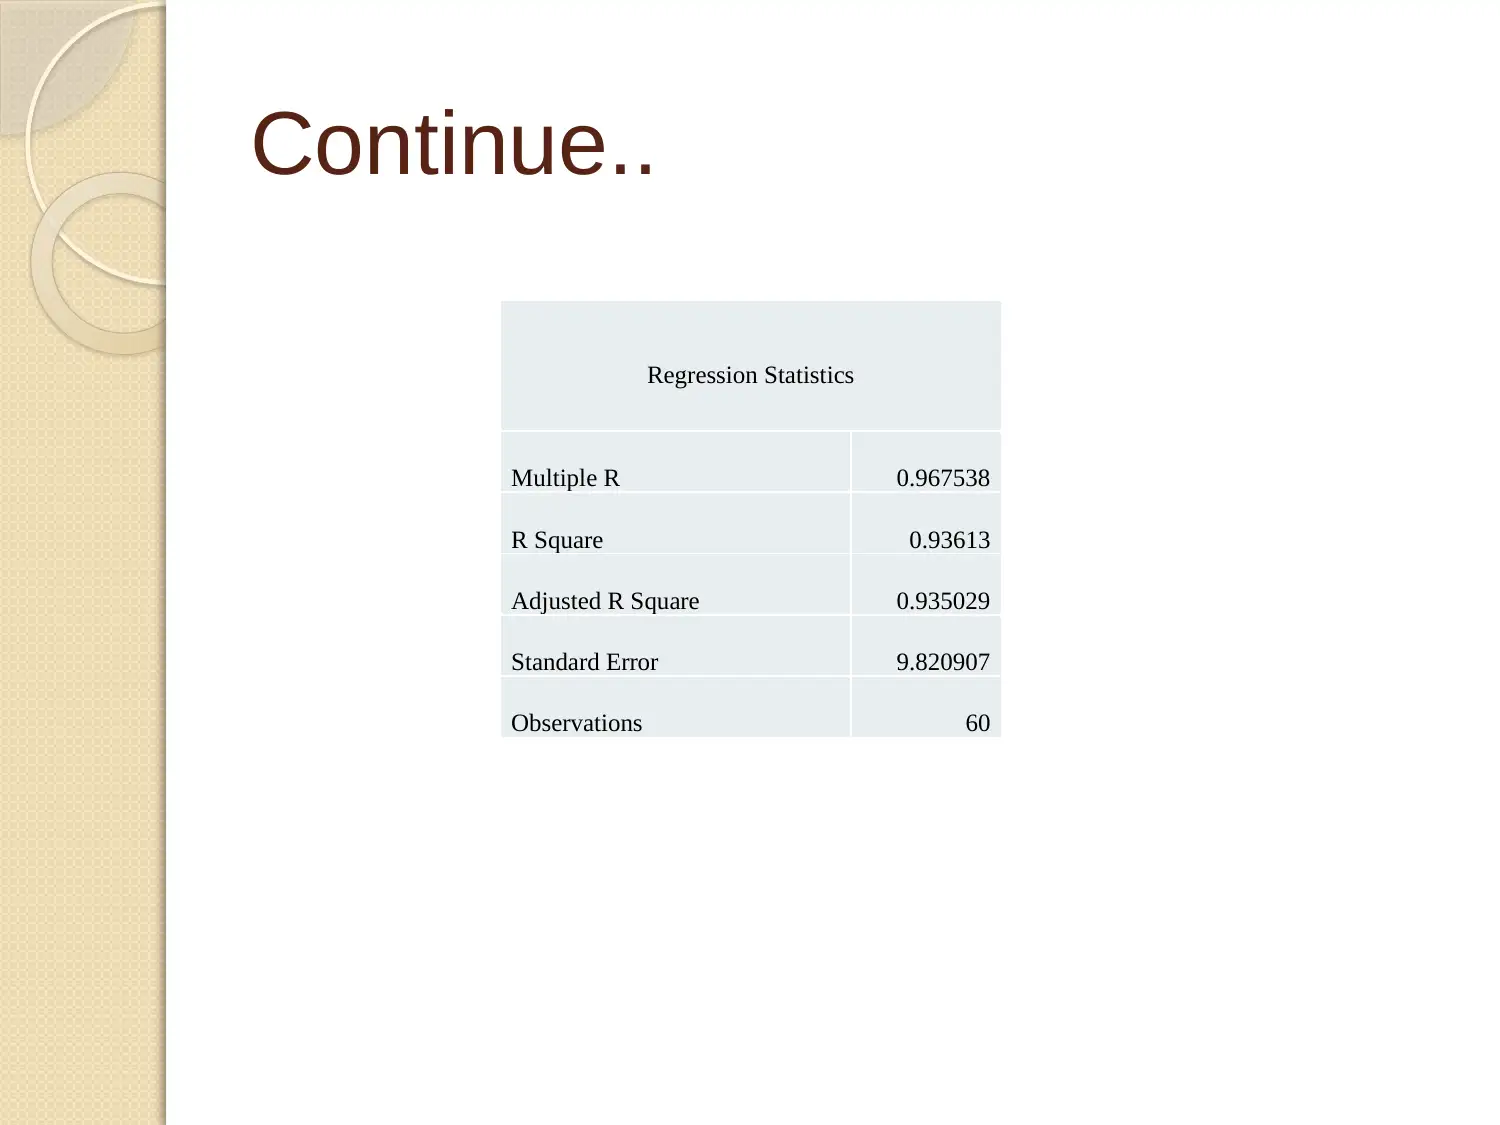
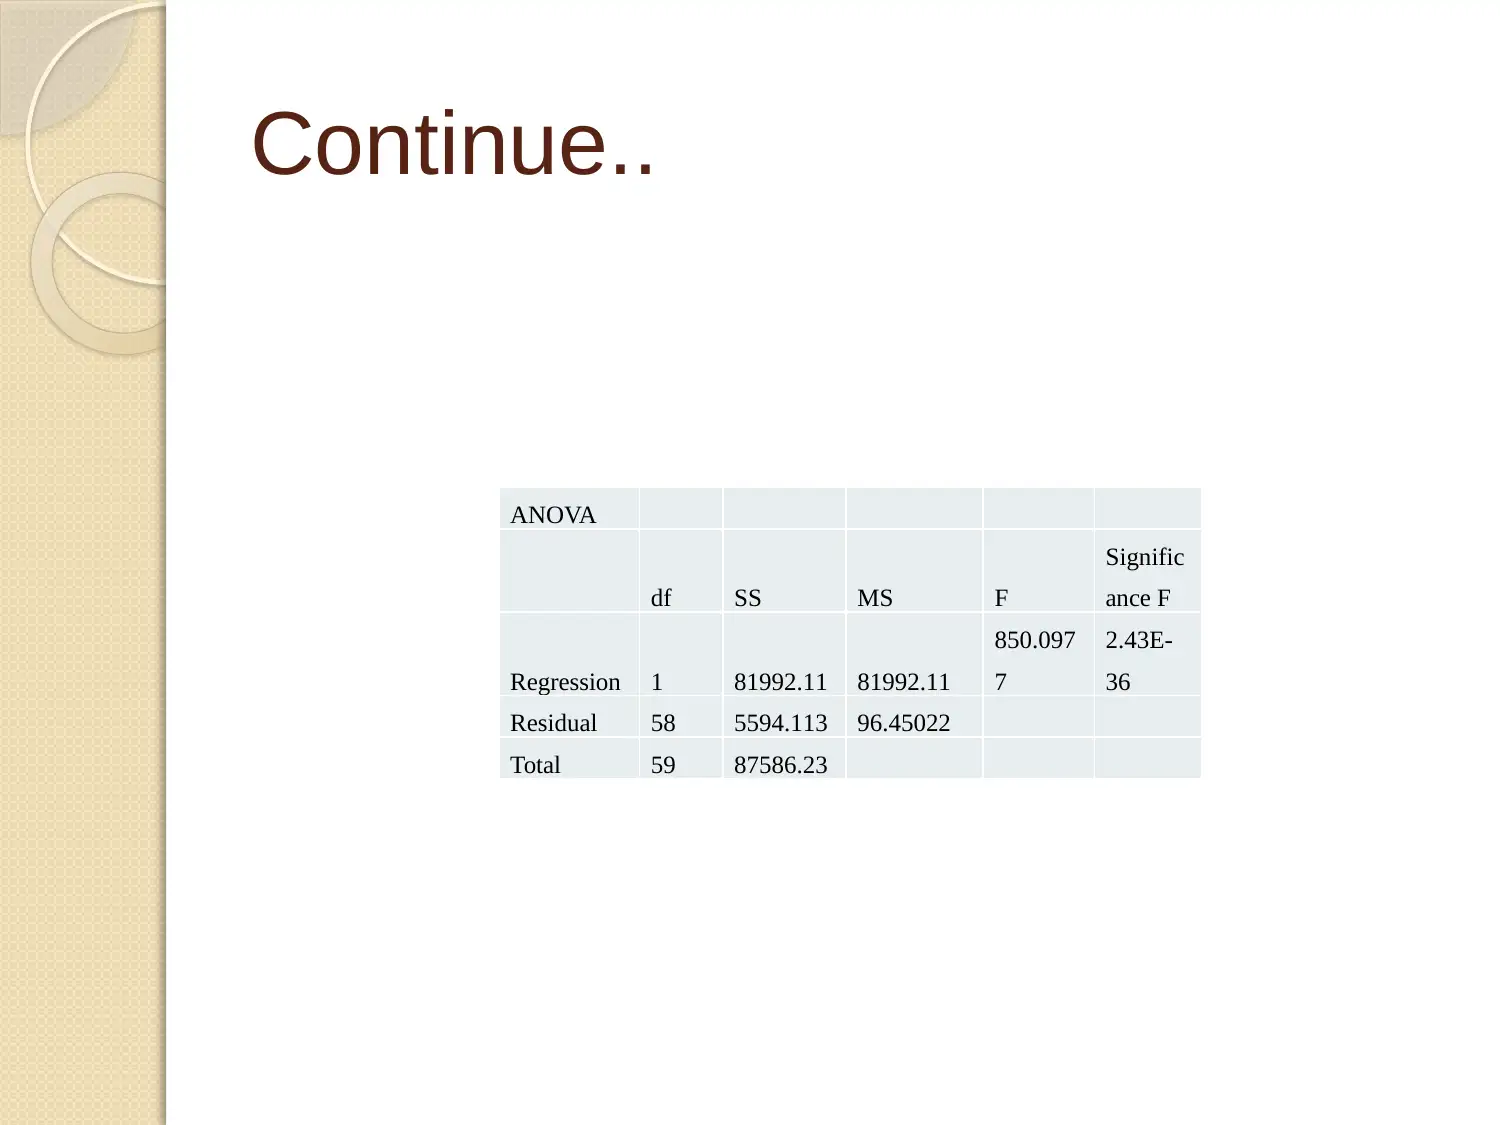
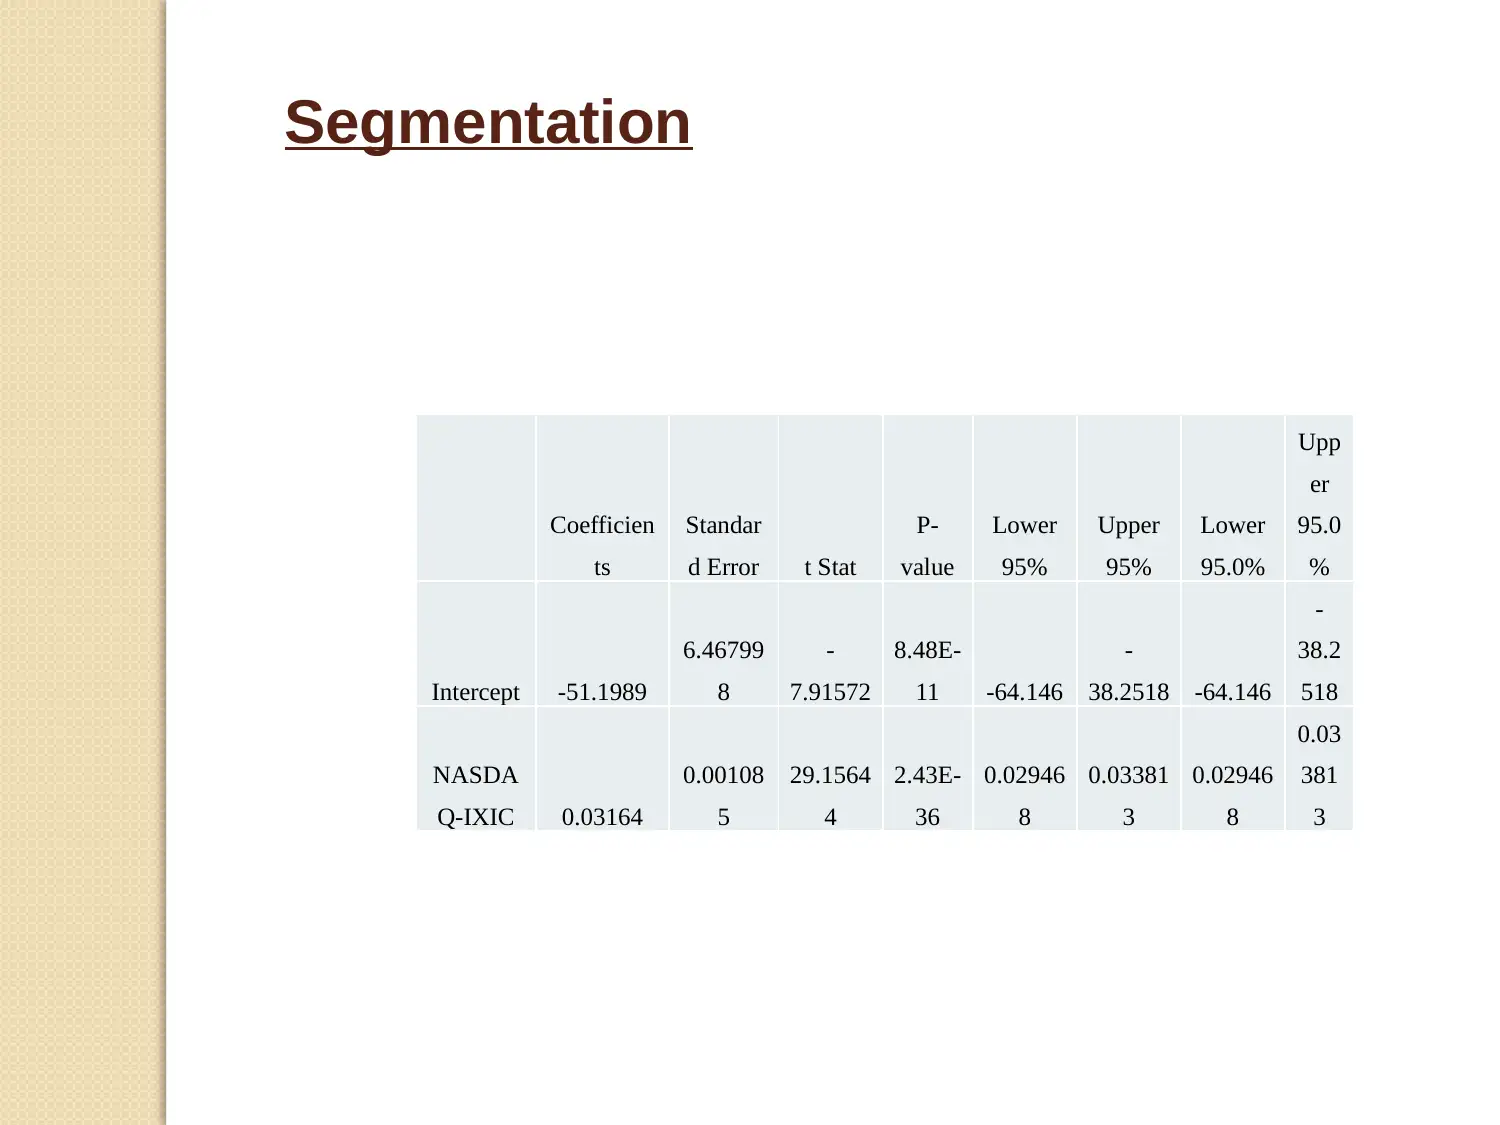
This report provides a comprehensive overview of statistics for management, differentiating between descriptive and inferential statistics. It explores the methods used to analyze data, including the calculation of the range for datasets related to Apple, Microsoft, and NASDAQ-IXIC. The report presents findings using a range of graphs and charts to communicate data analysis effectively, including regression statistics and ANOVA tables. Furthermore, it highlights trend forecasting and concludes with a summary of statistical data's importance in management and its role in achieving organizational objectives. The report also discusses different data sources and the analysis of quantitative and qualitative data to aid in business decision-making.
Document Page
Statistics for Management
tabler-icon-diamond-filled.svg

Paraphrase This Document

Need a fresh take? Get an instant paraphrase of this document with our AI Paraphraser
Document Page
Table of contents
Introduction
Task 2
Conclusion
References
Document Page
INTRODUCTION
Statistics are the set of data which provides the useful information
to the users.
The data are collected in large quantity and statistics help in
converting the data in small number through the different method,
so they can be easily understood.
Document Page
TASK 2
tabler-icon-diamond-filled.svg

Paraphrase This Document

Need a fresh take? Get an instant paraphrase of this document with our AI Paraphraser
Document Page
1. Difference between descriptive and inferential
Basis for comparison Descriptive statistics Inferential statistics
Meaning Descriptive statistics describe
the important characteristics
of the data set. It describes
the population under the
study of the data. It uses the
entire population for the
study of the data.
The focus of inferential
statistical study is to find the
conclusion of the given set of
data. They use the set data or
sample for the study of the
data rather than to the entire
population.
Method of measurement They use the central tendency
and dispersion method to
explain the data like mean,
mode, median, range and
standard deviation.
In this researcher use the
statistical model like chi-
square, t-test variance and
regression analysis to
measure the performance.
Document Page
Conti…
Form of final result In descriptive statistical
method the data are present in
the form of charts, graphs and
tables to get the information.
In inferential statistics the data
are present in the form of
probability or percentage.
Usage It is used to describe the situation
of the organization and help the
manager to get the solution.
It is used to explain the chance of
occurrence of the event and
situation.
Role Ir organize, analyze and present
the data in meaningful way so
the user can get the information
quickly.
It compares, predict and test the
data to find the conclusion and
make decision on the basis of the
conclusion.
Document Page
Continue..
Function The function of descriptive
statistical method is to
summarize the data which
are already known and
available.
The function of inferential
statistical method is to
reach on the conclusion and
find the information about
the research beyond the
available data.
Accuracy of the data The result of the data analysis
are more accurate in
descriptive data because they
use the entire population for t
he study.
The chance of accuracy of
data is quite lower than the
descriptive statistics because
the study of the data are based
on the group of samples or
samples.
tabler-icon-diamond-filled.svg

Paraphrase This Document

Need a fresh take? Get an instant paraphrase of this document with our AI Paraphraser
Document Page
2. Calculation of range descriptive and inferential statistics and
justifying the use of different methods and . Presenting findings
using a range of graphs and charts for communicating data
analysis
Descriptive statistics
Apple Microsoft NASDAQ-IXIC
Mean 133.7262 66.39398 5844.588
Standard Error 4.97412 3.355729 152.1046
Median 117.294 57.14562 5317.84
Mode #N/A #N/A #N/A
Standard Deviation 38.52937 25.99336 1178.197
Sample Variance 1484.512 675.655 1388149
Kurtosis -0.53538 -0.89274 -1.24886
Skewness 0.681033 0.685136 0.478652
Range 145.1161 87.33971 3866.92
Minimum 79.96438 36.42029 4242.62
Maximum 225.0804 123.76 8109.54
Sum 8023.575 3983.639 350675.3
Document Page
Continue..
Inferential statistics
Document Page
Continue..
Regression Statistics
Multiple R 0.967538
R Square 0.93613
Adjusted R Square 0.935029
Standard Error 9.820907
Observations 60
tabler-icon-diamond-filled.svg

Paraphrase This Document

Need a fresh take? Get an instant paraphrase of this document with our AI Paraphraser
Document Page
Continue..
ANOVA
df SS MS F
Signific
ance F
Regression 1 81992.11 81992.11
850.097
7
2.43E-
36
Residual 58 5594.113 96.45022
Total 59 87586.23
Document Page
Segmentation
Coefficien
ts
Standar
d Error t Stat
P-
value
Lower
95%
Upper
95%
Lower
95.0%
Upp
er
95.0
%
Intercept -51.1989
6.46799
8
-
7.91572
8.48E-
11 -64.146
-
38.2518 -64.146
-
38.2
518
NASDA
Q-IXIC 0.03164
0.00108
5
29.1564
4
2.43E-
36
0.02946
8
0.03381
3
0.02946
8
0.03
381
3
chevron_up_icon
1 out of 20
circle_padding
hide_on_mobile
zoom_out_icon
[object Object]