Statistics for Management Report: Techniques, Data, and Findings
VerifiedAdded on 2023/01/19
|15
|2980
|32
Report
AI Summary
This report delves into the application of statistical techniques within a business context, offering insights into data analysis and decision-making. It begins with an introduction to statistics, its characteristics, and an overview of various techniques, including inferential and descriptive statistics. The report explores different data types, sources, and the contrast between population and sample data. It emphasizes the value of statistical techniques in achieving business objectives, providing examples of sample datasets and regression analysis. The report evaluates the differences between inferential and descriptive statistics, calculates the range of descriptive statistics, and presents findings through graphical representations. Overall, the report aims to provide a comprehensive understanding of statistical methods and their practical applications in business.

Statistics for management
Paraphrase This Document
Need a fresh take? Get an instant paraphrase of this document with our AI Paraphraser
TABLE OF CONTENTS
INTRODUCTION...........................................................................................................................1
PART 1............................................................................................................................................1
Introduction of statistics with its characteristics and overview of techniques............................1
Types and sources of the data that a business could access........................................................2
Contrast between population & sample .....................................................................................2
Value of applying the statistical techniques in meeting the business objectives........................3
Explaining difference between inferential and the descriptive statistics....................................4
Providing example of the sample dataset ...................................................................................5
PART 2............................................................................................................................................6
Evaluating difference between an inferential and descriptive statistics......................................6
Calculating range of the descriptive statistics ............................................................................7
Presenting the findings ...............................................................................................................9
CONCLUSION..............................................................................................................................10
REFERENCES..............................................................................................................................11
INTRODUCTION
Statistics for management provides an insights to the managers along with the necessary
tools in making sense of the larger quantities of the data and in making effective decisions in the
business on the basis of the inferences drawn from the dataset. The present report highlights
various statistical methods and the techniques used for analysing the data. Furthermore, tit
includes application of regression analysis for determining the findings and also computing range
of descriptive methods.
PART 1
Introduction of statistics with its characteristics and overview of techniques
Statistics is the collection of the methods or tools for the purpose of planning, obtaining
data, experiments and thereafter organising, presenting, analysing, summarizing, drawing
conclusion and interpreting the results on the basis of data (Ho and Yu, 2015). In other words, it
deals with classifying and tabulating the numerical facts as a basis for composition, explaining
and describing the phenomenon.
The main characteristics of statistics are as follows-
Statistics is counted as an aggregate of facts where only those facts are been taken into
account that could be measured in terms of place, time and frequency.
It is been affected to marked extent by the multiplicity of the causes where the statistical
data are more and more relates to the social sciences.
This subject is considered as the quantitative phenomena as it is been expressed only in
numerical terms and does not involves analysis of qualitative characteristics like ability,
honesty and goodness etc.
It is enumerated and estimated in accordance with the reasonable standards of the
accuracy.
Data under statistics are gathered in appropriate and systematic manner so that proper
conclusion can be presented.
Overview of the methods-
1
⊘ This is a preview!⊘
Do you want full access?
Subscribe today to unlock all pages.
Trusted by 1+ million students worldwide
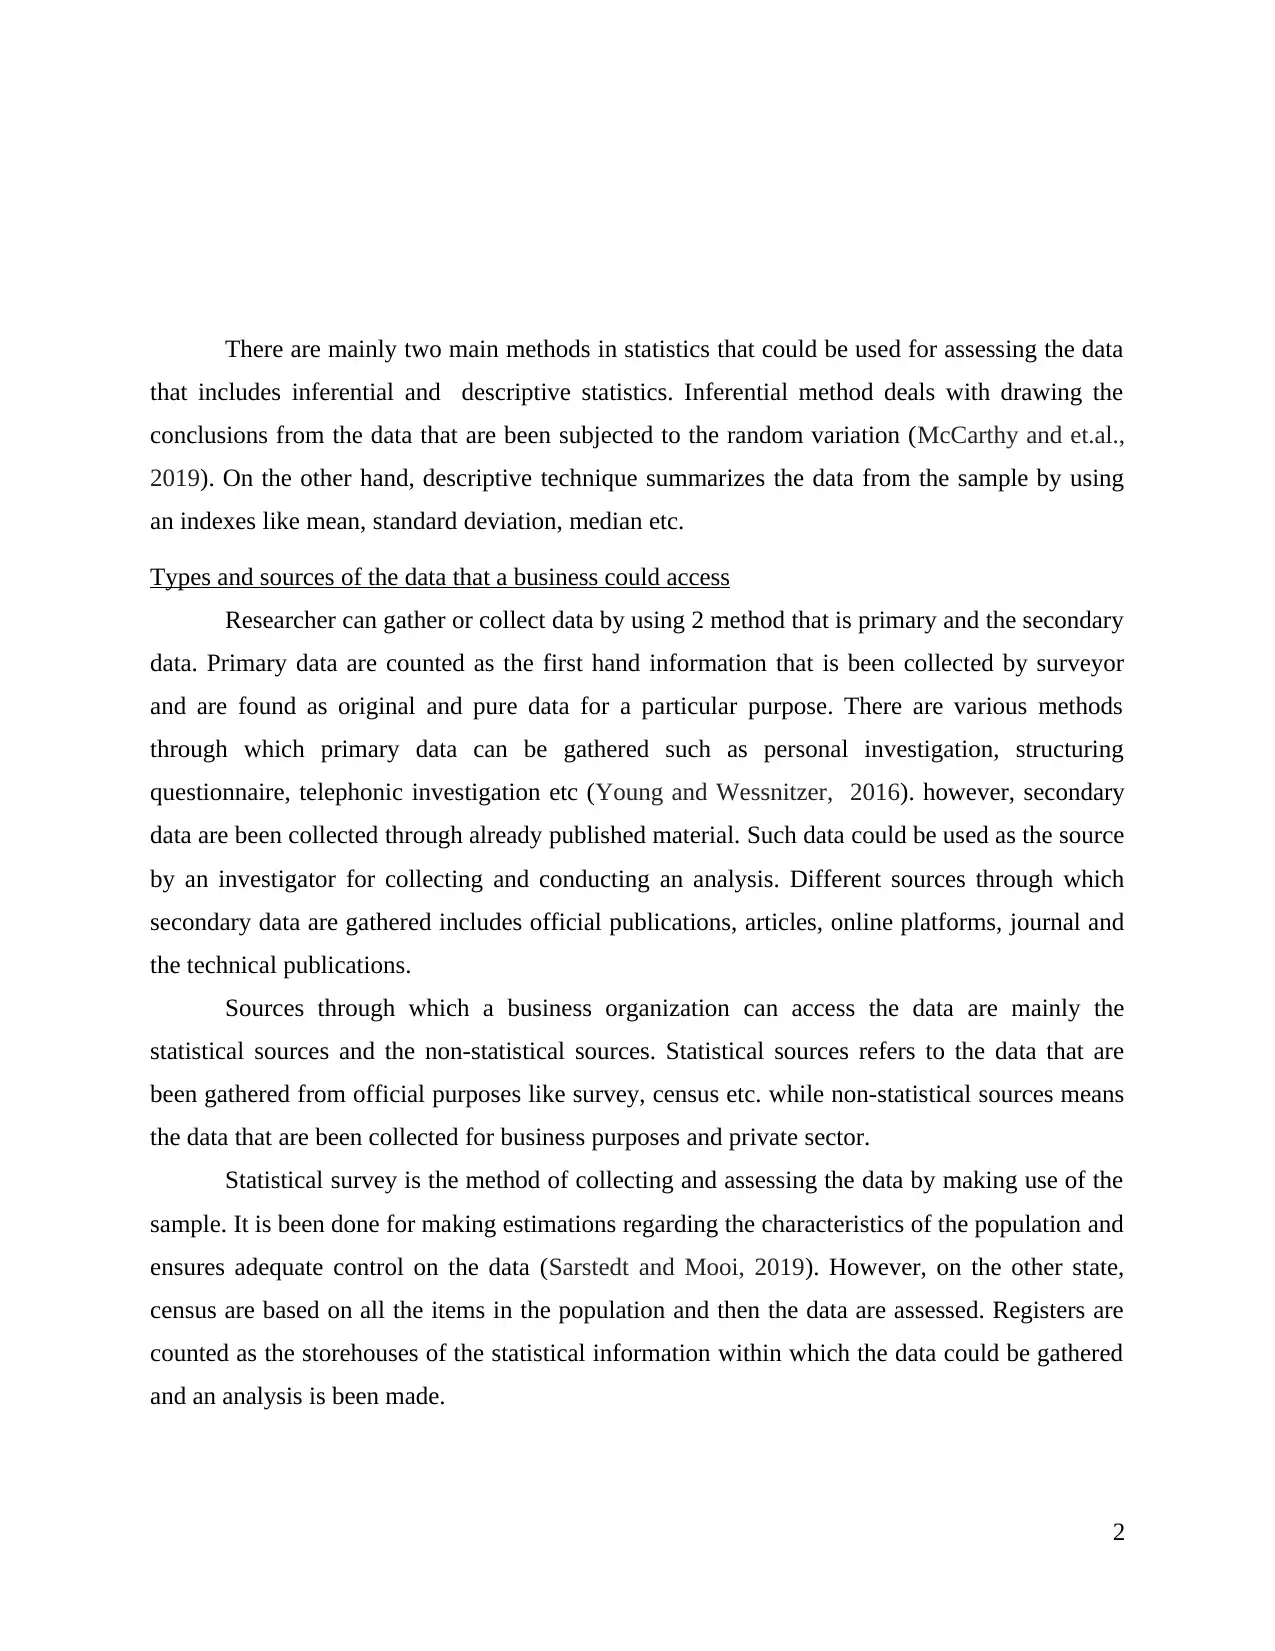
There are mainly two main methods in statistics that could be used for assessing the data
that includes inferential and descriptive statistics. Inferential method deals with drawing the
conclusions from the data that are been subjected to the random variation (McCarthy and et.al.,
2019). On the other hand, descriptive technique summarizes the data from the sample by using
an indexes like mean, standard deviation, median etc.
Types and sources of the data that a business could access
Researcher can gather or collect data by using 2 method that is primary and the secondary
data. Primary data are counted as the first hand information that is been collected by surveyor
and are found as original and pure data for a particular purpose. There are various methods
through which primary data can be gathered such as personal investigation, structuring
questionnaire, telephonic investigation etc (Young and Wessnitzer, 2016). however, secondary
data are been collected through already published material. Such data could be used as the source
by an investigator for collecting and conducting an analysis. Different sources through which
secondary data are gathered includes official publications, articles, online platforms, journal and
the technical publications.
Sources through which a business organization can access the data are mainly the
statistical sources and the non-statistical sources. Statistical sources refers to the data that are
been gathered from official purposes like survey, census etc. while non-statistical sources means
the data that are been collected for business purposes and private sector.
Statistical survey is the method of collecting and assessing the data by making use of the
sample. It is been done for making estimations regarding the characteristics of the population and
ensures adequate control on the data (Sarstedt and Mooi, 2019). However, on the other state,
census are based on all the items in the population and then the data are assessed. Registers are
counted as the storehouses of the statistical information within which the data could be gathered
and an analysis is been made.
2
Paraphrase This Document
Need a fresh take? Get an instant paraphrase of this document with our AI Paraphraser
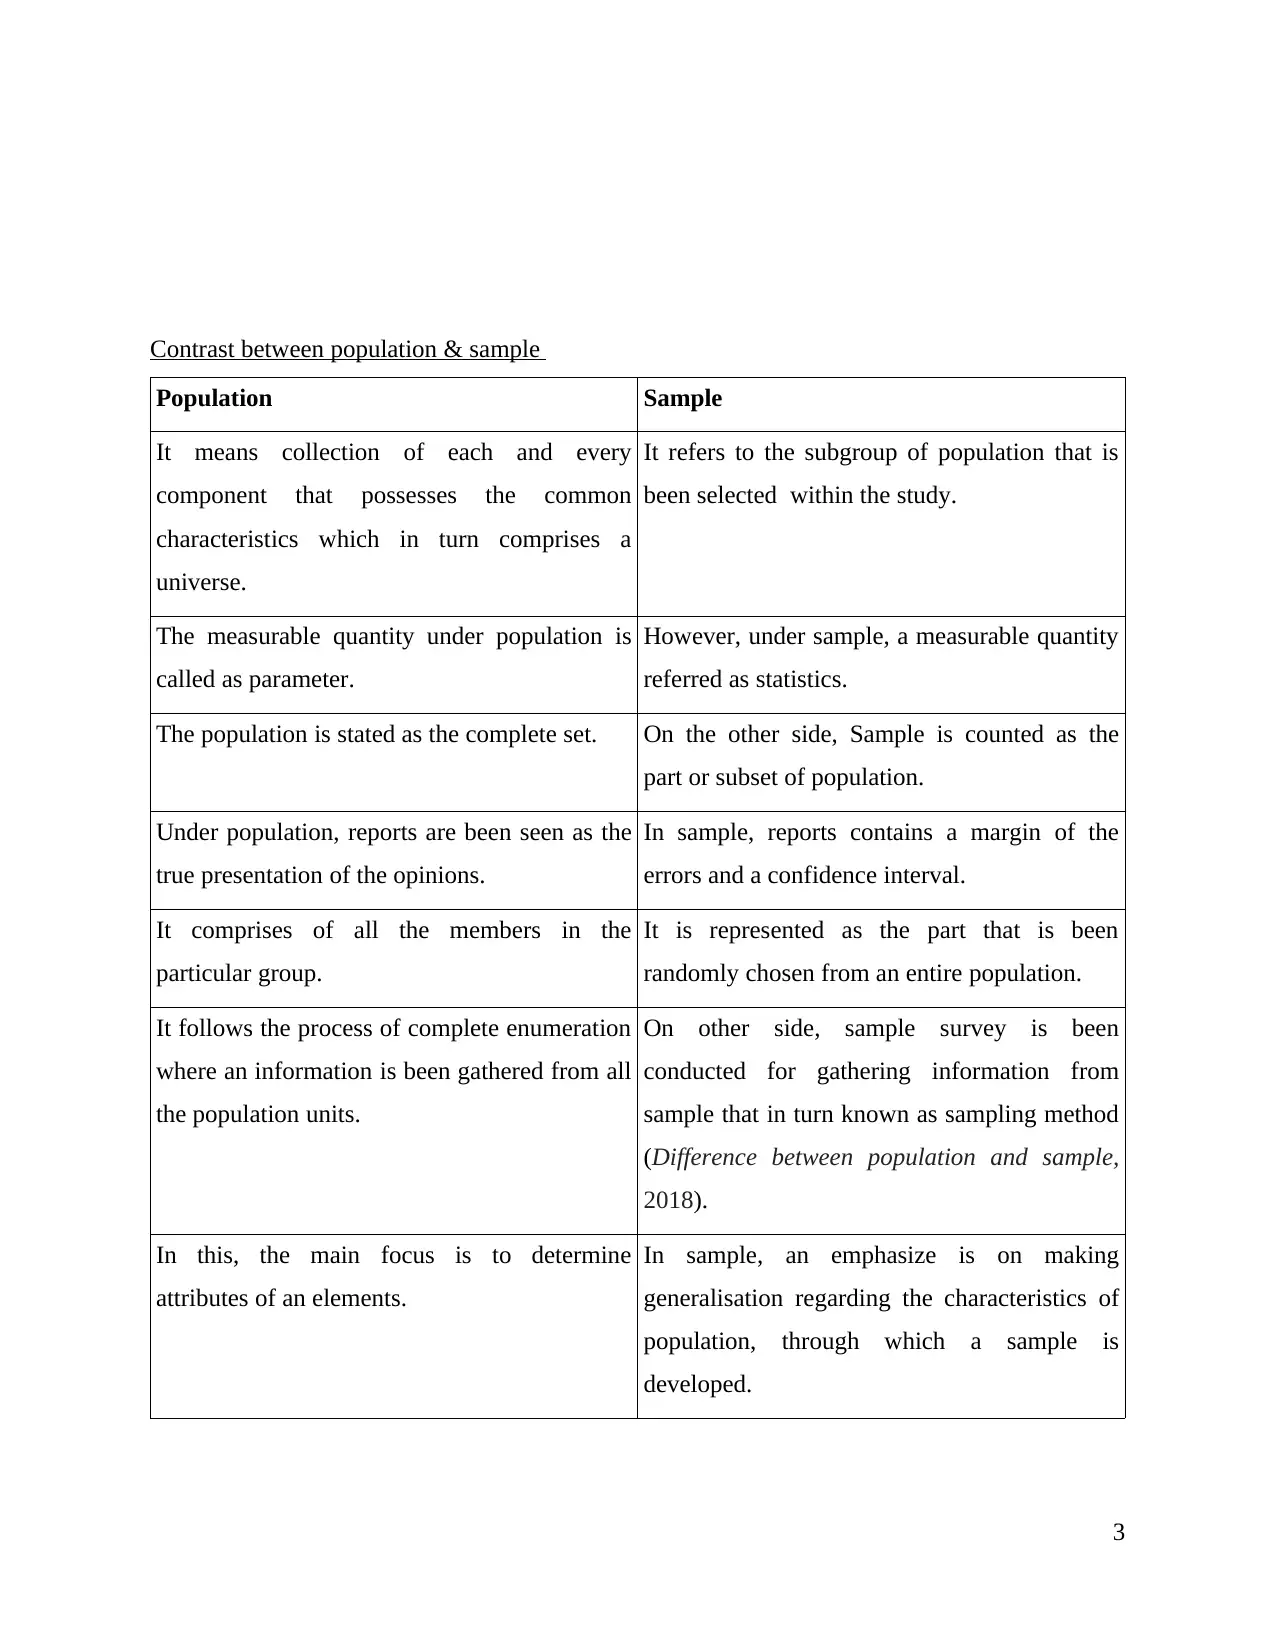
Contrast between population & sample
Population Sample
It means collection of each and every
component that possesses the common
characteristics which in turn comprises a
universe.
It refers to the subgroup of population that is
been selected within the study.
The measurable quantity under population is
called as parameter.
However, under sample, a measurable quantity
referred as statistics.
The population is stated as the complete set. On the other side, Sample is counted as the
part or subset of population.
Under population, reports are been seen as the
true presentation of the opinions.
In sample, reports contains a margin of the
errors and a confidence interval.
It comprises of all the members in the
particular group.
It is represented as the part that is been
randomly chosen from an entire population.
It follows the process of complete enumeration
where an information is been gathered from all
the population units.
On other side, sample survey is been
conducted for gathering information from
sample that in turn known as sampling method
(Difference between population and sample,
2018).
In this, the main focus is to determine
attributes of an elements.
In sample, an emphasize is on making
generalisation regarding the characteristics of
population, through which a sample is
developed.
3
Value of applying the statistical techniques in meeting the business objectives
In order to meet the business objectives effectively and efficiently, statistical techniques
are tend to be useful and valuable as it helps in planning of the business operations adequately
that relates to either the special projects or the recurring activities of an enterprise over the
specified time period. Statistical method helps in setting up of the standards for that relates to
size of an employment, sales volume, fixing quality norms for manufacturing the product, norms
fro daily output etc. It also ensures proper controlling that involves comparison of the actual
production attained against norm or the target set. At time when the production falls short, it
provides for corrective action so that deviation could be resolved.
Thus, in business, statistics helps in effective project planning, inventory planning,
budgetary control, quality control and personnel administration (Mohammadi, Hofman and Tan,
2018). There are many areas in the business within which application of the statistical techniques
is reflected as useful such as customer wants and the market research, specification and
development of design, packaging, purchasing production, inspection, complaints and
management control. Statistical methods act as measure that is used for ensuring quality of the
production, determining or rejecting the defective and substandard the goods. It helps in fixing
the sales target based on the sale forecast that are been done by making use of the varying
forecasting methods.
Managers uses statistical techniques in making decisions relating to facing of uncertainty
as it provides appropriate projections of sales, financial analysis of the capital expense proposals,
projecting new product, setting quantity and quality standards and making the sampling analysis
for determining product quality.
Explaining difference between inferential and the descriptive statistics
Inferential statistics Descriptive statistics
It means a kind of the statistics that emphasize
on inferring conclusion for sample assessment
It refers to the branch of the statistics that is
mainly concerned with describing a population
4
⊘ This is a preview!⊘
Do you want full access?
Subscribe today to unlock all pages.
Trusted by 1+ million students worldwide
and in generating observation regarding the
population.
within the study. s
Inferential statistics test, predicts and compares
the data in effective manner.
Descriptive statistics organizes, present and
analyse the data in presentable and meaningful
way.
In inferential method, the final result is been
displayed in form of the probability.
There is a diagrammatic and tabular
representation of the final results in the
descriptive statistics.
It explains likelihood of occurring an event in a
particular situation.
It describes the entire situation and indicates all
the events present in an overall situation.
This method attempts for reaching conclusions
in learning about conclusions which extends
beyond availability of the data.
This method explain that data which is been
already known for the purpose of summarizing
sample in an appropriate manner.
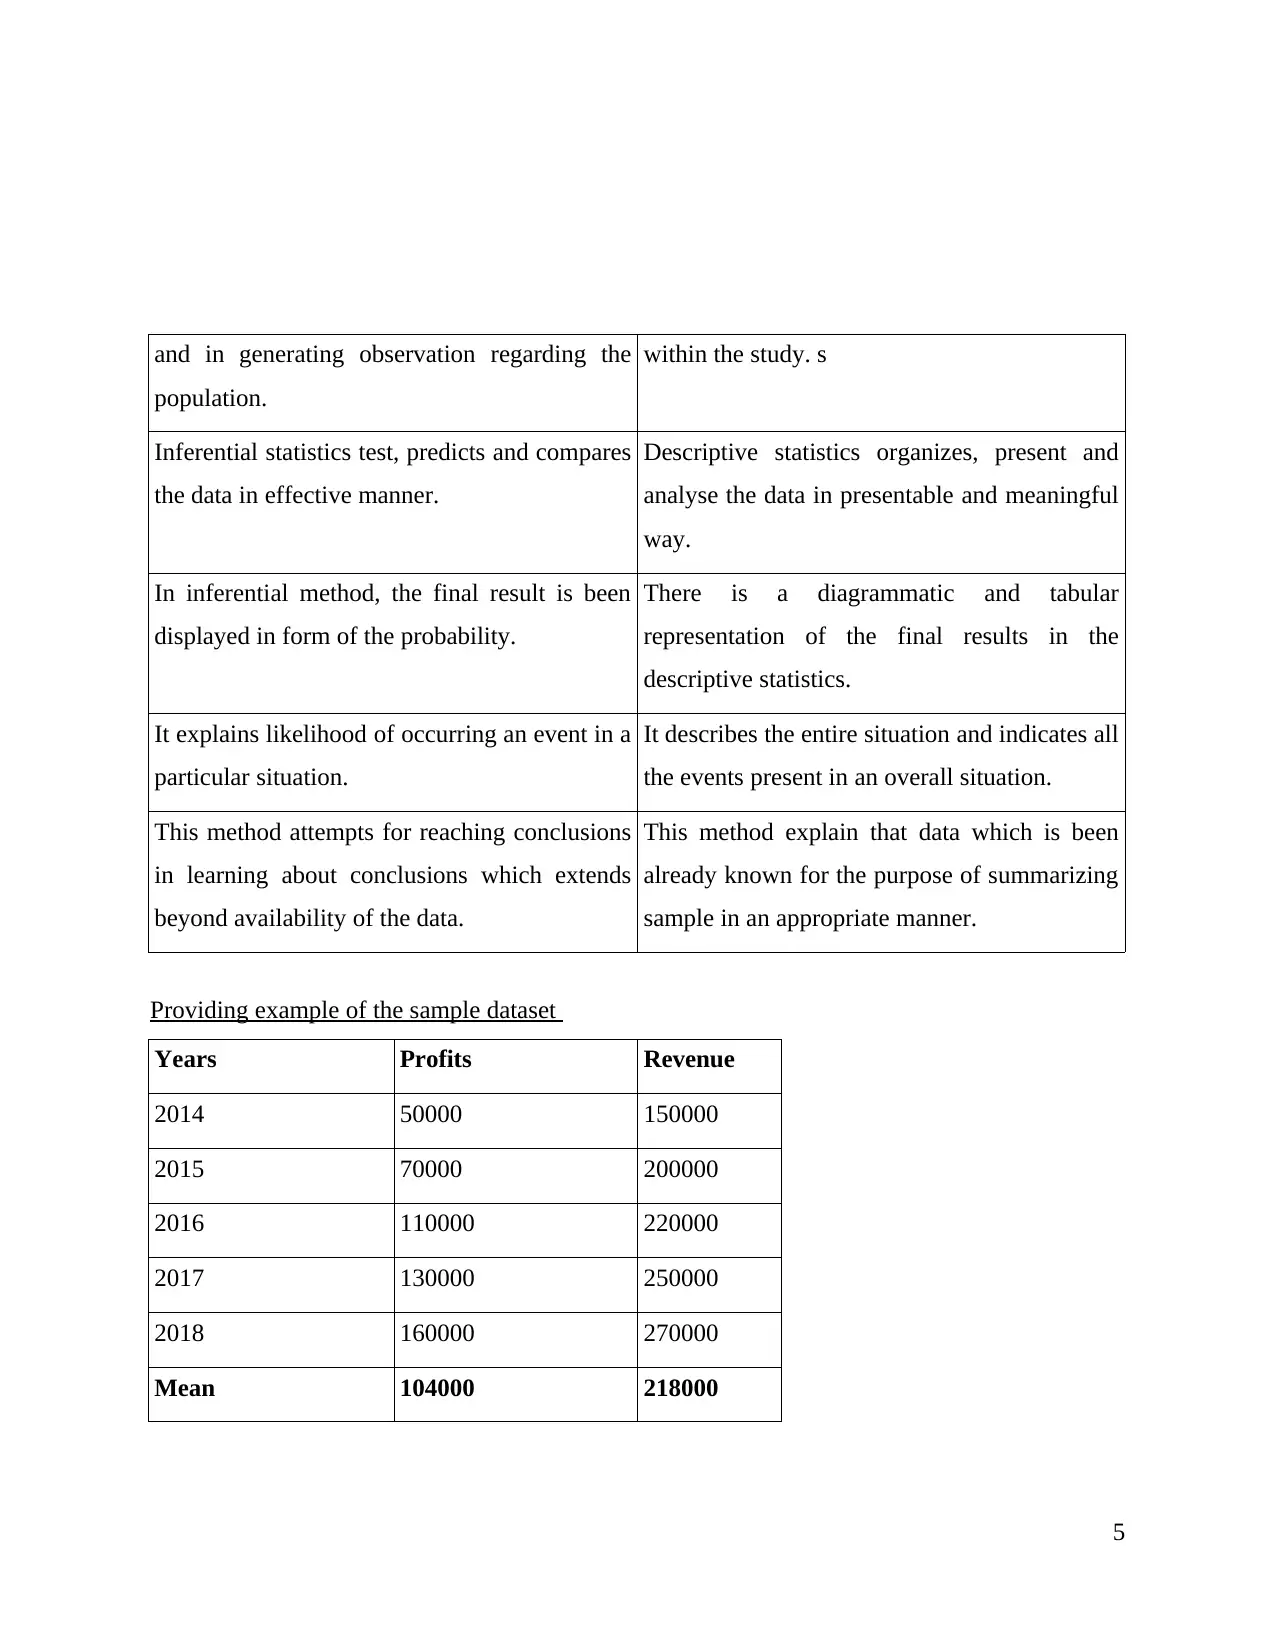
Providing example of the sample dataset
Years Profits Revenue
2014 50000 150000
2015 70000 200000
2016 110000 220000
2017 130000 250000
2018 160000 270000
Mean 104000 218000
5
population.
within the study. s
Inferential statistics test, predicts and compares
the data in effective manner.
Descriptive statistics organizes, present and
analyse the data in presentable and meaningful
way.
In inferential method, the final result is been
displayed in form of the probability.
There is a diagrammatic and tabular
representation of the final results in the
descriptive statistics.
It explains likelihood of occurring an event in a
particular situation.
It describes the entire situation and indicates all
the events present in an overall situation.
This method attempts for reaching conclusions
in learning about conclusions which extends
beyond availability of the data.
This method explain that data which is been
already known for the purpose of summarizing
sample in an appropriate manner.
Providing example of the sample dataset
Years Profits Revenue
2014 50000 150000
2015 70000 200000
2016 110000 220000
2017 130000 250000
2018 160000 270000
Mean 104000 218000
5
Paraphrase This Document
Need a fresh take? Get an instant paraphrase of this document with our AI Paraphraser
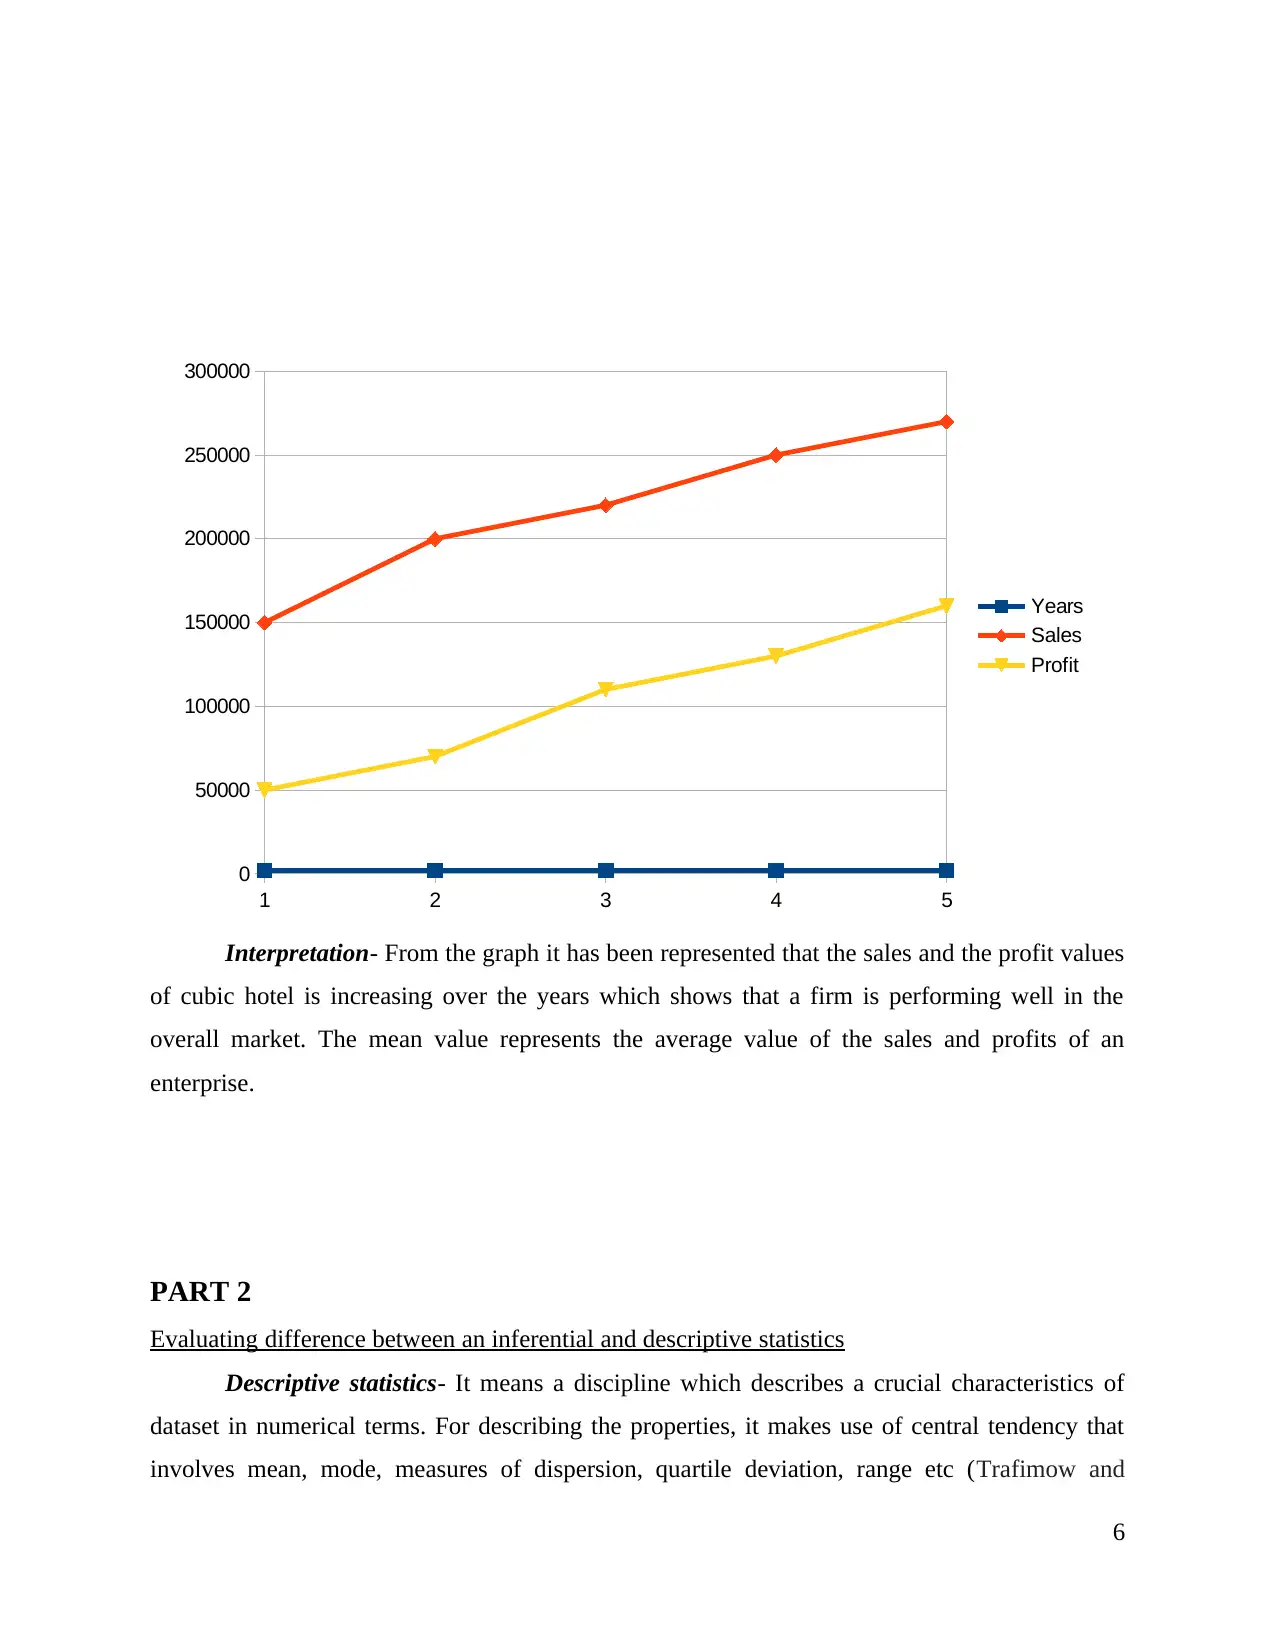
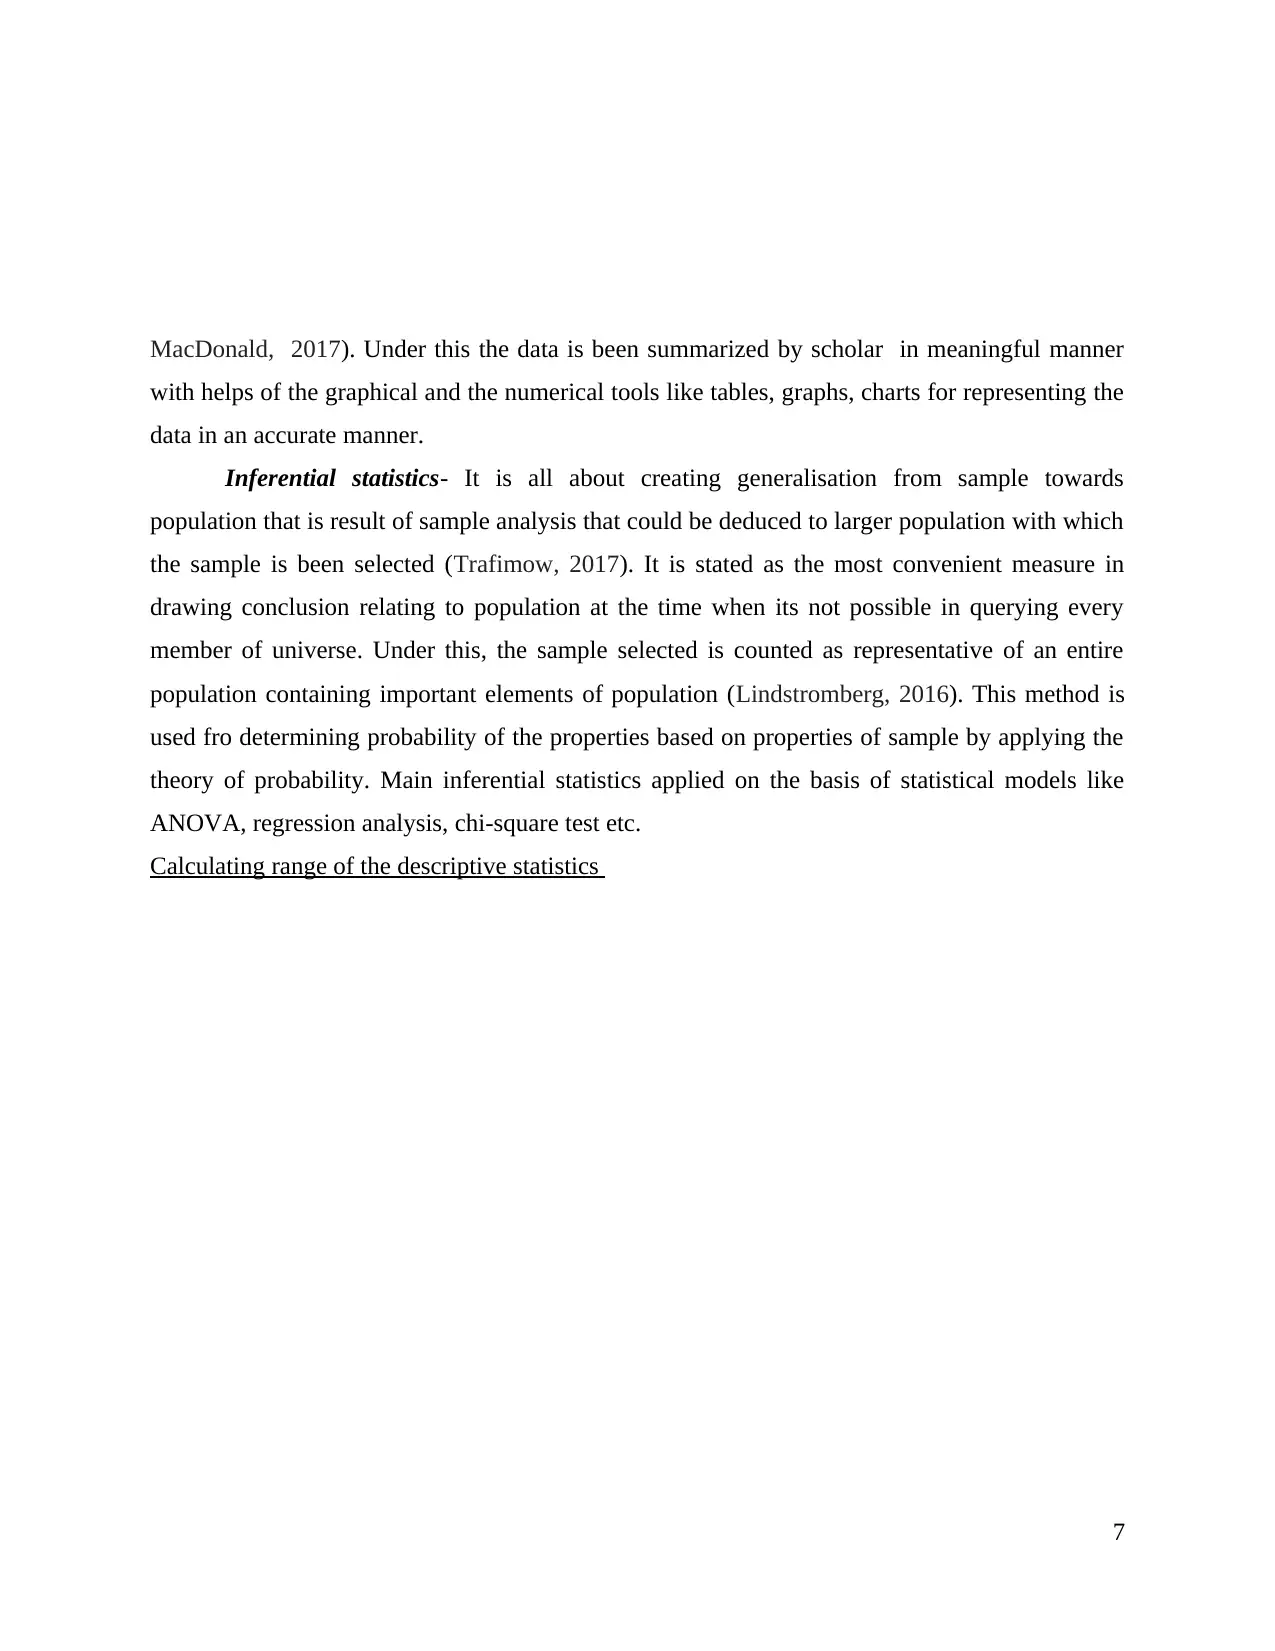
Interpretation- From the graph it has been represented that the sales and the profit values
of cubic hotel is increasing over the years which shows that a firm is performing well in the
overall market. The mean value represents the average value of the sales and profits of an
enterprise.
PART 2
Evaluating difference between an inferential and descriptive statistics
Descriptive statistics- It means a discipline which describes a crucial characteristics of
dataset in numerical terms. For describing the properties, it makes use of central tendency that
involves mean, mode, measures of dispersion, quartile deviation, range etc (Trafimow and
6
1 2 3 4 5
0
50000
100000
150000
200000
250000
300000
Years
Sales
Profit
MacDonald, 2017). Under this the data is been summarized by scholar in meaningful manner
with helps of the graphical and the numerical tools like tables, graphs, charts for representing the
data in an accurate manner.
Inferential statistics- It is all about creating generalisation from sample towards
population that is result of sample analysis that could be deduced to larger population with which
the sample is been selected (Trafimow, 2017). It is stated as the most convenient measure in
drawing conclusion relating to population at the time when its not possible in querying every
member of universe. Under this, the sample selected is counted as representative of an entire
population containing important elements of population (Lindstromberg, 2016). This method is
used fro determining probability of the properties based on properties of sample by applying the
theory of probability. Main inferential statistics applied on the basis of statistical models like
ANOVA, regression analysis, chi-square test etc.
Calculating range of the descriptive statistics
7
⊘ This is a preview!⊘
Do you want full access?
Subscribe today to unlock all pages.
Trusted by 1+ million students worldwide
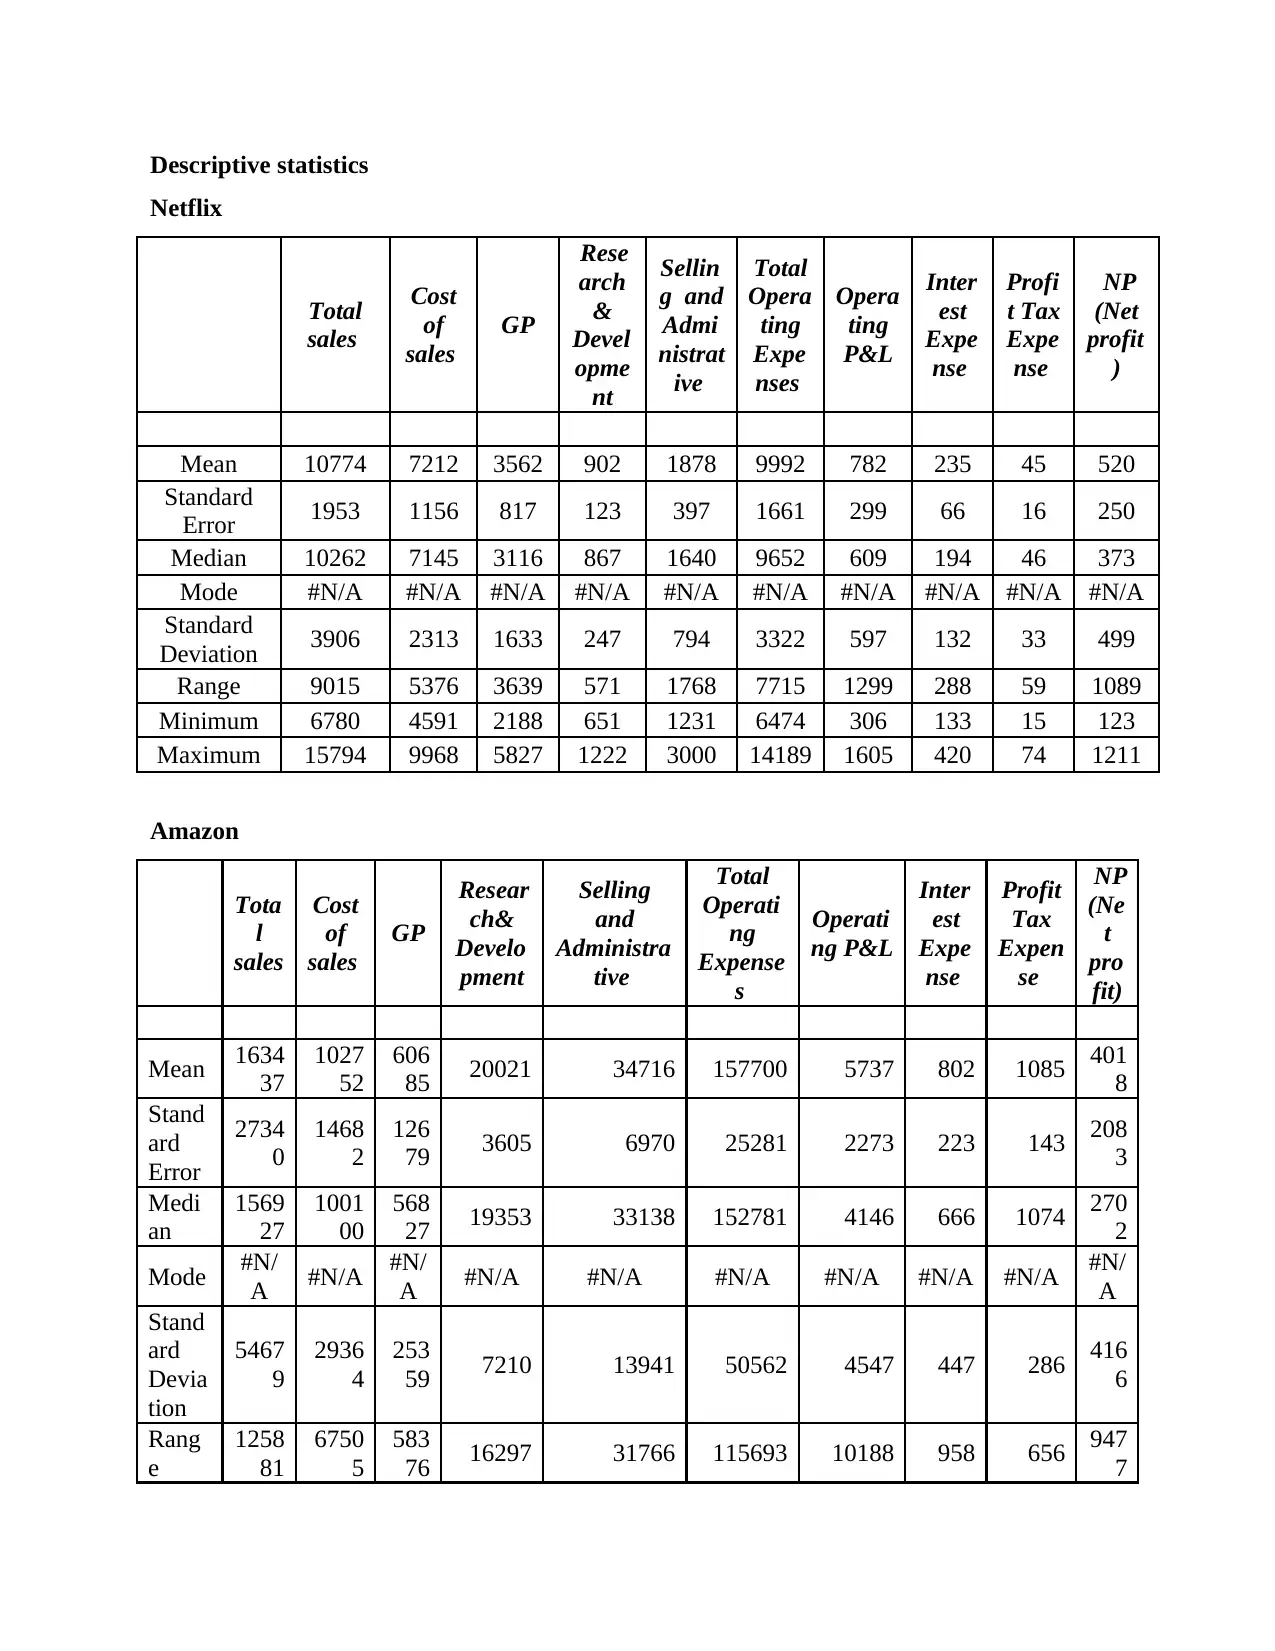
Descriptive statistics
Netflix
Total
sales
Cost
of
sales
GP
Rese
arch
&
Devel
opme
nt
Sellin
g and
Admi
nistrat
ive
Total
Opera
ting
Expe
nses
Opera
ting
P&L
Inter
est
Expe
nse
Profi
t Tax
Expe
nse
NP
(Net
profit
)
Mean 10774 7212 3562 902 1878 9992 782 235 45 520
Standard
Error 1953 1156 817 123 397 1661 299 66 16 250
Median 10262 7145 3116 867 1640 9652 609 194 46 373
Mode #N/A #N/A #N/A #N/A #N/A #N/A #N/A #N/A #N/A #N/A
Standard
Deviation 3906 2313 1633 247 794 3322 597 132 33 499
Range 9015 5376 3639 571 1768 7715 1299 288 59 1089
Minimum 6780 4591 2188 651 1231 6474 306 133 15 123
Maximum 15794 9968 5827 1222 3000 14189 1605 420 74 1211
Amazon
Tota
l
sales
Cost
of
sales
GP
Resear
ch&
Develo
pment
Selling
and
Administra
tive
Total
Operati
ng
Expense
s
Operati
ng P&L
Inter
est
Expe
nse
Profit
Tax
Expen
se
NP
(Ne
t
pro
fit)
Mean 1634
37
1027
52
606
85 20021 34716 157700 5737 802 1085 401
8
Stand
ard
Error
2734
0
1468
2
126
79 3605 6970 25281 2273 223 143 208
3
Medi
an
1569
27
1001
00
568
27 19353 33138 152781 4146 666 1074 270
2
Mode #N/
A #N/A #N/
A #N/A #N/A #N/A #N/A #N/A #N/A #N/
A
Stand
ard
Devia
tion
5467
9
2936
4
253
59 7210 13941 50562 4547 447 286 416
6
Rang
e
1258
81
6750
5
583
76 16297 31766 115693 10188 958 656 947
7
Paraphrase This Document
Need a fresh take? Get an instant paraphrase of this document with our AI Paraphraser
Mini
mum
1070
06
7165
1
353
55 12540 20411 104773 2233 459 769 596
Maxi
mum
2328
87
1391
56
937
31 28837 52177 220466 12421 1417 1425 100
73
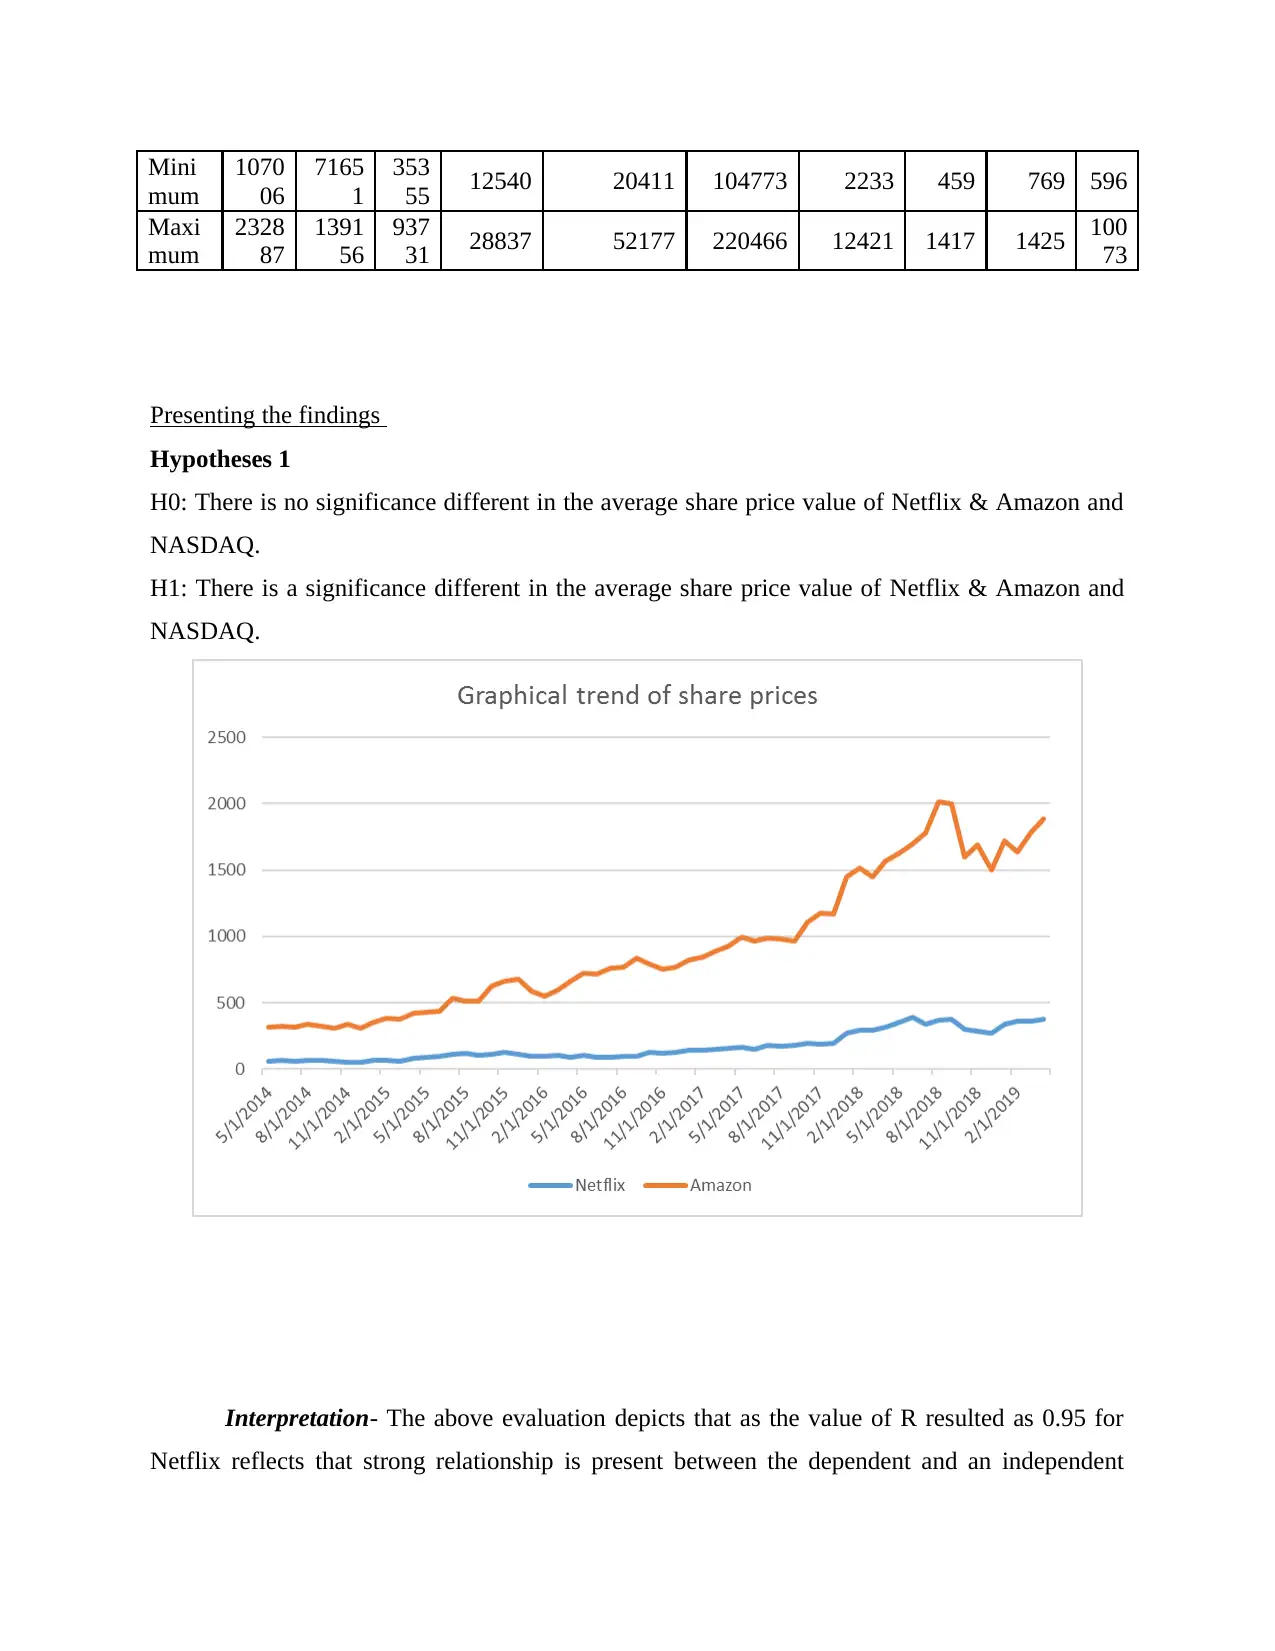
Presenting the findings
Hypotheses 1
H0: There is no significance different in the average share price value of Netflix & Amazon and
NASDAQ.
H1: There is a significance different in the average share price value of Netflix & Amazon and
NASDAQ.
Interpretation- The above evaluation depicts that as the value of R resulted as 0.95 for
Netflix reflects that strong relationship is present between the dependent and an independent
mum
1070
06
7165
1
353
55 12540 20411 104773 2233 459 769 596
Maxi
mum
2328
87
1391
56
937
31 28837 52177 220466 12421 1417 1425 100
73
Presenting the findings
Hypotheses 1
H0: There is no significance different in the average share price value of Netflix & Amazon and
NASDAQ.
H1: There is a significance different in the average share price value of Netflix & Amazon and
NASDAQ.
Interpretation- The above evaluation depicts that as the value of R resulted as 0.95 for
Netflix reflects that strong relationship is present between the dependent and an independent
variable. As the value of R square attained as 0.92 which means that positive as well as strong
relationship is seen among the variables. Moreover, the significance value as per the P-notation
calculator resulting to 0.000 that is lower than 0.05 which in turn indicates that alternative
hypotheses is accepted and the other one is rejected which means there present a significant
difference between average value of share price among the companies.
Apple (regression analysis)
Interpretation- The analysis shows that the value of R accounted as 0.97 represents a
stronger relationship among variables and R squares resulted as 0.94 which means change in one
variable has a greater impact and act as the big reason for change in another variable.
Furthermore, it has been presented that as significance value ascertained as 0.000 that is less than
0.05 which clearly means that alternative hypotheses is accepted and null hypotheses is rejected.
This also means that there is a significance difference in the average value of share price of the
companies and index in hypotheses.
CONCLUSION
By summing up the above report it has been assessed that statistics act as a crucial
element fro the organization in order to make accurate estimates regarding the future needs and
goals and the ways in which it could be attained effectively. Moreover, hypotheses shows that
significant difference is present between mean value in the share price of the organizations and
Index.
⊘ This is a preview!⊘
Do you want full access?
Subscribe today to unlock all pages.
Trusted by 1+ million students worldwide
1 out of 15
Related Documents


Your All-in-One AI-Powered Toolkit for Academic Success.
+13062052269
info@desklib.com
Available 24*7 on WhatsApp / Email
![[object Object]](/_next/static/media/star-bottom.7253800d.svg)
Unlock your academic potential
Copyright © 2020–2026 A2Z Services. All Rights Reserved. Developed and managed by ZUCOL.