Statistics for Management: Data Analysis, Interpretation and Methods

Verified

Added on  2023/01/19

|16
|675
|27
Report
AI Summary
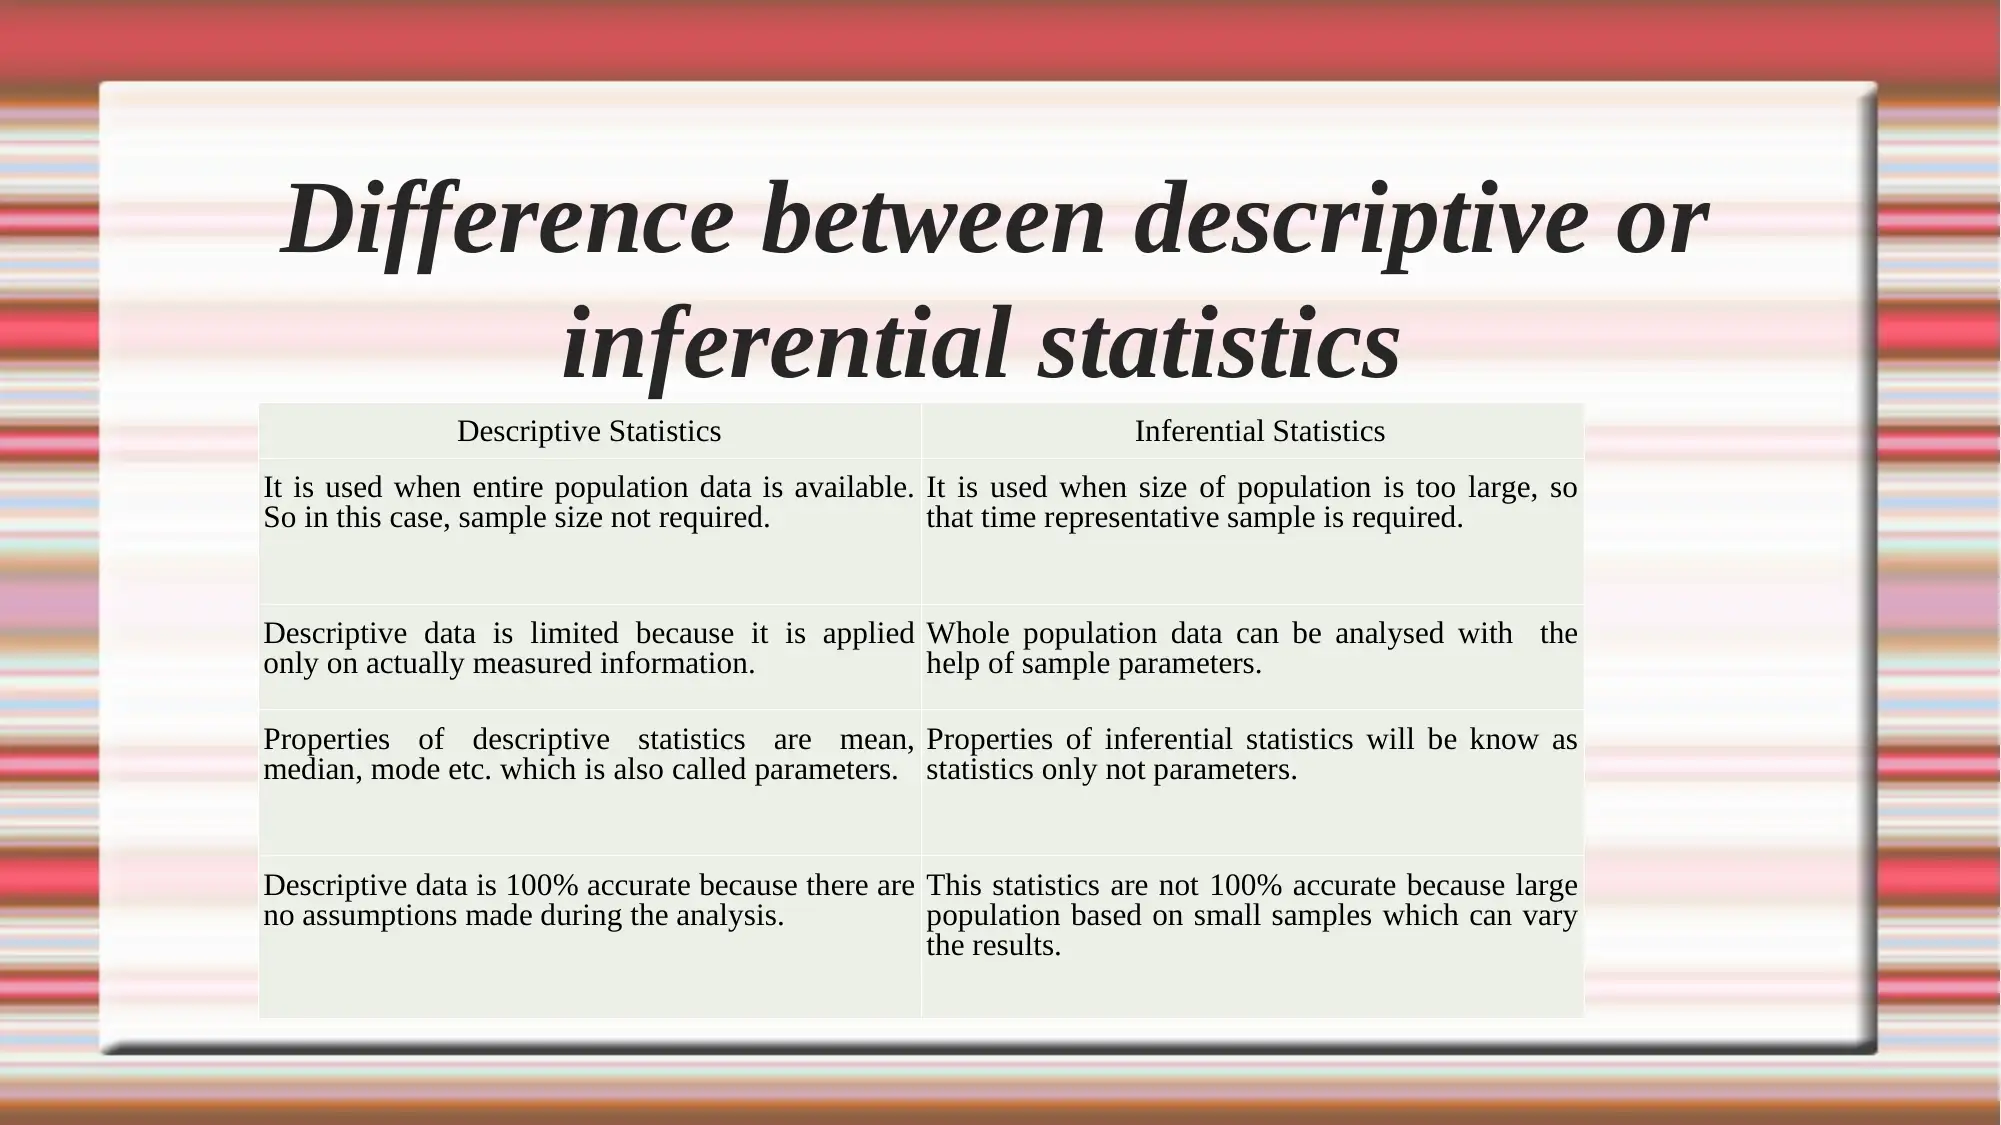
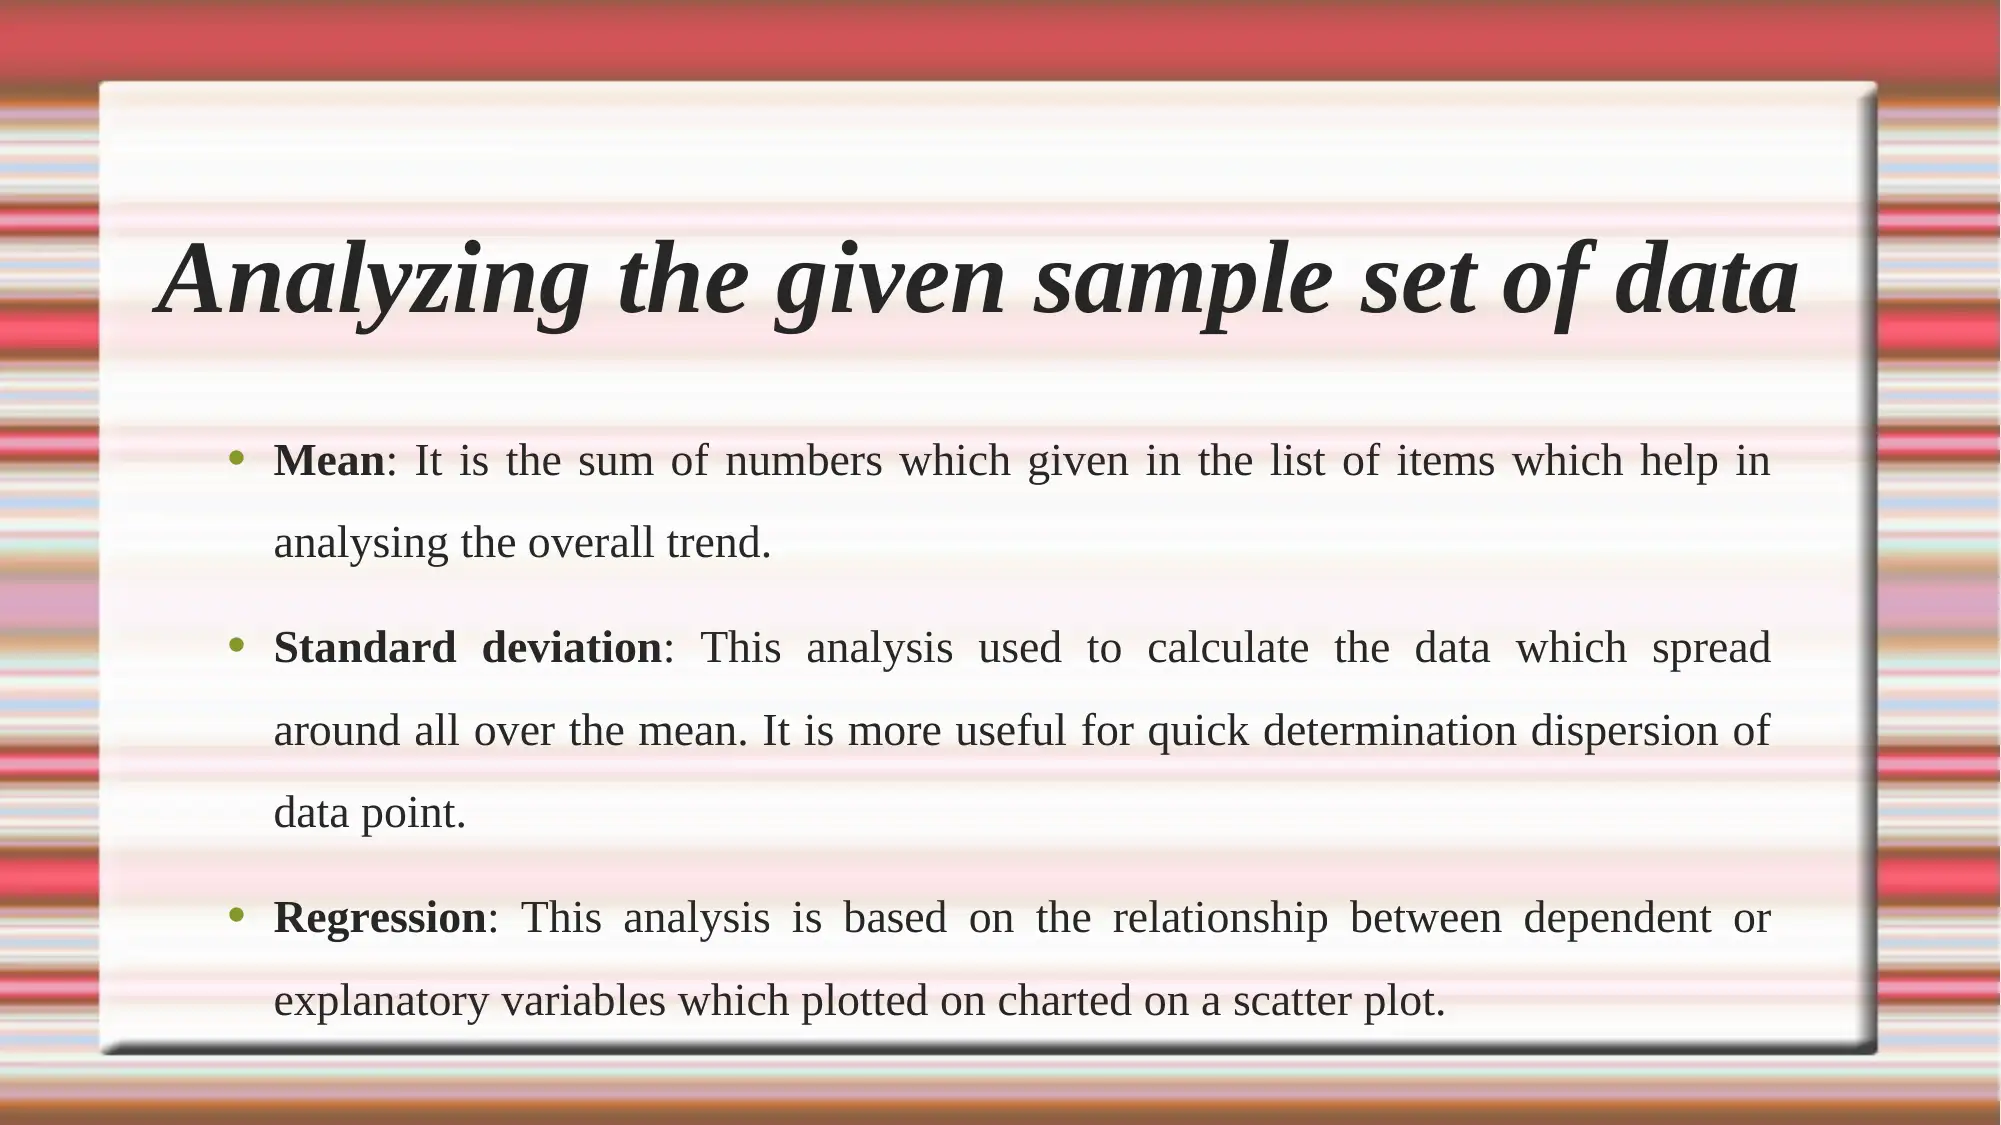
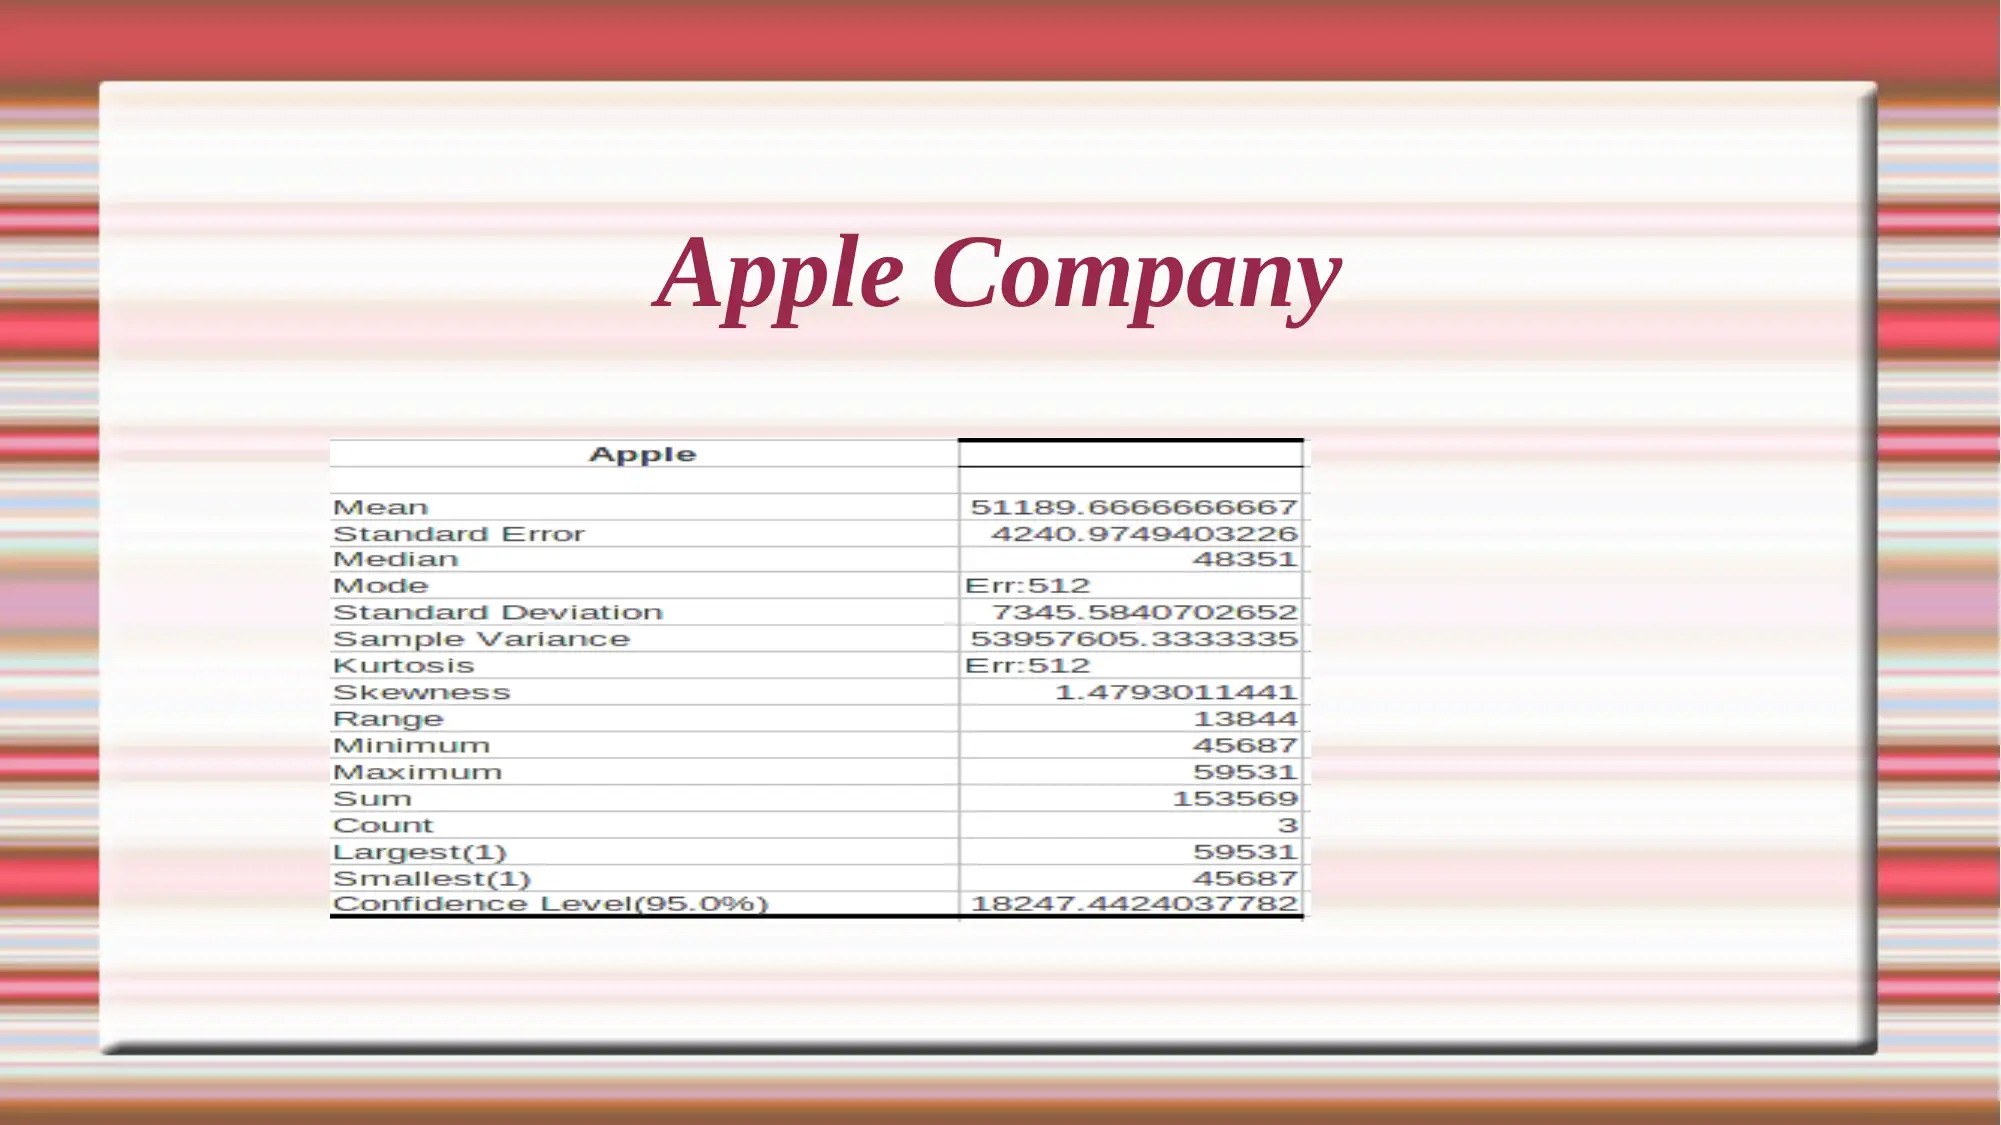
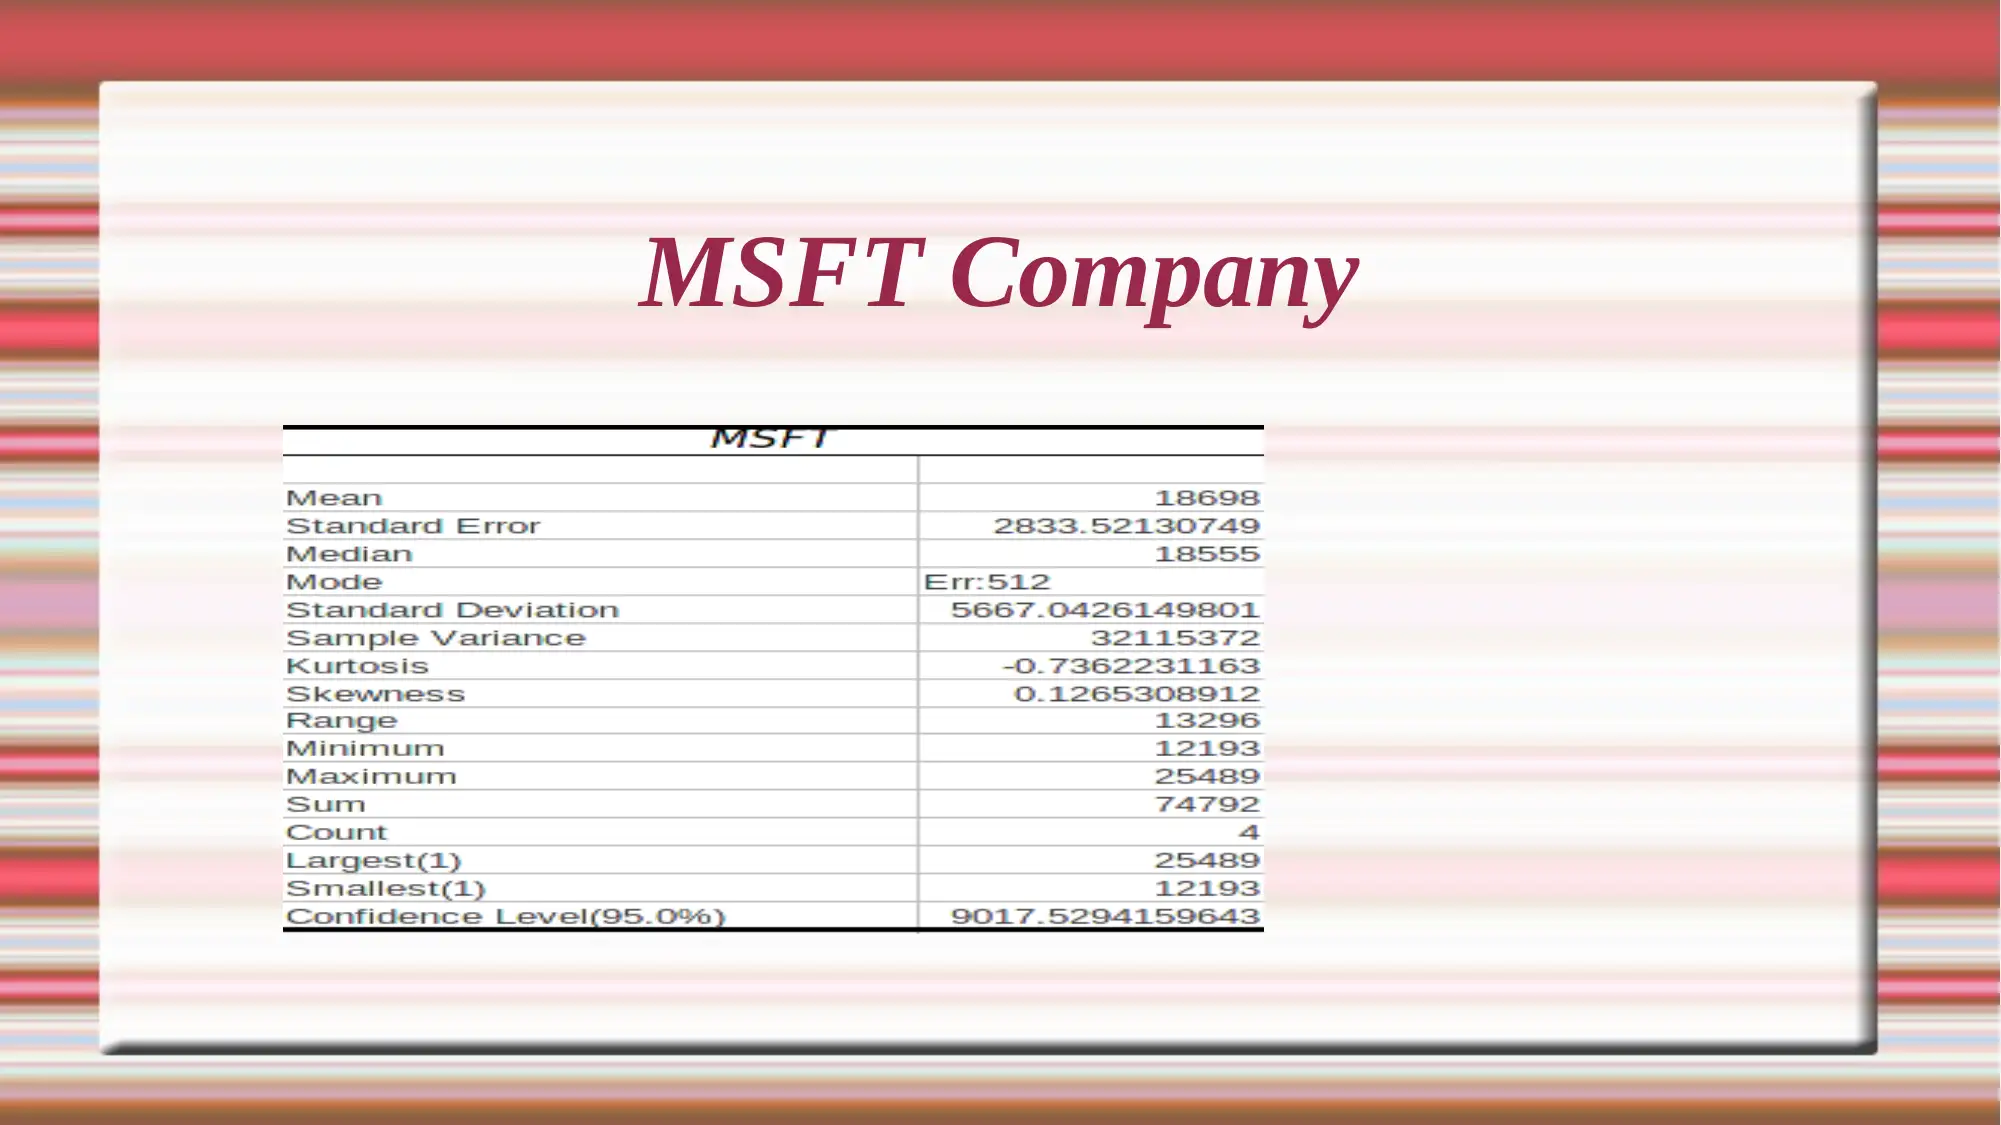
This report provides a comprehensive overview of statistical methods essential for management, encompassing data analysis, interpretation, and application. It begins by outlining key characteristics of statistics and their importance in organizational decision-making. The report differentiates between descriptive and inferential statistics, detailing their respective roles and methodologies. It explores various data sources, including print and online information, and emphasizes the importance of statistical analysis for evaluating business performance. The report further explains the concepts of mean, standard deviation, and regression analysis, illustrating their application in analyzing data. Finally, it presents financial information from companies like Apple, MSFT, Amazon, and Netflix, concluding with the significance of statistics in strategic decision-making and the effective implementation of business goals. The report also highlights the importance of selecting the appropriate statistical methods based on the size of the population and the specific objectives of the analysis. The report includes references to support the information provided.
Document Page
Statistics for Management
Part 1
Part 2
tabler-icon-diamond-filled.svg

Secure Best Marks with AI Grader

Need help grading? Try our AI Grader for instant feedback on your assignments.
Document Page
Key characteristics of statistics
It includes the aggregate facts
Data can be effected due to many cause
Data should be expressed in numerical form
Information should be collected in a systematic manner
Document Page
Overview of statistical methods
Descriptive Statistics: It is deal with the help presentation or collection of data
where initially statistical data should be analyse which is not so simple.
Inferential Statistics: This statistical method used to draw right conclusion with
the help of statistical analysis that used descriptive statistics.
Document Page
Type of data source and information
Print information: It include the vast area such as newspaper, books, microfiche
etc. federal government report also include in the print sources of data which
organizations can access.
Online information: In the current scenario of business environment, all the data
or information can easily available on online platform which help the
organization to access and used in the strategic development process.
tabler-icon-diamond-filled.svg

Secure Best Marks with AI Grader

Need help grading? Try our AI Grader for instant feedback on your assignments.
Document Page
Difference between sample or population
Sample Population
Sample includes a subset or a part of a population.
Size of sample always less than a size of population. It include all the set of specified group which comes
under the population such as all people living in the
UK.
Sample measurement characteristics called statistics
(Keller, 2015). Measurement characteristics of population such as
mean or standard deviation called parameter.
Document Page
Evaluation the value of employing
statistical method
With the help of statistics organization able to evaluate various
measurements which further helps in strategic decisions.
Statistics use numerical evidence in order to draw the valid or accurate
conclusion.
Statisticians know that how to implement data in effective manner in
order to avoid difficulty.
Document Page
Difference between descriptive or
inferential statistics
Descriptive Statistics Inferential Statistics
It is used when entire population data is available.
So in this case, sample size not required. It is used when size of population is too large, so
that time representative sample is required.
Descriptive data is limited because it is applied
only on actually measured information. Whole population data can be analysed with the
help of sample parameters.
Properties of descriptive statistics are mean,
median, mode etc. which is also called parameters. Properties of inferential statistics will be know as
statistics only not parameters.
Descriptive data is 100% accurate because there are
no assumptions made during the analysis. This statistics are not 100% accurate because large
population based on small samples which can vary
the results.
tabler-icon-diamond-filled.svg

Paraphrase This Document

Need a fresh take? Get an instant paraphrase of this document with our AI Paraphraser
Document Page
Analyzing the given sample set of data
Mean: It is the sum of numbers which given in the list of items which help in
analysing the overall trend.
Standard deviation: This analysis used to calculate the data which spread
around all over the mean. It is more useful for quick determination dispersion of
data point.
Regression: This analysis is based on the relationship between dependent or
explanatory variables which plotted on charted on a scatter plot.
Document Page
Financial Information
Document Page
Apple Company
tabler-icon-diamond-filled.svg

Secure Best Marks with AI Grader

Need help grading? Try our AI Grader for instant feedback on your assignments.
Document Page
MSFT Company
Document Page
Amazon Company
Document Page
Netflix Company
tabler-icon-diamond-filled.svg

Paraphrase This Document

Need a fresh take? Get an instant paraphrase of this document with our AI Paraphraser
Document Page
Conclusion
From the given presentation it has been concluded that, statistical is very
important for every organization in order to analyse data and build effective
strategic decisions.
Descriptive and inferential statistics used to evaluate data but it will be apply
according to the size of population. Statistics methods help the managers to
develop strategy and make sure to implement in effective manner which further
beneficial in meeting business objectives and goals.
Document Page
REFERENCES
Embrechts, P. and Hofert, M., 2014. Statistics and quantitative risk management for
banking and insurance. Annual Review of Statistics and Its Application. 1.
pp.493-514.
Keller, G., 2015. Statistics for Management and Economics, Abbreviated. Cengage
Learning.
Document Page
THANK YOU
chevron_up_icon
1 out of 16
circle_padding
hide_on_mobile
zoom_out_icon
[object Object]