Statistics for Management: Evaluating Business Data Report
VerifiedAdded on 2020/10/22
|19
|4821
|412
Report
AI Summary
This report on statistics for management evaluates business and economic information, employing various statistical methods for data analysis. It explores the nature of business and economic information, emphasizing both positive and normative approaches, and highlights the importance of statistical tools in decision-making, particularly in areas like sales and profit analysis. The report includes an analysis of data from several sources, using methods such as mean, median, mode, trend analysis, and correlation to evaluate business performance. It presents descriptive statistics, trend analysis, and correlation analyses with interpretations to assess sales and profit trends, supported by tables and graphs. Furthermore, the report discusses the application of statistical methods in business planning, particularly in quality, inventory, and capacity management. The findings are communicated using charts and tables, providing insights into the evaluation of business data and the application of statistical techniques to real-world scenarios.

Statistics for Management
Paraphrase This Document
Need a fresh take? Get an instant paraphrase of this document with our AI Paraphraser
TABLE OF CONTENTS
INTRODUCTION...........................................................................................................................1
LO1..................................................................................................................................................1
P1. Evaluating the nature and the process of business and economic information. ..............1
P2. Evaluating the data from several sources by using the method of analysis.....................2
P3. Analyzing and evaluating the qualitative as well as the quantitative business data with the
use of the statistical methods. ................................................................................................6
M2. Evaluating the difference between the descriptive and inferential statistics. ................9
LO 3...............................................................................................................................................11
P 4. Statistical methods in business planning for quality, inventory and capacity management.
..............................................................................................................................................11
LO4. ..............................................................................................................................................13
P5&M4&D3. Communicating and evaluating the findings for the number of the given
variables by using the charts and tables. .............................................................................13
CONCLUSION .............................................................................................................................14
REFERENCES..............................................................................................................................15
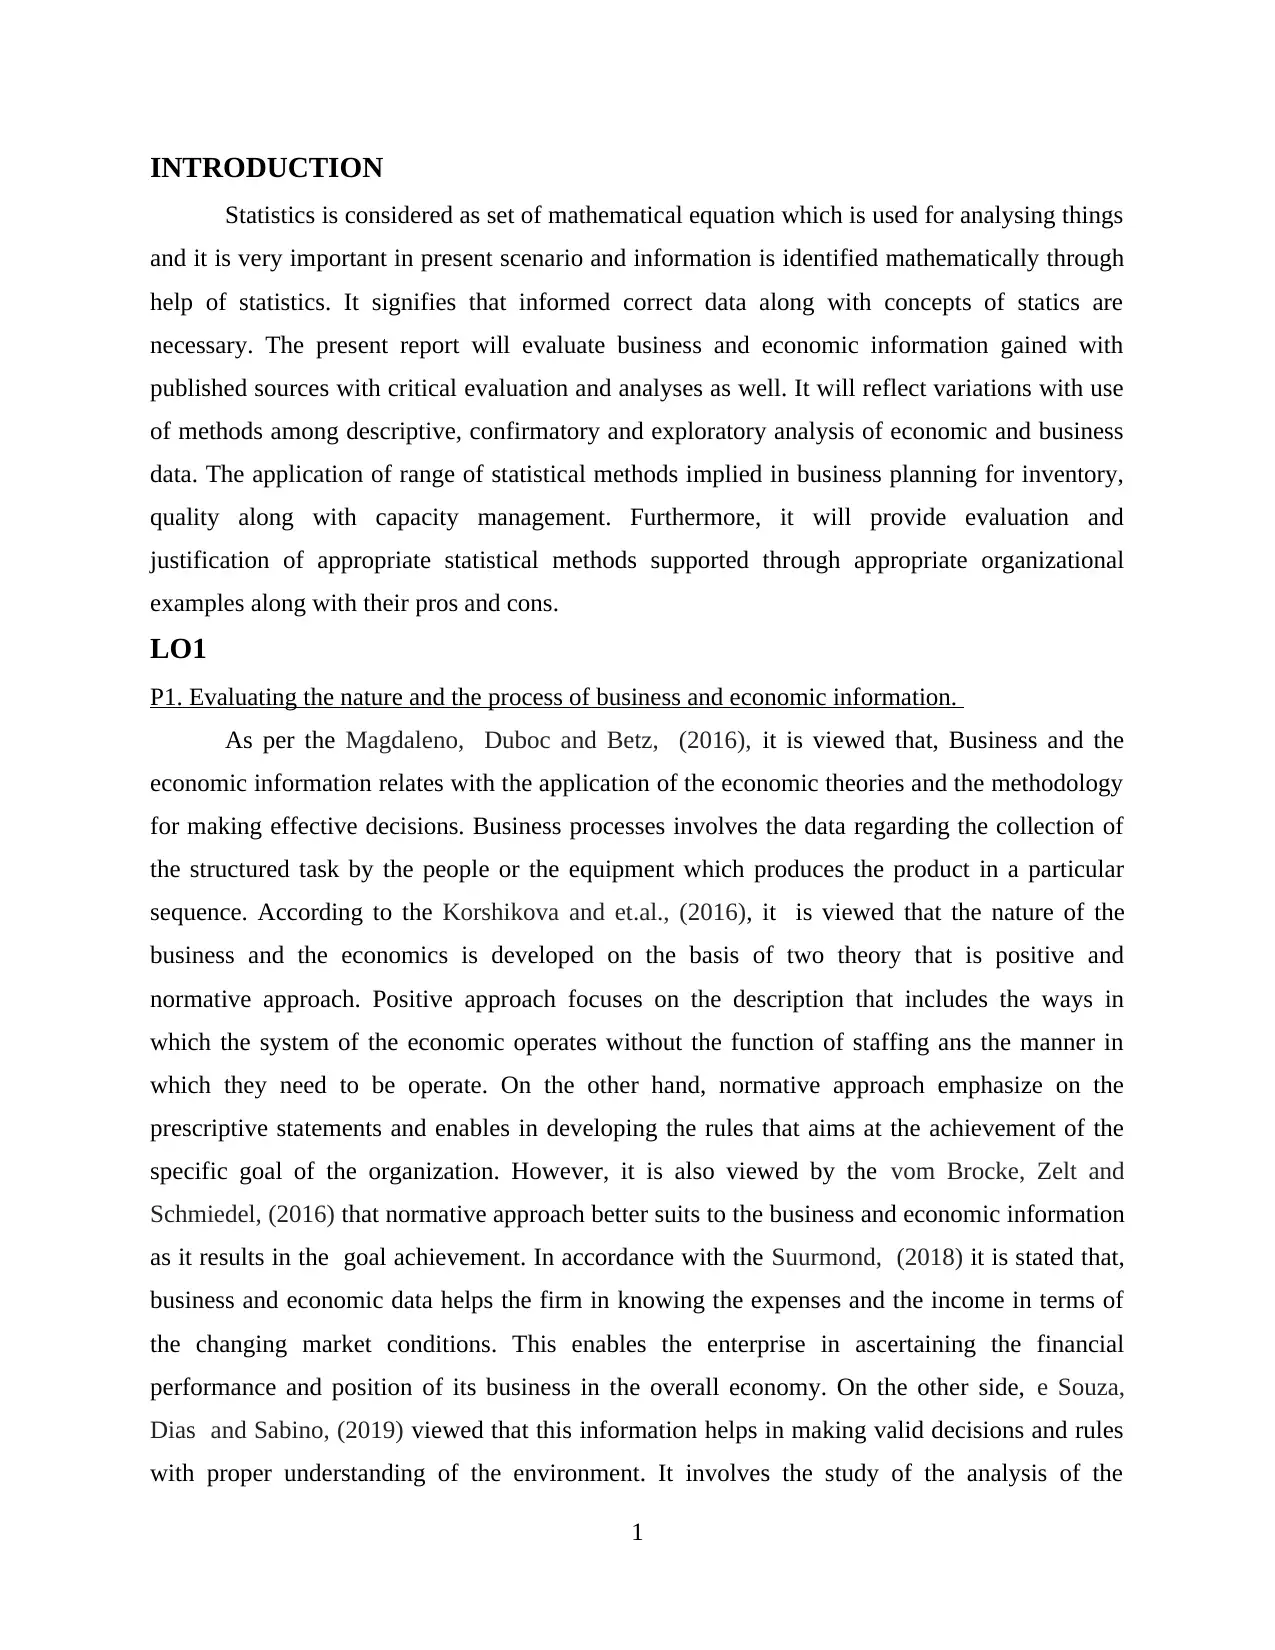
INTRODUCTION
Statistics is considered as set of mathematical equation which is used for analysing things
and it is very important in present scenario and information is identified mathematically through
help of statistics. It signifies that informed correct data along with concepts of statics are
necessary. The present report will evaluate business and economic information gained with
published sources with critical evaluation and analyses as well. It will reflect variations with use
of methods among descriptive, confirmatory and exploratory analysis of economic and business
data. The application of range of statistical methods implied in business planning for inventory,
quality along with capacity management. Furthermore, it will provide evaluation and
justification of appropriate statistical methods supported through appropriate organizational
examples along with their pros and cons.
LO1
P1. Evaluating the nature and the process of business and economic information.
As per the Magdaleno, Duboc and Betz, (2016), it is viewed that, Business and the
economic information relates with the application of the economic theories and the methodology
for making effective decisions. Business processes involves the data regarding the collection of
the structured task by the people or the equipment which produces the product in a particular
sequence. According to the Korshikova and et.al., (2016), it is viewed that the nature of the
business and the economics is developed on the basis of two theory that is positive and
normative approach. Positive approach focuses on the description that includes the ways in
which the system of the economic operates without the function of staffing ans the manner in
which they need to be operate. On the other hand, normative approach emphasize on the
prescriptive statements and enables in developing the rules that aims at the achievement of the
specific goal of the organization. However, it is also viewed by the vom Brocke, Zelt and
Schmiedel, (2016) that normative approach better suits to the business and economic information
as it results in the goal achievement. In accordance with the Suurmond, (2018) it is stated that,
business and economic data helps the firm in knowing the expenses and the income in terms of
the changing market conditions. This enables the enterprise in ascertaining the financial
performance and position of its business in the overall economy. On the other side, e Souza,
Dias and Sabino, (2019) viewed that this information helps in making valid decisions and rules
with proper understanding of the environment. It involves the study of the analysis of the
1
⊘ This is a preview!⊘
Do you want full access?
Subscribe today to unlock all pages.
Trusted by 1+ million students worldwide
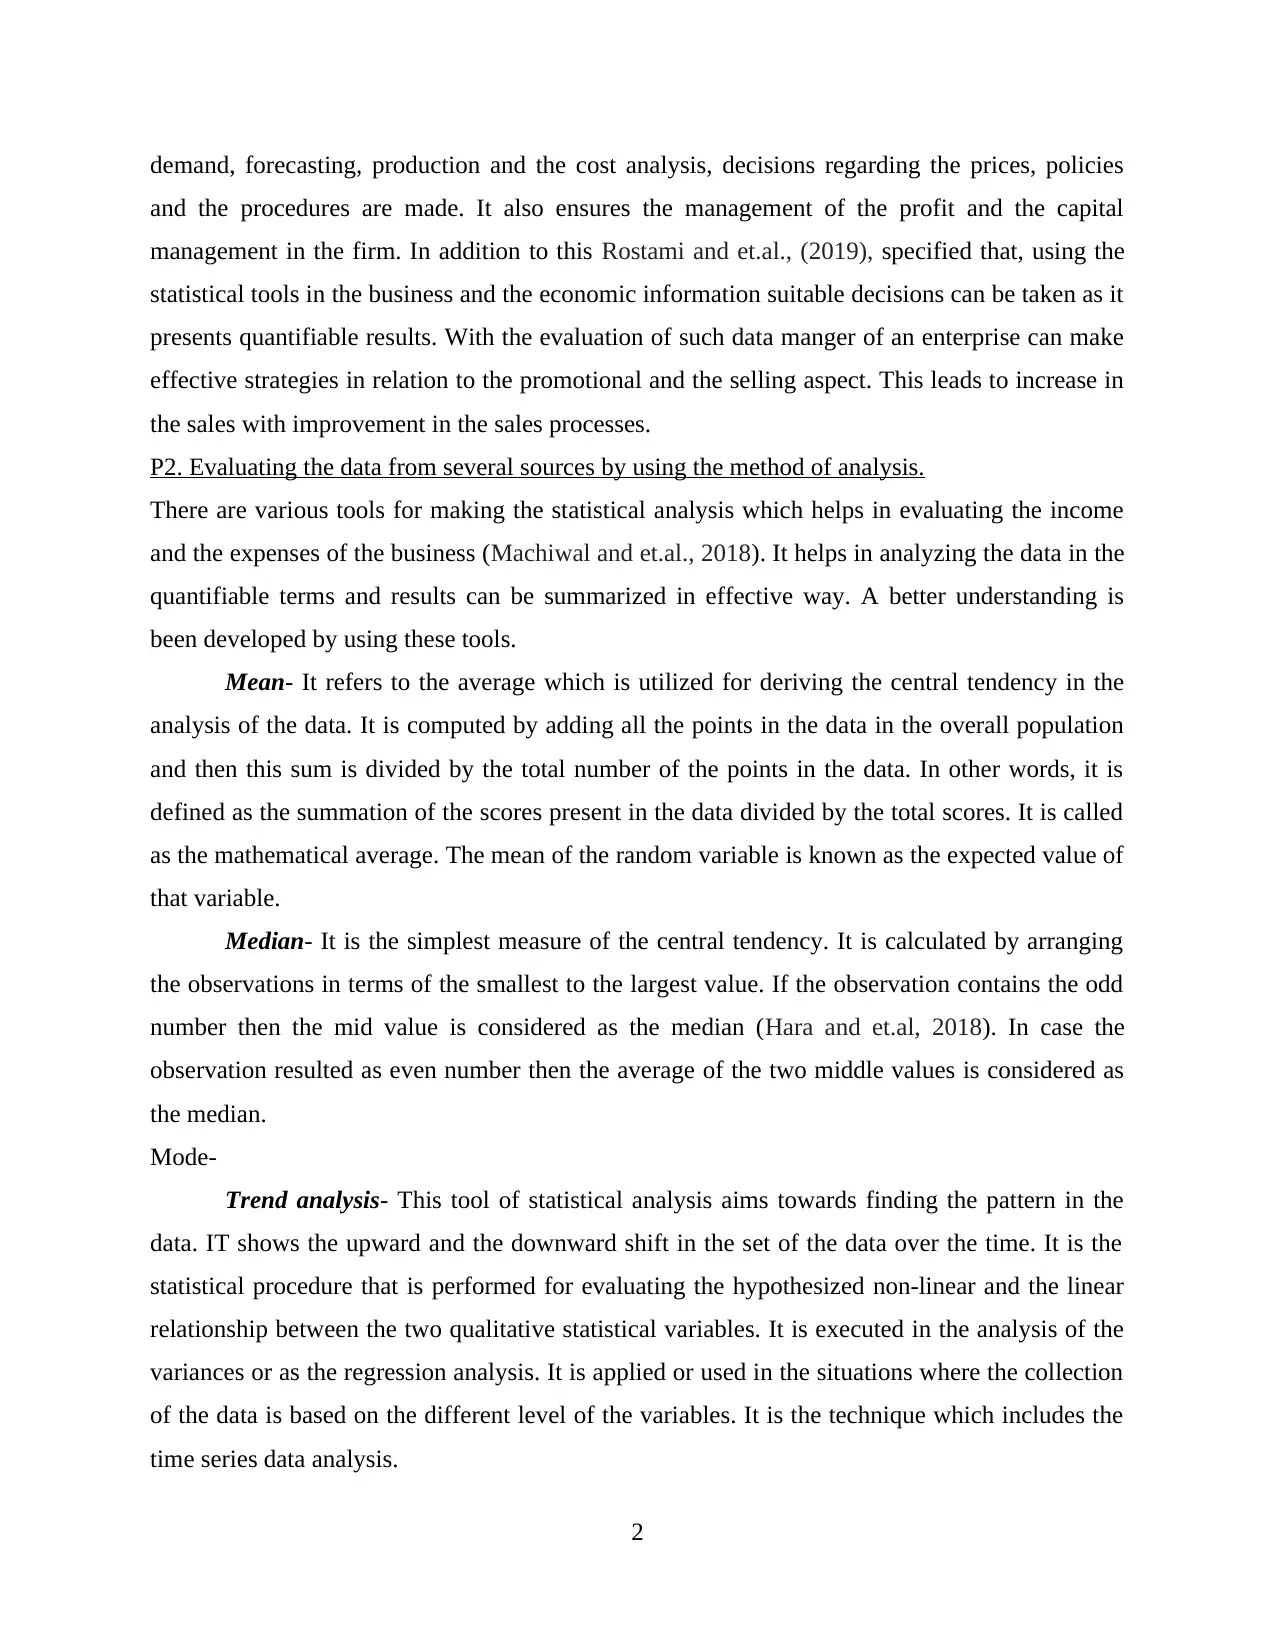
demand, forecasting, production and the cost analysis, decisions regarding the prices, policies
and the procedures are made. It also ensures the management of the profit and the capital
management in the firm. In addition to this Rostami and et.al., (2019), specified that, using the
statistical tools in the business and the economic information suitable decisions can be taken as it
presents quantifiable results. With the evaluation of such data manger of an enterprise can make
effective strategies in relation to the promotional and the selling aspect. This leads to increase in
the sales with improvement in the sales processes.
P2. Evaluating the data from several sources by using the method of analysis.
There are various tools for making the statistical analysis which helps in evaluating the income
and the expenses of the business (Machiwal and et.al., 2018). It helps in analyzing the data in the
quantifiable terms and results can be summarized in effective way. A better understanding is
been developed by using these tools.
Mean- It refers to the average which is utilized for deriving the central tendency in the
analysis of the data. It is computed by adding all the points in the data in the overall population
and then this sum is divided by the total number of the points in the data. In other words, it is
defined as the summation of the scores present in the data divided by the total scores. It is called
as the mathematical average. The mean of the random variable is known as the expected value of
that variable.
Median- It is the simplest measure of the central tendency. It is calculated by arranging
the observations in terms of the smallest to the largest value. If the observation contains the odd
number then the mid value is considered as the median (Hara and et.al, 2018). In case the
observation resulted as even number then the average of the two middle values is considered as
the median.
Mode-
Trend analysis- This tool of statistical analysis aims towards finding the pattern in the
data. IT shows the upward and the downward shift in the set of the data over the time. It is the
statistical procedure that is performed for evaluating the hypothesized non-linear and the linear
relationship between the two qualitative statistical variables. It is executed in the analysis of the
variances or as the regression analysis. It is applied or used in the situations where the collection
of the data is based on the different level of the variables. It is the technique which includes the
time series data analysis.
2
Paraphrase This Document
Need a fresh take? Get an instant paraphrase of this document with our AI Paraphraser
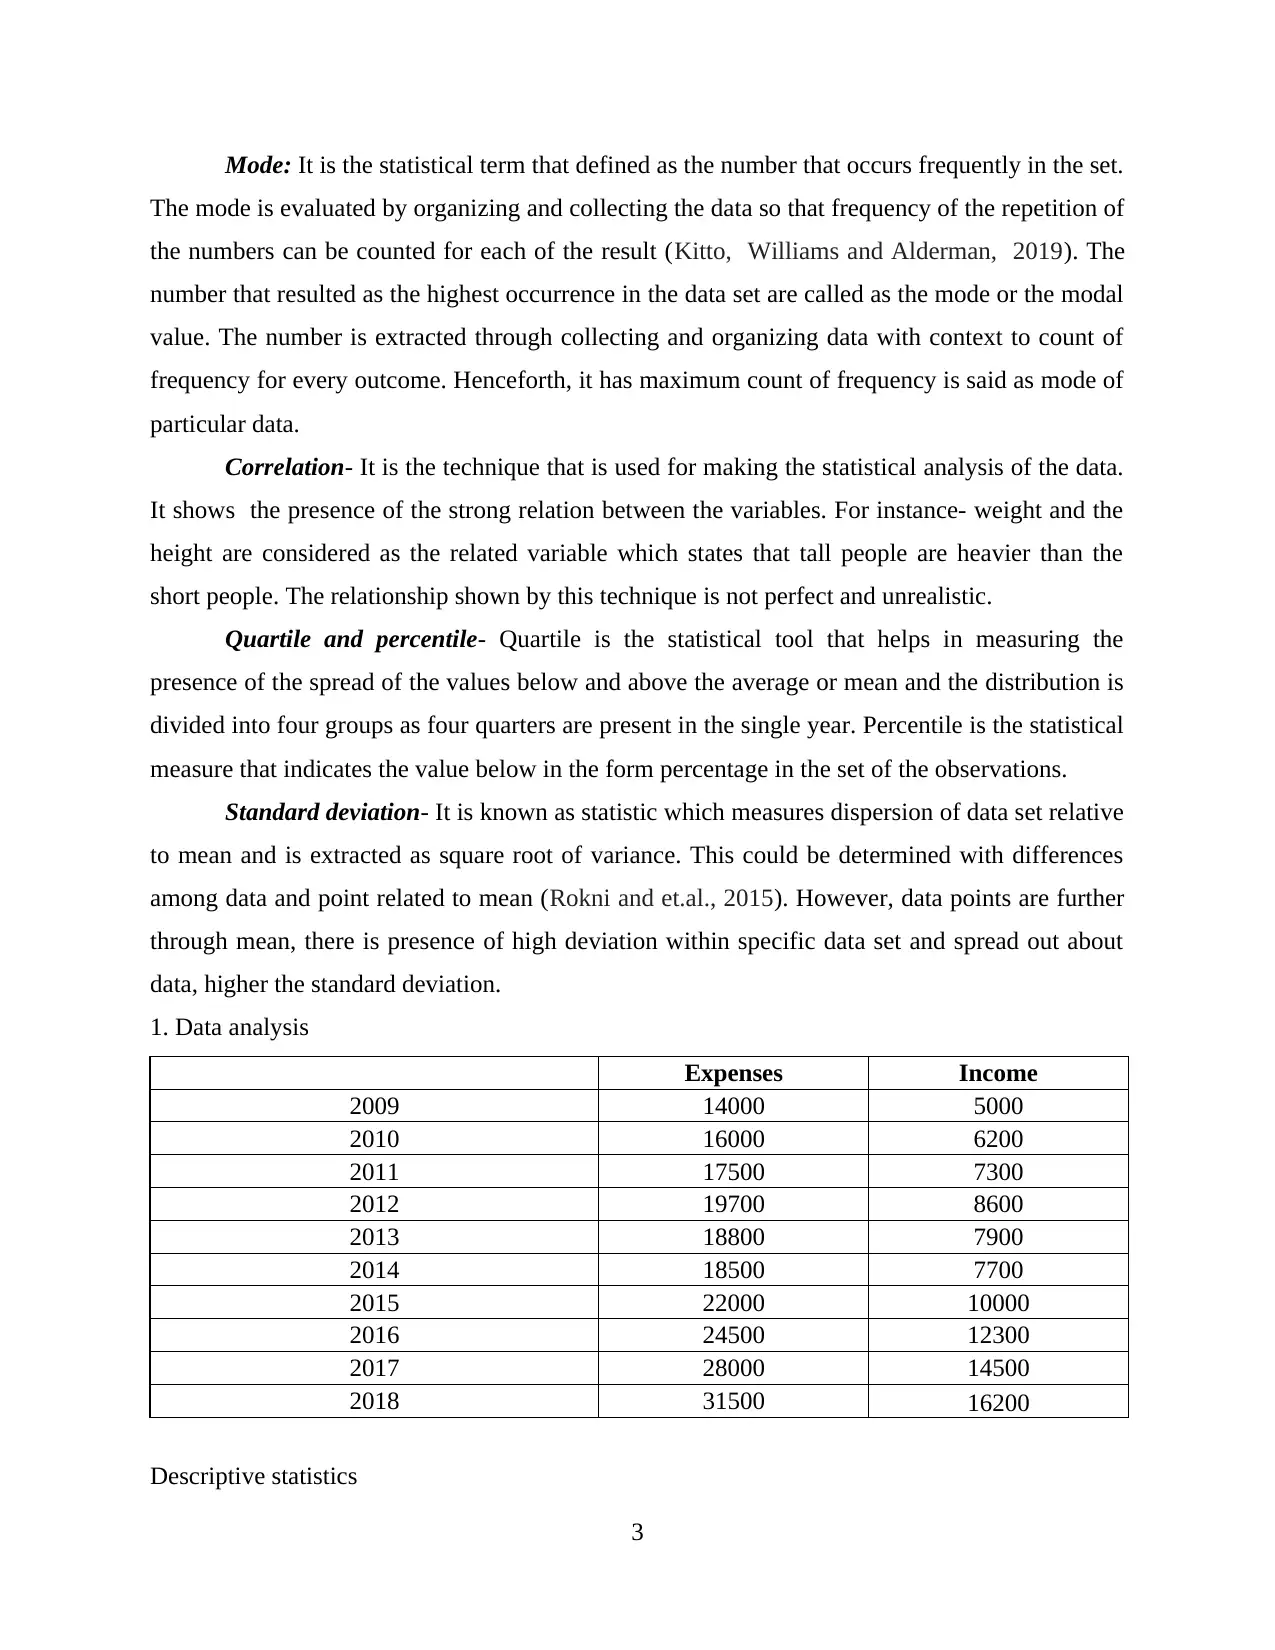
Mode: It is the statistical term that defined as the number that occurs frequently in the set.
The mode is evaluated by organizing and collecting the data so that frequency of the repetition of
the numbers can be counted for each of the result (Kitto, Williams and Alderman, 2019). The
number that resulted as the highest occurrence in the data set are called as the mode or the modal
value. The number is extracted through collecting and organizing data with context to count of
frequency for every outcome. Henceforth, it has maximum count of frequency is said as mode of
particular data.
Correlation- It is the technique that is used for making the statistical analysis of the data.
It shows the presence of the strong relation between the variables. For instance- weight and the
height are considered as the related variable which states that tall people are heavier than the
short people. The relationship shown by this technique is not perfect and unrealistic.
Quartile and percentile- Quartile is the statistical tool that helps in measuring the
presence of the spread of the values below and above the average or mean and the distribution is
divided into four groups as four quarters are present in the single year. Percentile is the statistical
measure that indicates the value below in the form percentage in the set of the observations.
Standard deviation- It is known as statistic which measures dispersion of data set relative
to mean and is extracted as square root of variance. This could be determined with differences
among data and point related to mean (Rokni and et.al., 2015). However, data points are further
through mean, there is presence of high deviation within specific data set and spread out about
data, higher the standard deviation.
1. Data analysis
Expenses Income
2009 14000 5000
2010 16000 6200
2011 17500 7300
2012 19700 8600
2013 18800 7900
2014 18500 7700
2015 22000 10000
2016 24500 12300
2017 28000 14500
2018 31500 16200
Descriptive statistics
3
Expenses Income
Mean 21050 Mean 9570
Standard Error 1736.87139 Standard Error 1157.20449
Median 19250 Median 8250
Mode #N/A Mode #N/A
Standard Deviation 5492.46959 Standard Deviation 3659.40189
Sample Variance 30167222.2 Sample Variance 13391222.2
Kurtosis -0.0820435 Kurtosis -0.4554151
Skewness 0.80841494 Skewness 0.77703668
Range 17500 Range 11200
Minimum 14000 Minimum 5000
Maximum 31500 Maximum 16200
Sum 210500 Sum 95700
Count 10 Count 10
Particulars Expenses Income
Quartile 1 17750 7400
Quartile 2 19250 8250
Quartile 3 23875 11725
Particulars Expenses Income
Expenses 1 0.99
Income 0.99 1
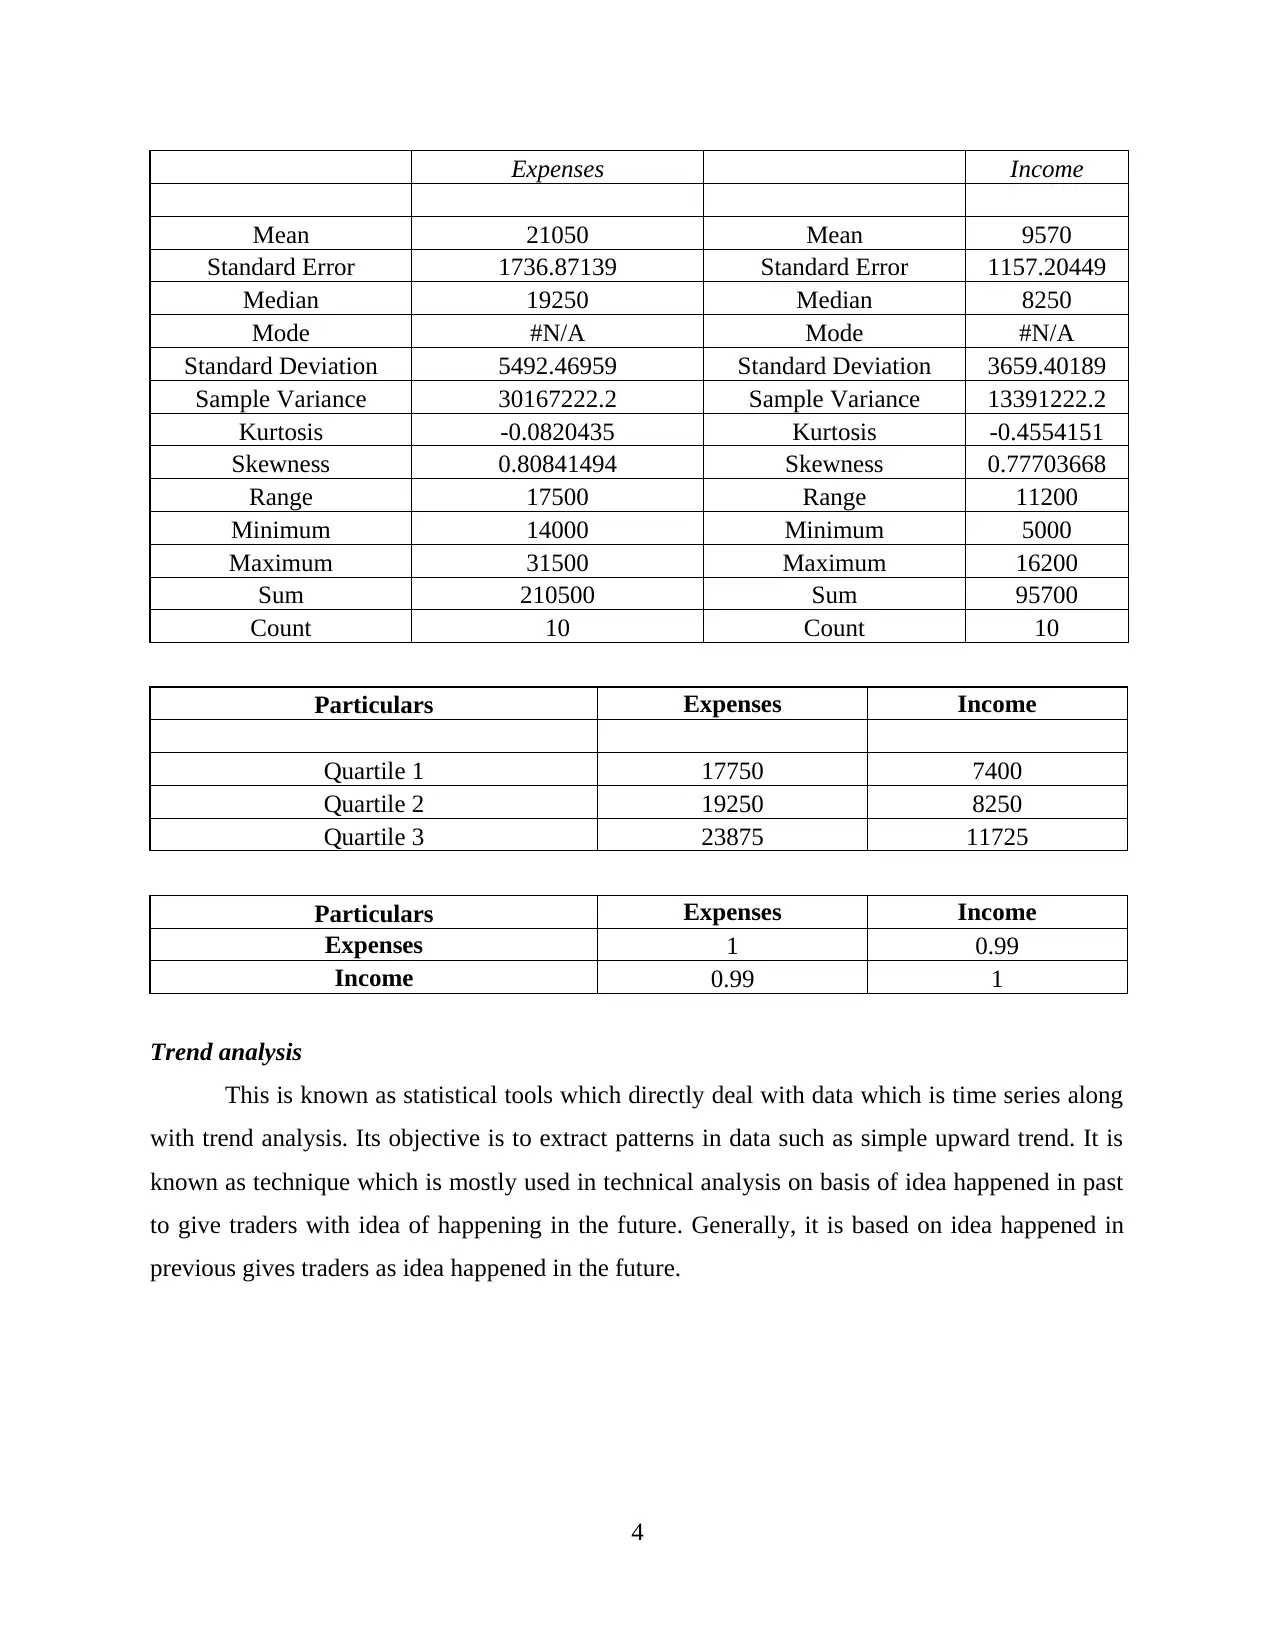
Trend analysis
This is known as statistical tools which directly deal with data which is time series along
with trend analysis. Its objective is to extract patterns in data such as simple upward trend. It is
known as technique which is mostly used in technical analysis on basis of idea happened in past
to give traders with idea of happening in the future. Generally, it is based on idea happened in
previous gives traders as idea happened in the future.
4
Mean 21050 Mean 9570
Standard Error 1736.87139 Standard Error 1157.20449
Median 19250 Median 8250
Mode #N/A Mode #N/A
Standard Deviation 5492.46959 Standard Deviation 3659.40189
Sample Variance 30167222.2 Sample Variance 13391222.2
Kurtosis -0.0820435 Kurtosis -0.4554151
Skewness 0.80841494 Skewness 0.77703668
Range 17500 Range 11200
Minimum 14000 Minimum 5000
Maximum 31500 Maximum 16200
Sum 210500 Sum 95700
Count 10 Count 10
Particulars Expenses Income
Quartile 1 17750 7400
Quartile 2 19250 8250
Quartile 3 23875 11725
Particulars Expenses Income
Expenses 1 0.99
Income 0.99 1
Trend analysis
This is known as statistical tools which directly deal with data which is time series along
with trend analysis. Its objective is to extract patterns in data such as simple upward trend. It is
known as technique which is mostly used in technical analysis on basis of idea happened in past
to give traders with idea of happening in the future. Generally, it is based on idea happened in
previous gives traders as idea happened in the future.
4
⊘ This is a preview!⊘
Do you want full access?
Subscribe today to unlock all pages.
Trusted by 1+ million students worldwide
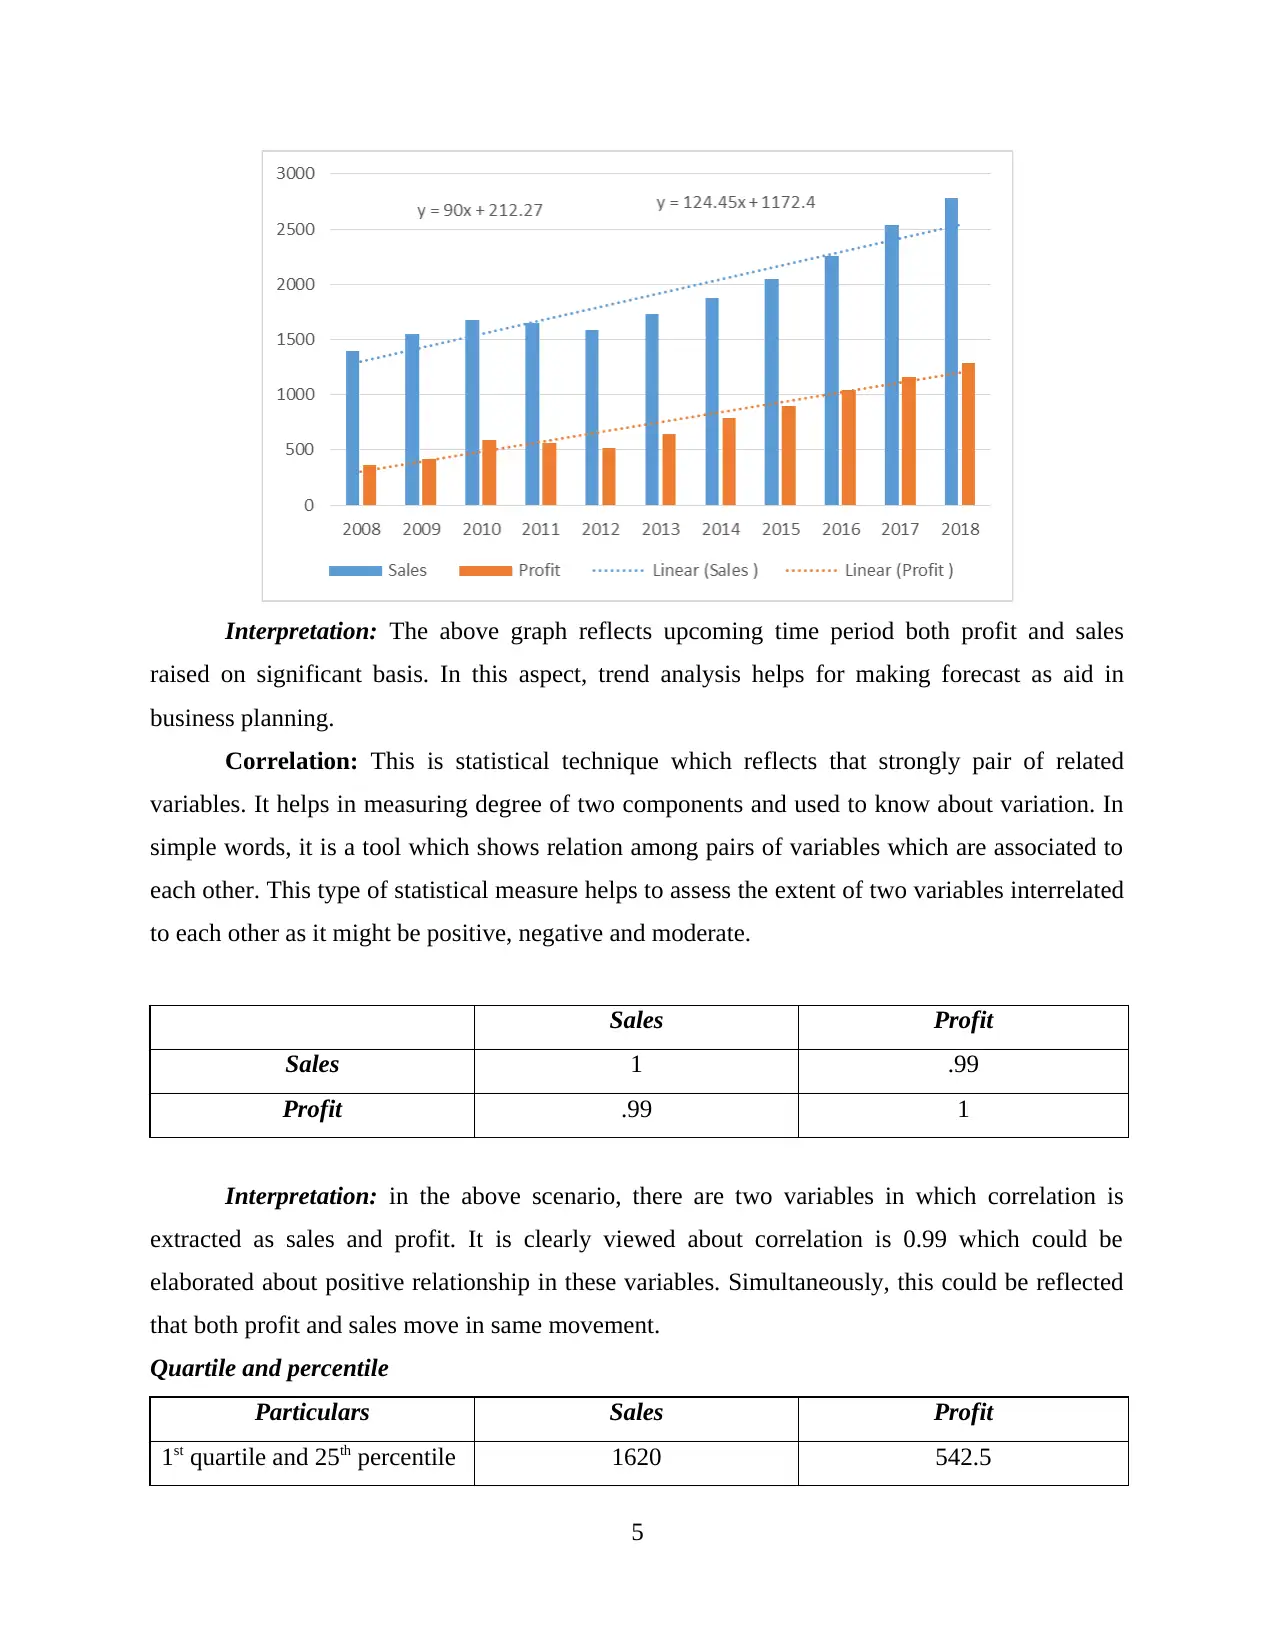
Interpretation: The above graph reflects upcoming time period both profit and sales
raised on significant basis. In this aspect, trend analysis helps for making forecast as aid in
business planning.
Correlation: This is statistical technique which reflects that strongly pair of related
variables. It helps in measuring degree of two components and used to know about variation. In
simple words, it is a tool which shows relation among pairs of variables which are associated to
each other. This type of statistical measure helps to assess the extent of two variables interrelated
to each other as it might be positive, negative and moderate.
Sales Profit
Sales 1 .99
Profit .99 1
Interpretation: in the above scenario, there are two variables in which correlation is
extracted as sales and profit. It is clearly viewed about correlation is 0.99 which could be
elaborated about positive relationship in these variables. Simultaneously, this could be reflected
that both profit and sales move in same movement.
Quartile and percentile
Particulars Sales Profit
1st quartile and 25th percentile 1620 542.5
5
Paraphrase This Document
Need a fresh take? Get an instant paraphrase of this document with our AI Paraphraser
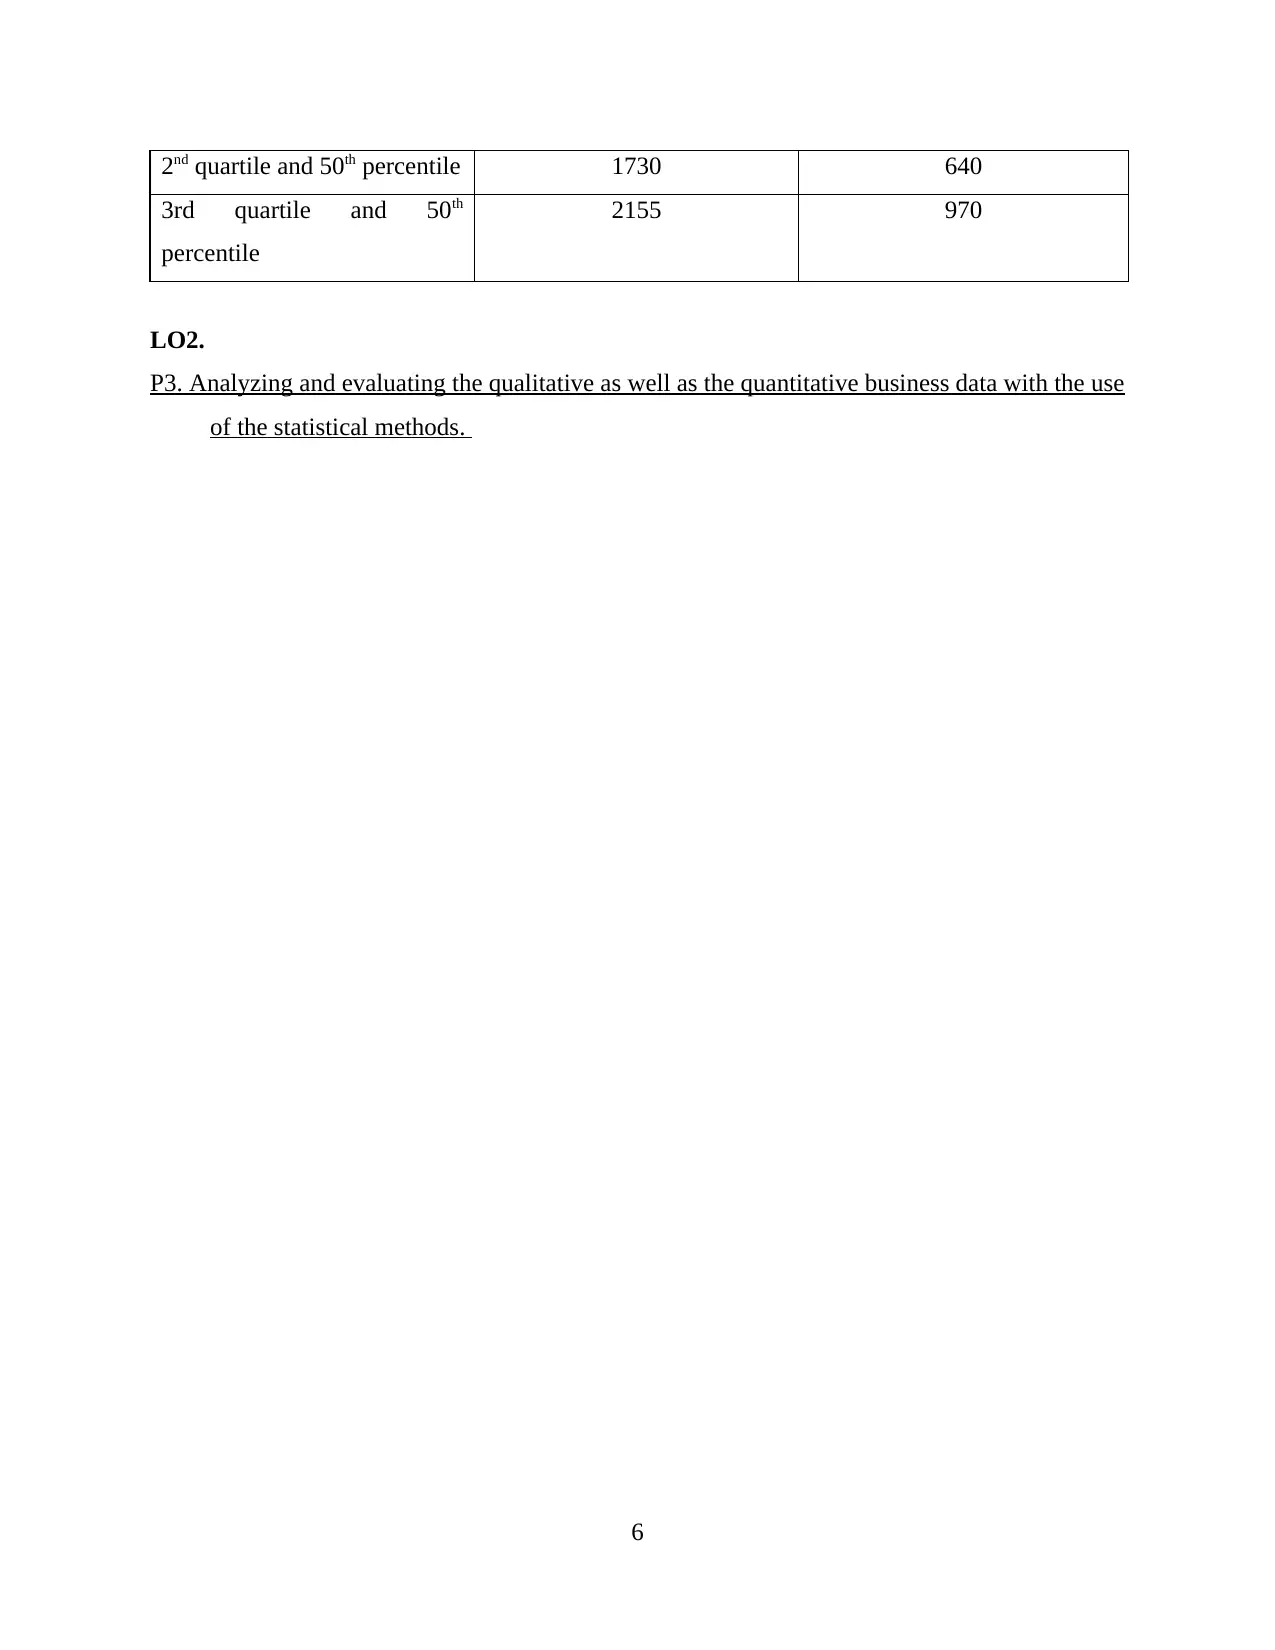
2nd quartile and 50th percentile 1730 640
3rd quartile and 50th
percentile
2155 970
LO2.
P3. Analyzing and evaluating the qualitative as well as the quantitative business data with the use
of the statistical methods.
6
3rd quartile and 50th
percentile
2155 970
LO2.
P3. Analyzing and evaluating the qualitative as well as the quantitative business data with the use
of the statistical methods.
6
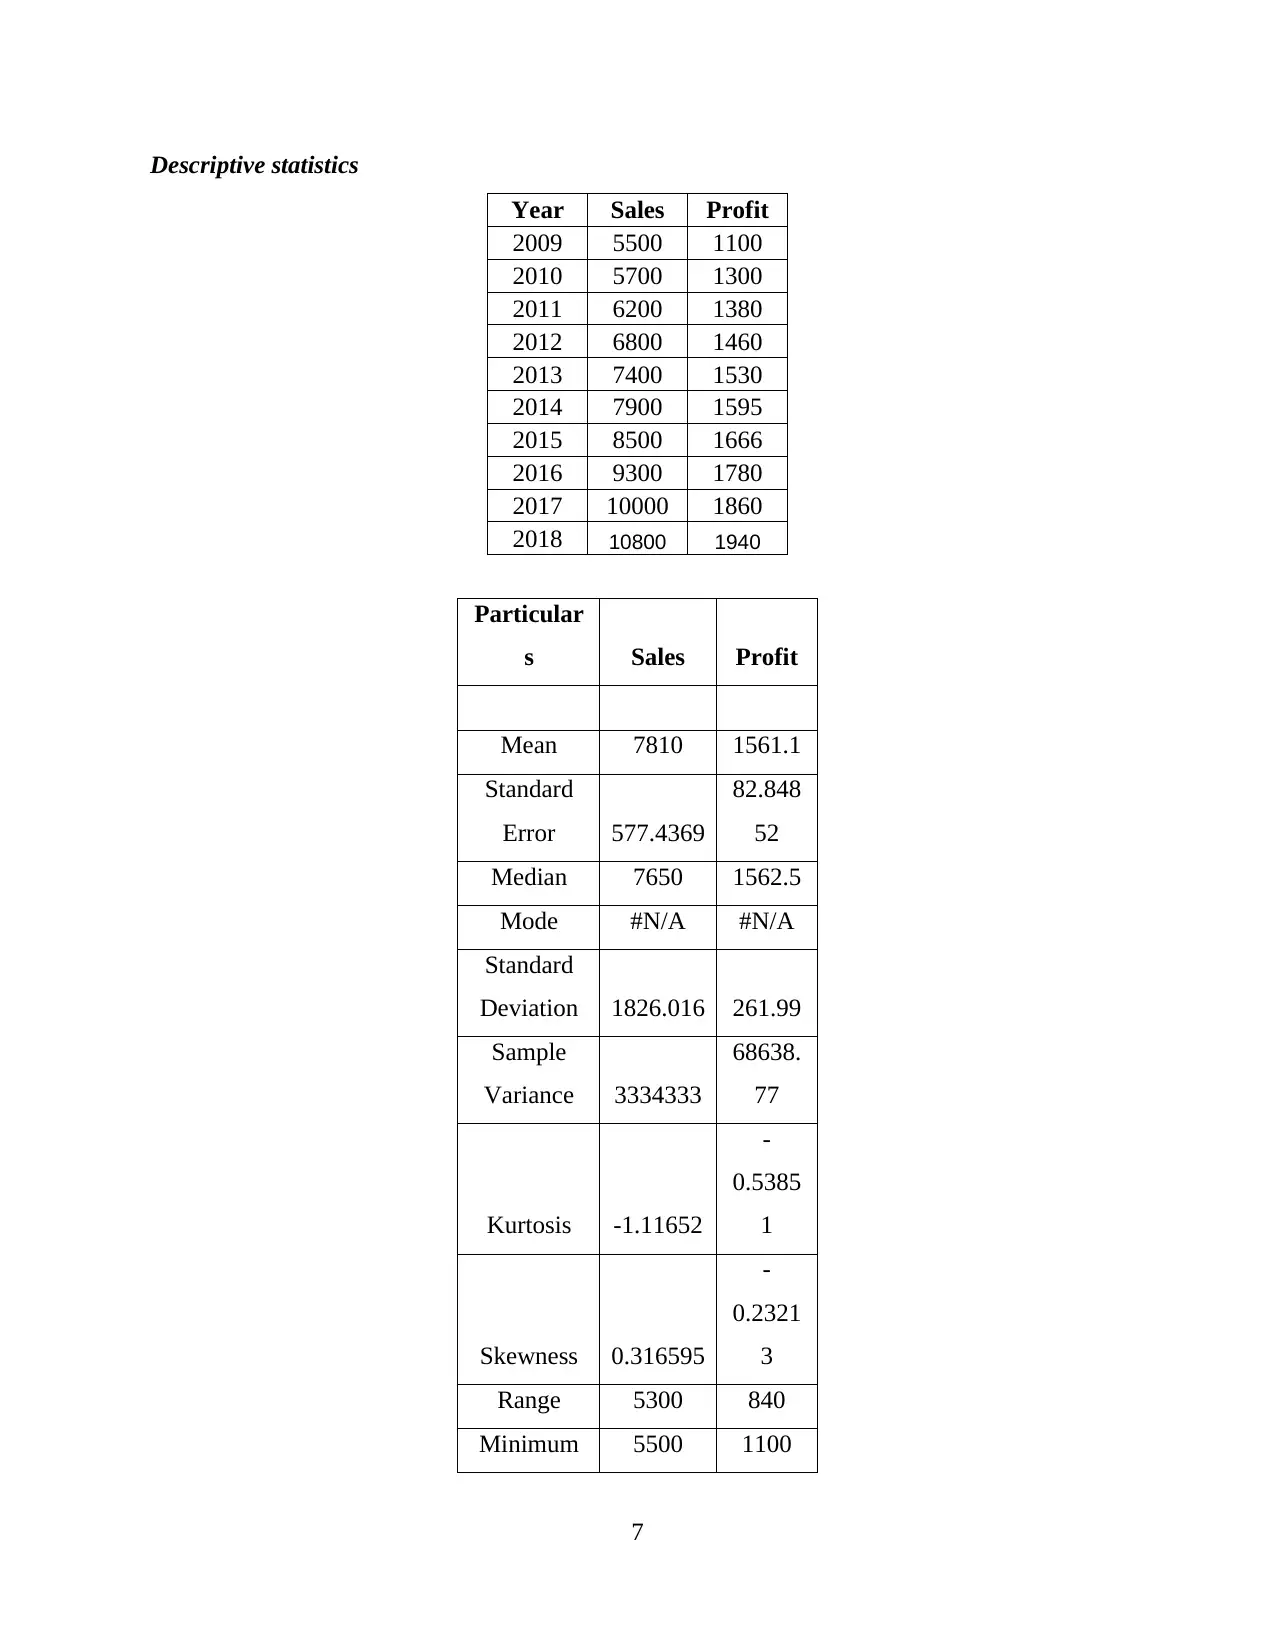
Descriptive statistics
Year Sales Profit
2009 5500 1100
2010 5700 1300
2011 6200 1380
2012 6800 1460
2013 7400 1530
2014 7900 1595
2015 8500 1666
2016 9300 1780
2017 10000 1860
2018 10800 1940
Particular
s Sales Profit
Mean 7810 1561.1
Standard
Error 577.4369
82.848
52
Median 7650 1562.5
Mode #N/A #N/A
Standard
Deviation 1826.016 261.99
Sample
Variance 3334333
68638.
77
Kurtosis -1.11652
-
0.5385
1
Skewness 0.316595
-
0.2321
3
Range 5300 840
Minimum 5500 1100
7
⊘ This is a preview!⊘
Do you want full access?
Subscribe today to unlock all pages.
Trusted by 1+ million students worldwide
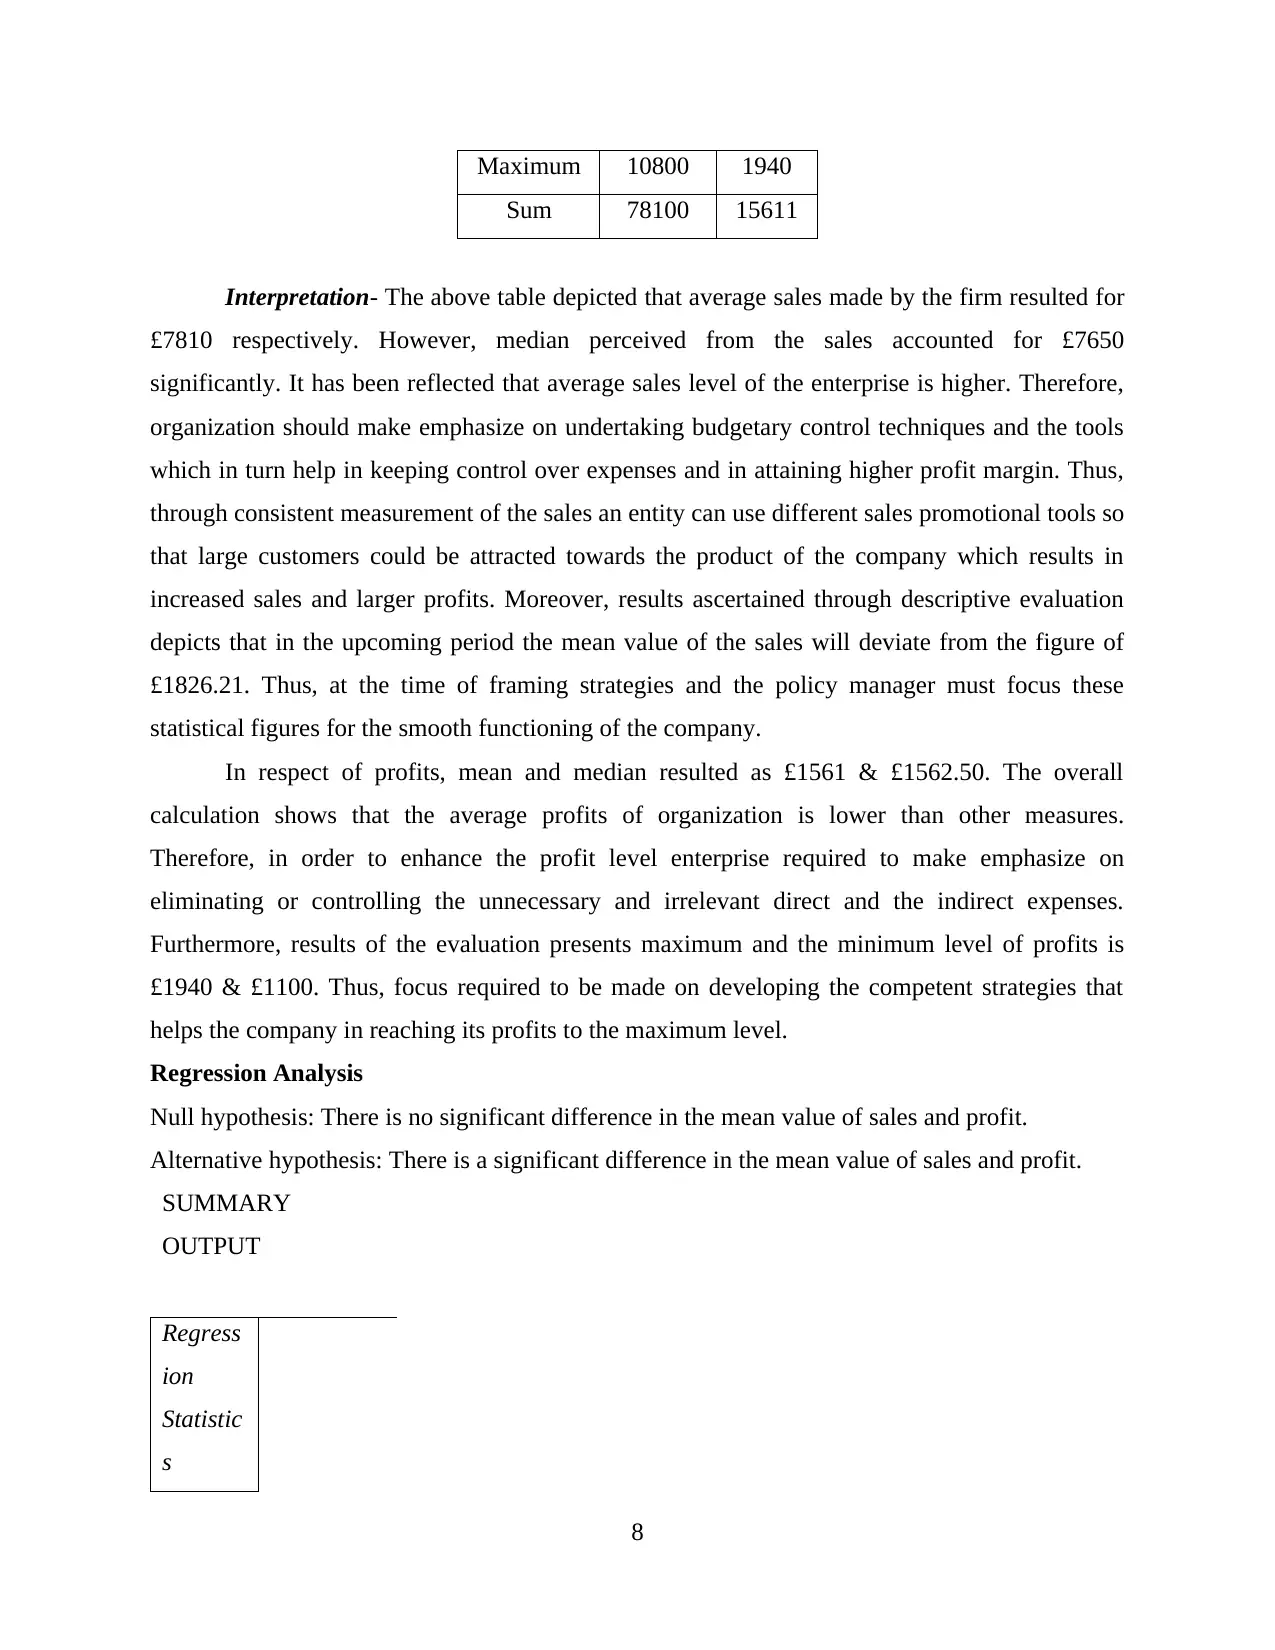
Maximum 10800 1940
Sum 78100 15611
Interpretation- The above table depicted that average sales made by the firm resulted for
£7810 respectively. However, median perceived from the sales accounted for £7650
significantly. It has been reflected that average sales level of the enterprise is higher. Therefore,
organization should make emphasize on undertaking budgetary control techniques and the tools
which in turn help in keeping control over expenses and in attaining higher profit margin. Thus,
through consistent measurement of the sales an entity can use different sales promotional tools so
that large customers could be attracted towards the product of the company which results in
increased sales and larger profits. Moreover, results ascertained through descriptive evaluation
depicts that in the upcoming period the mean value of the sales will deviate from the figure of
£1826.21. Thus, at the time of framing strategies and the policy manager must focus these
statistical figures for the smooth functioning of the company.
In respect of profits, mean and median resulted as £1561 & £1562.50. The overall
calculation shows that the average profits of organization is lower than other measures.
Therefore, in order to enhance the profit level enterprise required to make emphasize on
eliminating or controlling the unnecessary and irrelevant direct and the indirect expenses.
Furthermore, results of the evaluation presents maximum and the minimum level of profits is
£1940 & £1100. Thus, focus required to be made on developing the competent strategies that
helps the company in reaching its profits to the maximum level.
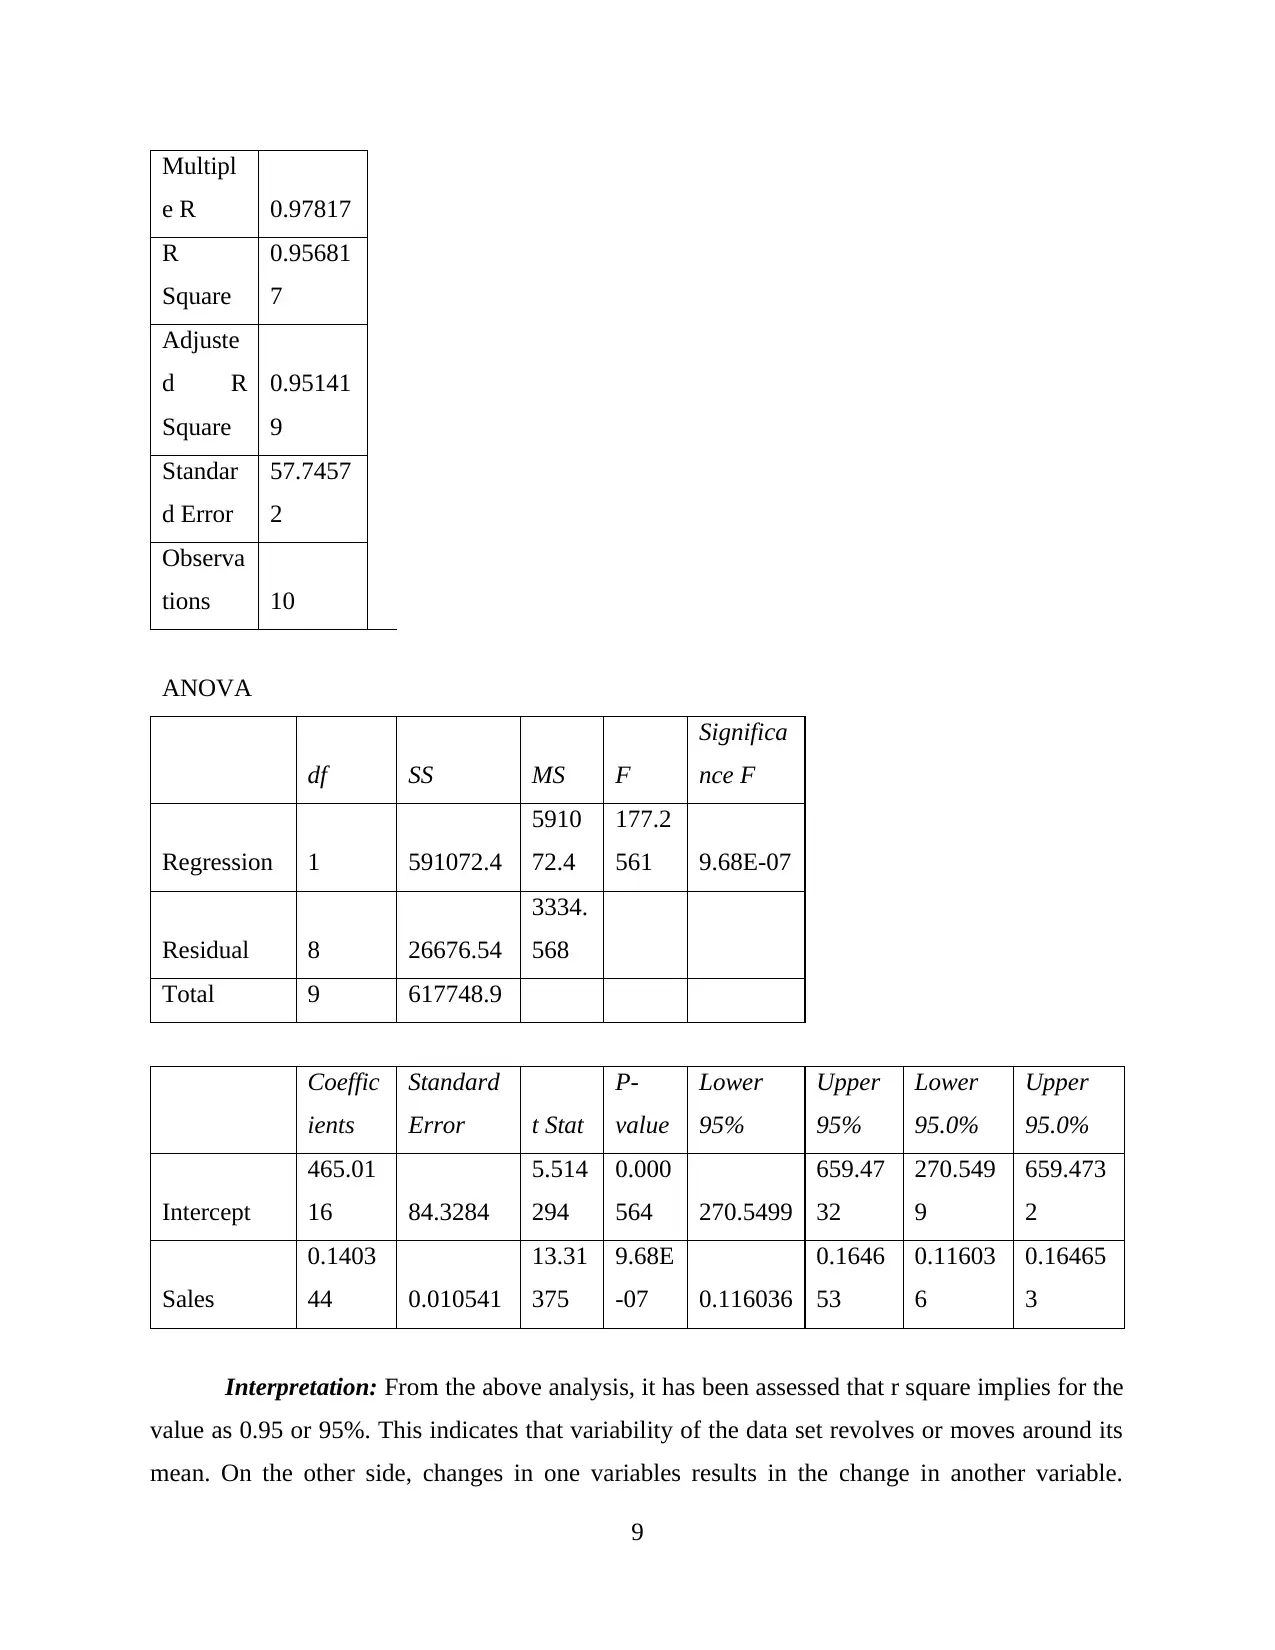
Regression Analysis
Null hypothesis: There is no significant difference in the mean value of sales and profit.
Alternative hypothesis: There is a significant difference in the mean value of sales and profit.
SUMMARY
OUTPUT
Regress
ion
Statistic
s
8
Sum 78100 15611
Interpretation- The above table depicted that average sales made by the firm resulted for
£7810 respectively. However, median perceived from the sales accounted for £7650
significantly. It has been reflected that average sales level of the enterprise is higher. Therefore,
organization should make emphasize on undertaking budgetary control techniques and the tools
which in turn help in keeping control over expenses and in attaining higher profit margin. Thus,
through consistent measurement of the sales an entity can use different sales promotional tools so
that large customers could be attracted towards the product of the company which results in
increased sales and larger profits. Moreover, results ascertained through descriptive evaluation
depicts that in the upcoming period the mean value of the sales will deviate from the figure of
£1826.21. Thus, at the time of framing strategies and the policy manager must focus these
statistical figures for the smooth functioning of the company.
In respect of profits, mean and median resulted as £1561 & £1562.50. The overall
calculation shows that the average profits of organization is lower than other measures.
Therefore, in order to enhance the profit level enterprise required to make emphasize on
eliminating or controlling the unnecessary and irrelevant direct and the indirect expenses.
Furthermore, results of the evaluation presents maximum and the minimum level of profits is
£1940 & £1100. Thus, focus required to be made on developing the competent strategies that
helps the company in reaching its profits to the maximum level.
Regression Analysis
Null hypothesis: There is no significant difference in the mean value of sales and profit.
Alternative hypothesis: There is a significant difference in the mean value of sales and profit.
SUMMARY
OUTPUT
Regress
ion
Statistic
s
8
Paraphrase This Document
Need a fresh take? Get an instant paraphrase of this document with our AI Paraphraser
Multipl
e R 0.97817
R
Square
0.95681
7
Adjuste
d R
Square
0.95141
9
Standar
d Error
57.7457
2
Observa
tions 10
ANOVA
df SS MS F
Significa
nce F
Regression 1 591072.4
5910
72.4
177.2
561 9.68E-07
Residual 8 26676.54
3334.
568
Total 9 617748.9
Coeffic
ients
Standard
Error t Stat
P-
value
Lower
95%
Upper
95%
Lower
95.0%
Upper
95.0%
Intercept
465.01
16 84.3284
5.514
294
0.000
564 270.5499
659.47
32
270.549
9
659.473
2
Sales
0.1403
44 0.010541
13.31
375
9.68E
-07 0.116036
0.1646
53
0.11603
6
0.16465
3
Interpretation: From the above analysis, it has been assessed that r square implies for the
value as 0.95 or 95%. This indicates that variability of the data set revolves or moves around its
mean. On the other side, changes in one variables results in the change in another variable.
9
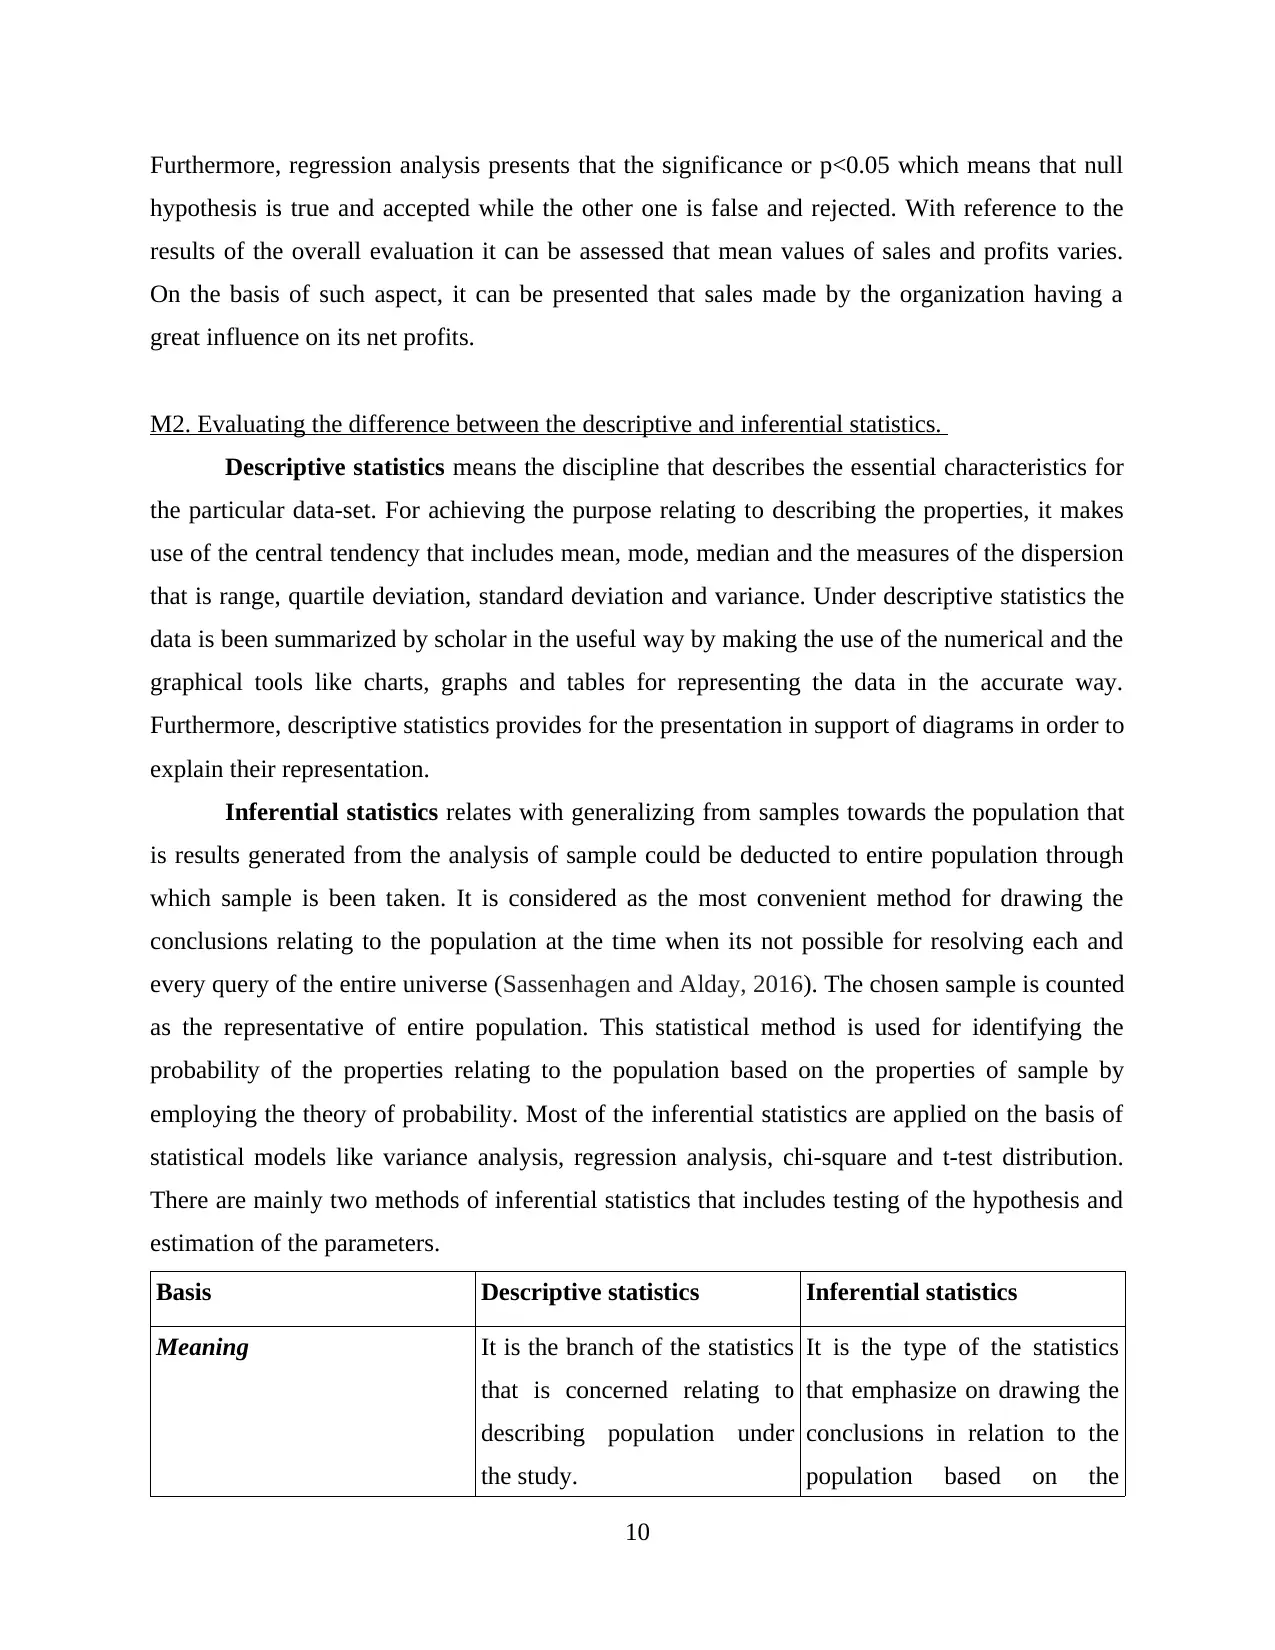
Furthermore, regression analysis presents that the significance or p<0.05 which means that null
hypothesis is true and accepted while the other one is false and rejected. With reference to the
results of the overall evaluation it can be assessed that mean values of sales and profits varies.
On the basis of such aspect, it can be presented that sales made by the organization having a
great influence on its net profits.
M2. Evaluating the difference between the descriptive and inferential statistics.
Descriptive statistics means the discipline that describes the essential characteristics for
the particular data-set. For achieving the purpose relating to describing the properties, it makes
use of the central tendency that includes mean, mode, median and the measures of the dispersion
that is range, quartile deviation, standard deviation and variance. Under descriptive statistics the
data is been summarized by scholar in the useful way by making the use of the numerical and the
graphical tools like charts, graphs and tables for representing the data in the accurate way.
Furthermore, descriptive statistics provides for the presentation in support of diagrams in order to
explain their representation.
Inferential statistics relates with generalizing from samples towards the population that
is results generated from the analysis of sample could be deducted to entire population through
which sample is been taken. It is considered as the most convenient method for drawing the
conclusions relating to the population at the time when its not possible for resolving each and
every query of the entire universe (Sassenhagen and Alday, 2016). The chosen sample is counted
as the representative of entire population. This statistical method is used for identifying the
probability of the properties relating to the population based on the properties of sample by
employing the theory of probability. Most of the inferential statistics are applied on the basis of
statistical models like variance analysis, regression analysis, chi-square and t-test distribution.
There are mainly two methods of inferential statistics that includes testing of the hypothesis and
estimation of the parameters.
Basis Descriptive statistics Inferential statistics
Meaning It is the branch of the statistics
that is concerned relating to
describing population under
the study.
It is the type of the statistics
that emphasize on drawing the
conclusions in relation to the
population based on the
10
⊘ This is a preview!⊘
Do you want full access?
Subscribe today to unlock all pages.
Trusted by 1+ million students worldwide
1 out of 19
Related Documents


Your All-in-One AI-Powered Toolkit for Academic Success.
+13062052269
info@desklib.com
Available 24*7 on WhatsApp / Email
![[object Object]](/_next/static/media/star-bottom.7253800d.svg)
Unlock your academic potential
Copyright © 2020–2026 A2Z Services. All Rights Reserved. Developed and managed by ZUCOL.