Statistics for Management: In-depth Analysis of Samsung's Business
VerifiedAdded on  2023/01/19
|26
|2700
|40
Report
AI Summary
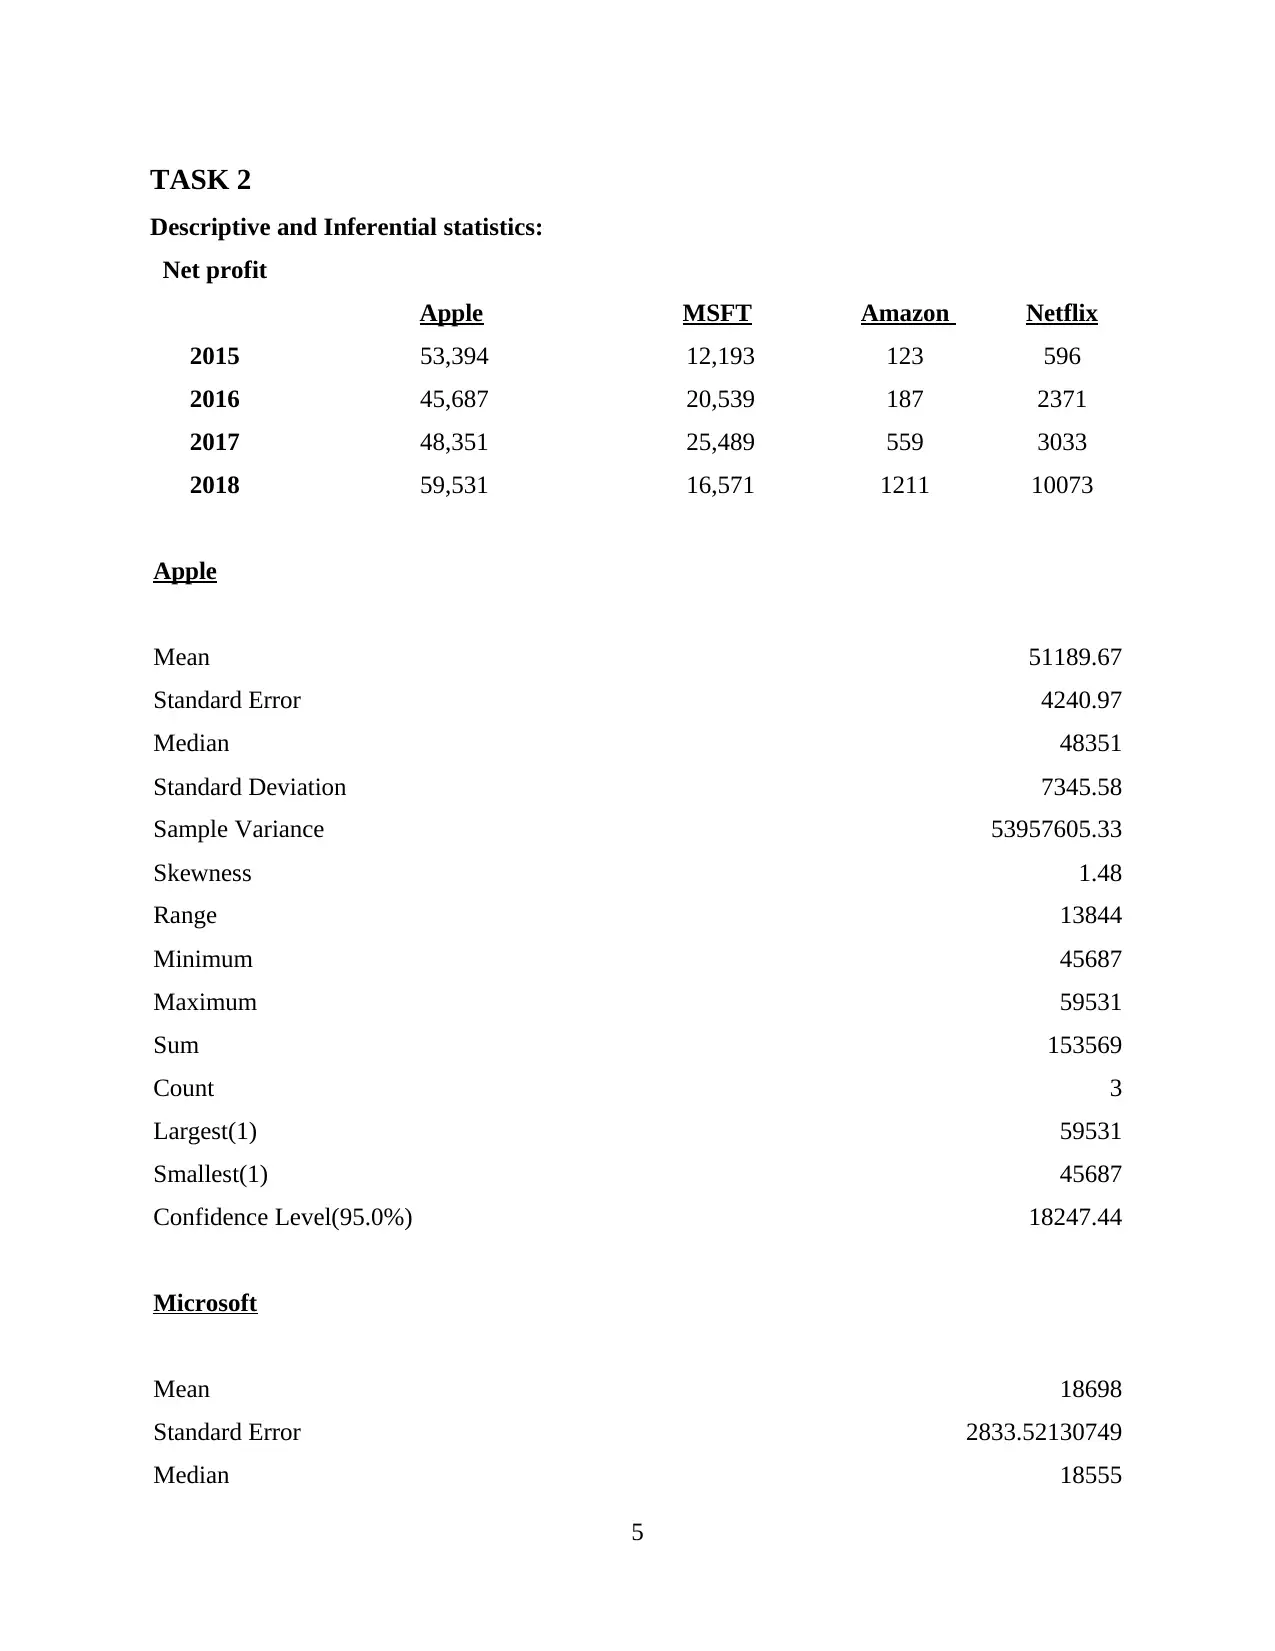
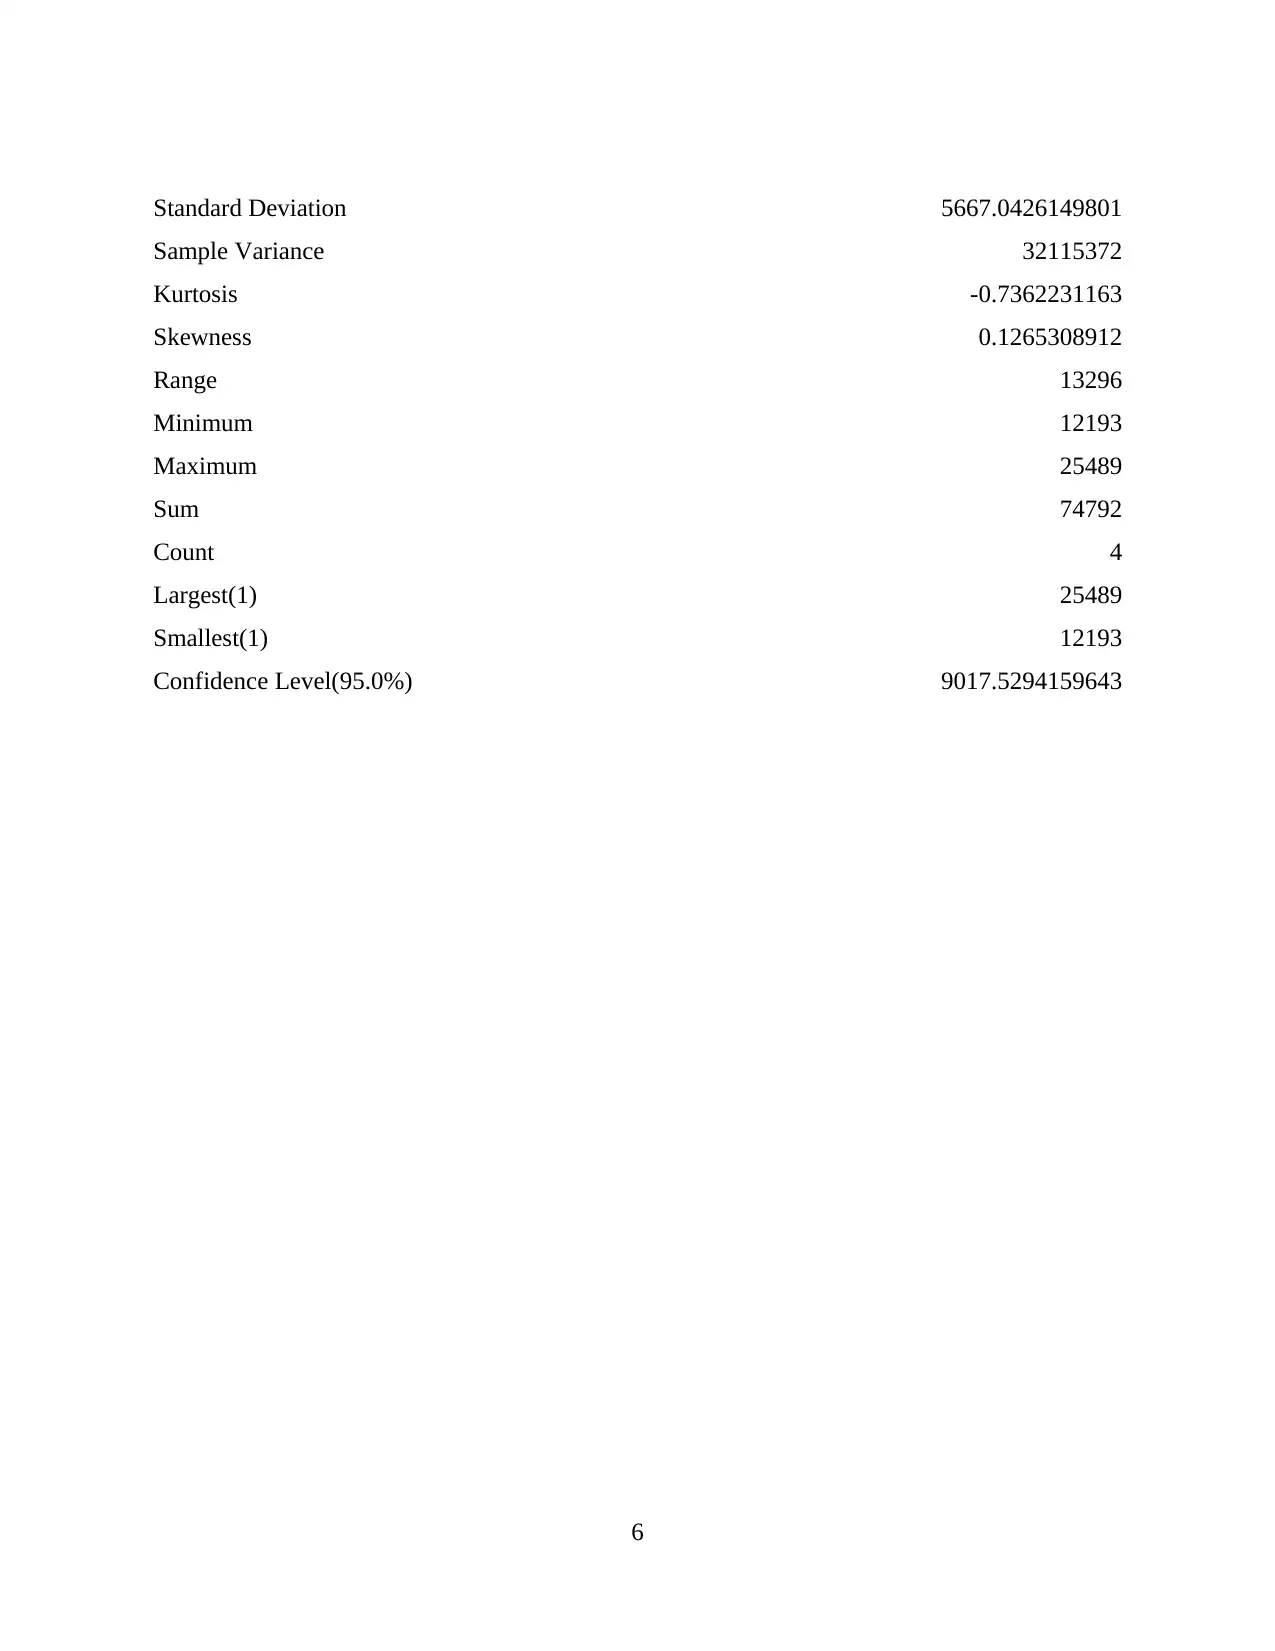
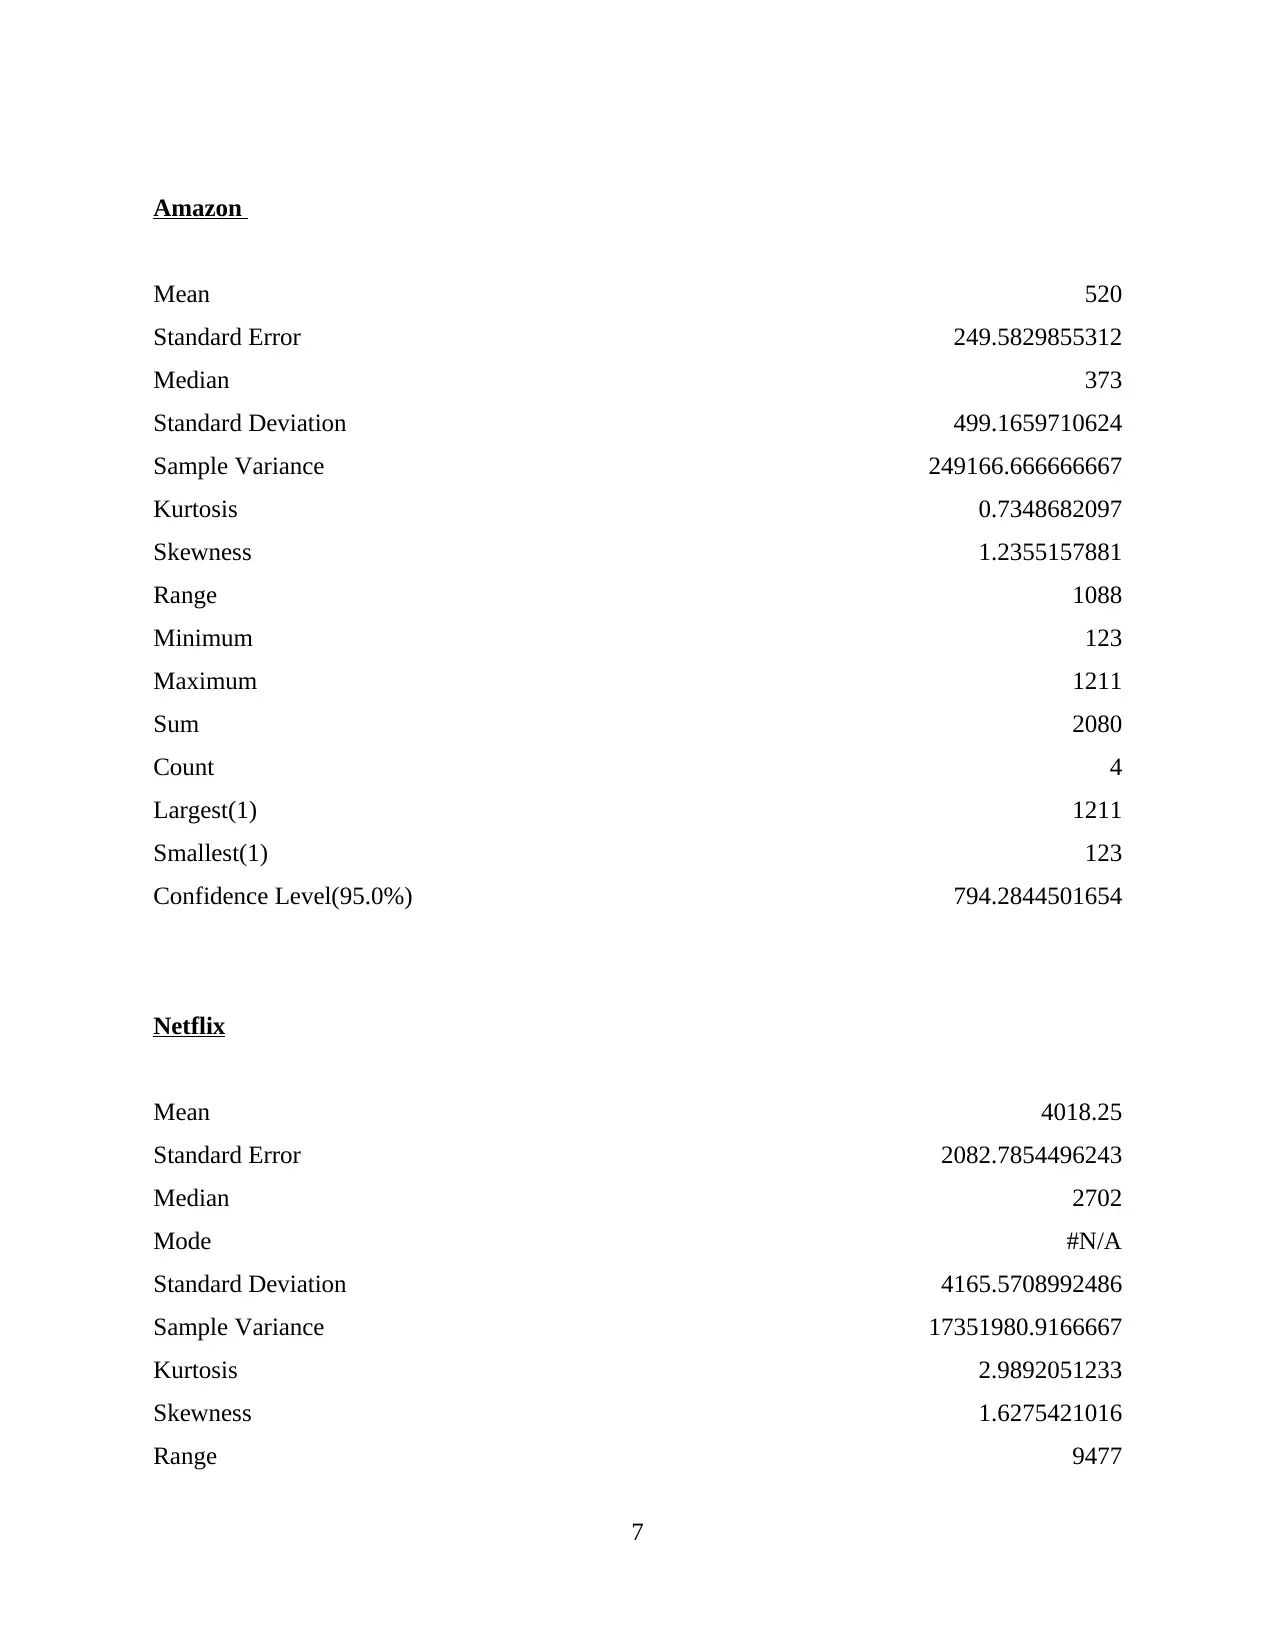
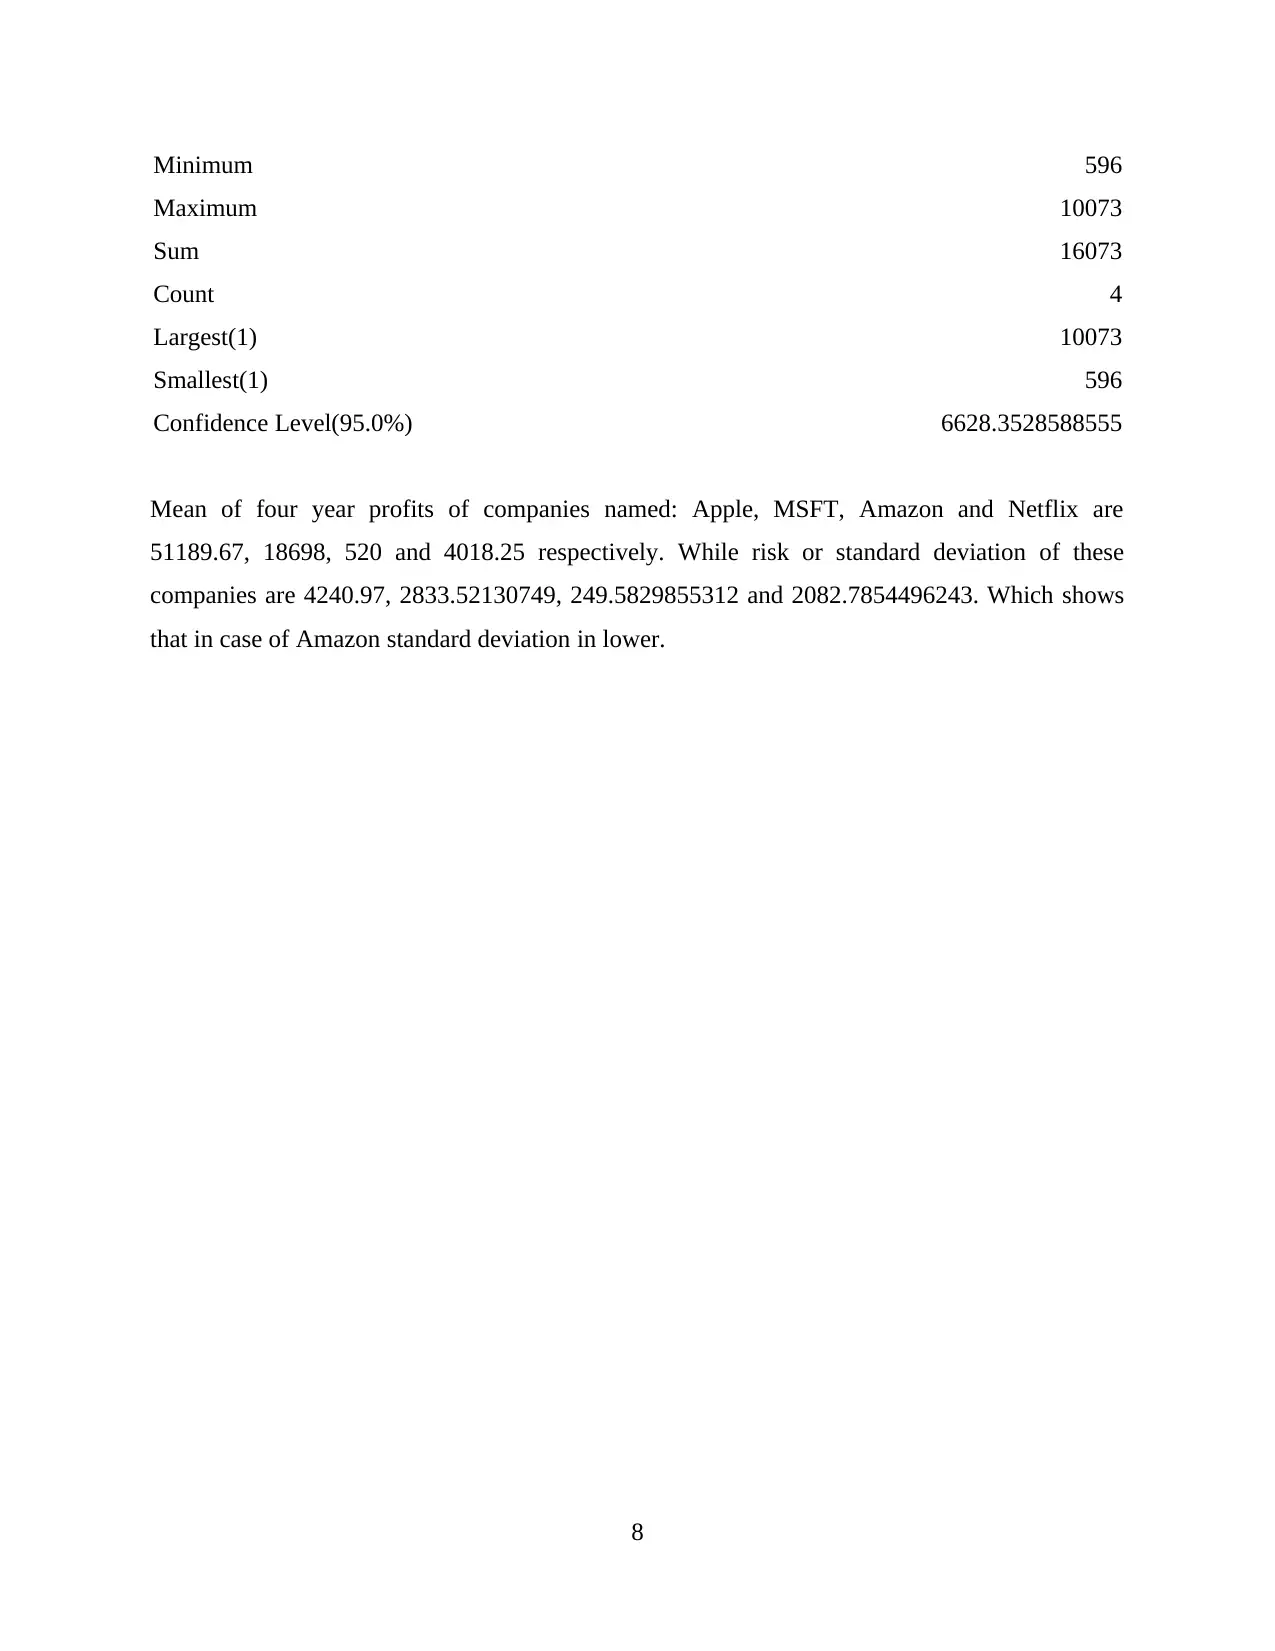
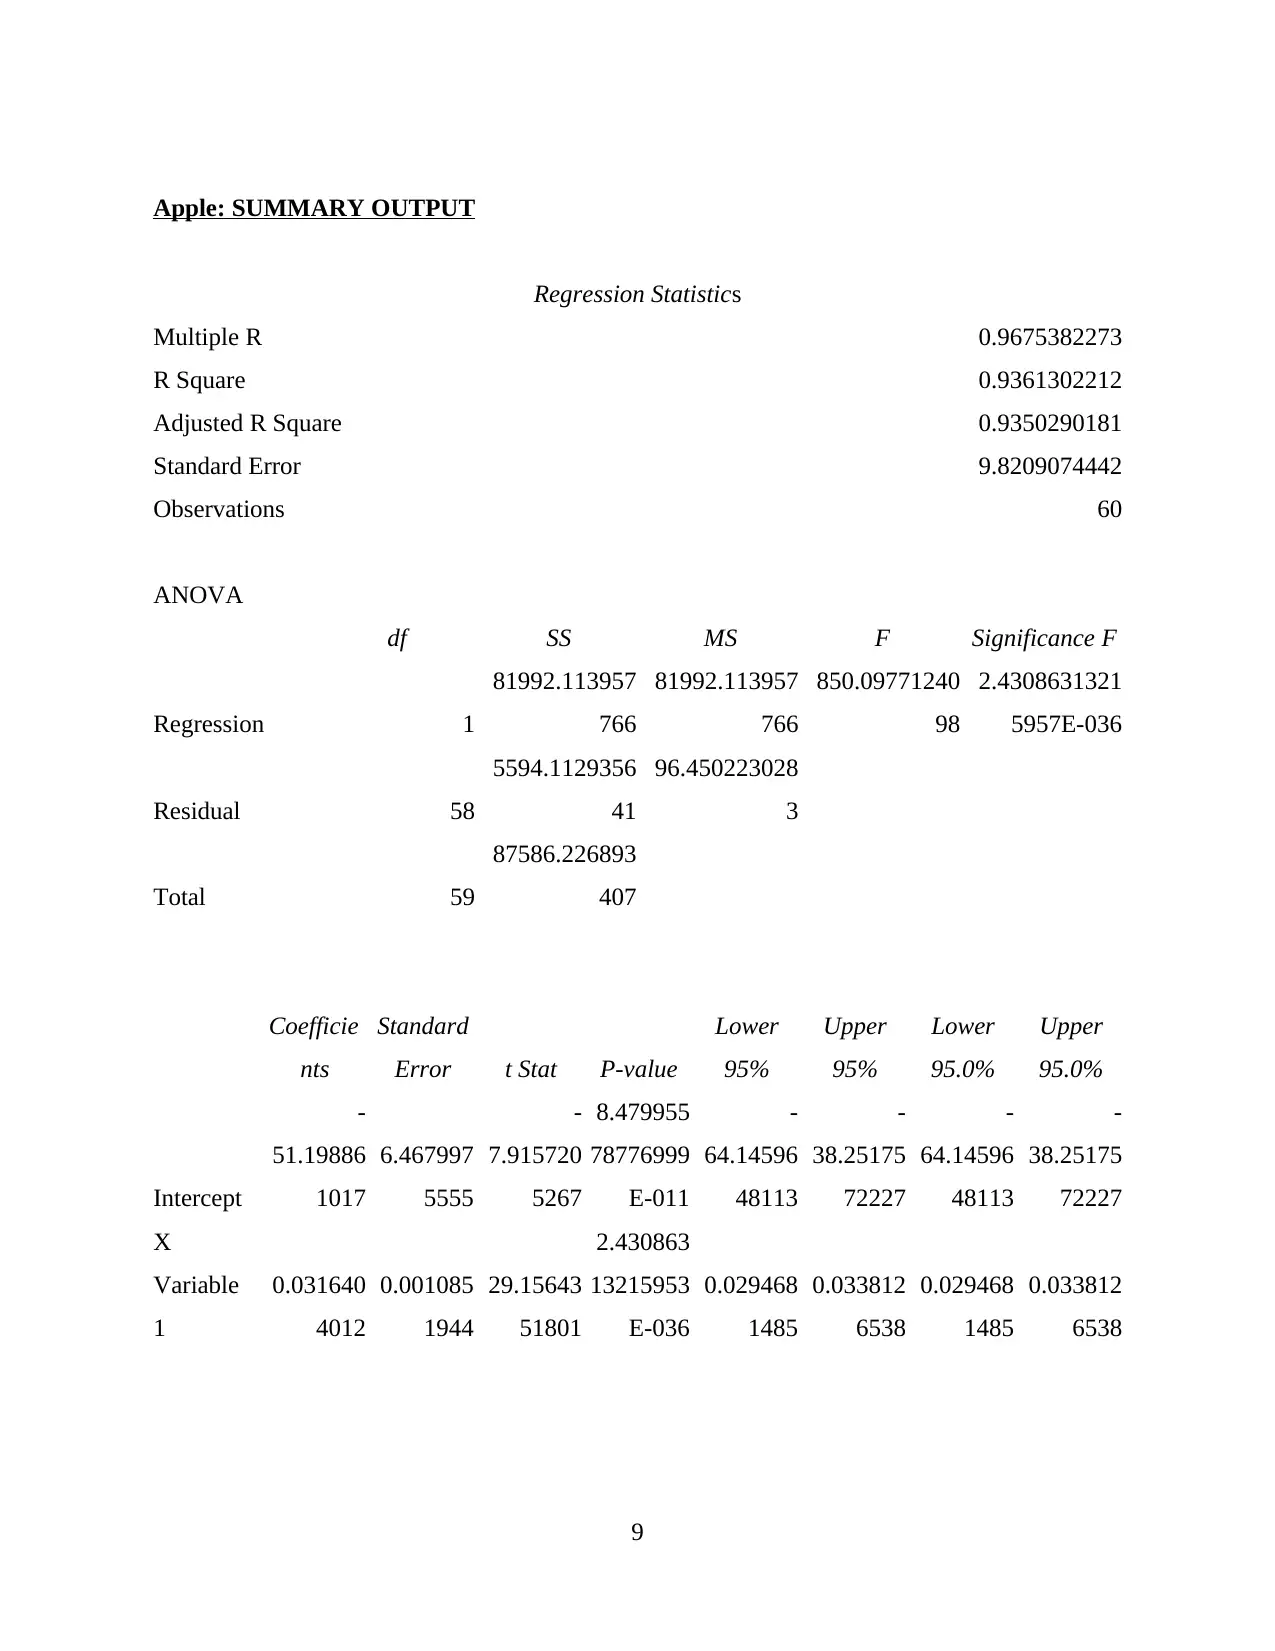
This report delves into the application of statistics in management, using Samsung as a focal point. It begins with an introduction to statistics, its characteristics, and various methods, followed by a discussion on data sources and types that businesses like Samsung can leverage for competitive advantages. The report differentiates between a sample and a population, highlighting the value of statistical methods in meeting business objectives. It also explores the distinctions between descriptive and inferential statistics, emphasizing their implications for business intelligence. The analysis includes detailed statistical outputs, such as regression statistics, for Apple, Microsoft, Amazon and Netflix, providing insights into their financial performances. The report concludes with a comprehensive overview of statistical tools and techniques relevant to strategic decision-making in a business context, offering valuable insights for understanding and improving business performance.

Statistics for Management
Paraphrase This Document
Need a fresh take? Get an instant paraphrase of this document with our AI Paraphraser

Table of Contents
INTRODUCTION...........................................................................................................................1
MAIN BODY...................................................................................................................................1
TASK 1............................................................................................................................................1
1. Introduction to statistics, with key characteristics and overview of methods....................1
2. Sources and types of data or information, that business can access to achieve competitive
advantages..............................................................................................................................3
3. Difference between a sample and a population..................................................................4
4. Value of statistical methods that Samsung can employ to meets its business objectives. .4
5. Difference between descriptive and inferential statistics, with implications for business
intelligence.............................................................................................................................4
TASK 2............................................................................................................................................5
CONCLUSION..............................................................................................................................18
REFERENCES..............................................................................................................................19
.......................................................................................................................................................19

INTRODUCTION
Statistics refers to a mathematical science, that pertains to collect, organise, analyse and
interpret a data. It provides a number of tools to predict and forecast a data to organisation, that
helps in taking important decisions regarding with finance, marketing and other services. The
present report is going to collect an in-depth knowledge of statistical management, including its
usage in resolving the business challenges. Samsung is chosen for this analysis, that deals in
electronic products, as designer, manufacturer and distributor in UK. It includes different sources
and types of data, that business can access like past and current performance of competitors, for
developing better strategies to enhance own performance. For this purpose, value of employing
statistical methods are also discussed in present report, to meet business objectives of respective
firm. Furthermore, key difference between inferential and descriptive statistics, with implications
for business objectives are highlighted.
MAIN BODY
TASK 1
1. Introduction to statistics, with key characteristics and overview of methods
Statistics can be defined as a tool to collect, analyse and interpret the large numerical
data, by using a number of methodologies. It includes index, correlation and regression, trend
forecasting and more, which are majorly classified into two forms of statistics as inferential and
descriptive. According to Prof. Bowley, statistics can be defined as a branch of mathematics that
mainly deal with counting and interpreting a numerical information.
Key characteristics of statistics:ï‚· Statistics are aggregate of facts: Information that is collected by statistical methods never
includes the single or isolated figures, because such data cannot be compared, to drawn
specific conclusion. Therefore, statistical data is aggregate of facts, that are capable to
offer meaningful information.ï‚· Data must be expressed in numerical form: As statistical methods can only be applied on
information which is numerically expressed. Therefore, qualitative data like intelligence,
beauty and judgemental information that cannot be expressed in numerical form, then
statistical methods cannot be employed on the same.
1
⊘ This is a preview!⊘
Do you want full access?
Subscribe today to unlock all pages.

Trusted by 1+ million students worldwide

ï‚· Statistical information must be collected in systematic manner: To take business
decisions or draw a valid conclusion, data must be gathered systematically, by following
a suitable plan.ï‚· Information must gather with definite purpose: Before collecting any business
information, it is essential for a company to determine specific and well-defined purpose,
so that relevant statistical information can be collected.
ï‚· Standard of accuracy should be maintained while collecting statistical information:
Statistics deals mainly with large number of information, therefore, accuracy of same
depends highly upon nature of enquiry, which may mislead the result, if not taken
appropriately.
Overview of statistical methods:
According to John Dillard, in information age, to analyse a data and conclude relevant
result, it is essential to take right statistical tools. It includes -
ï‚· Mean: This methods helps in determining the average value of large information, to
identify the overall trend of a data set. But employing this method on data having skewed
distribution, may provide inaccurate information, that highly affects the decision taken
for achievement of business objectives.
ï‚· Standard deviations: It is mainly applied on data which is highly spread for mean, that
helps in determining the dispersion of data points, in quick manner. But if data with
strange patter like large amount of outliers or non-normal curve, than desired information
cannot be obtained by applying standard deviation method.
ï‚· Correlation and Regression: Both methods are used to determine the interdependence
or relationship between two data, through which trends over specific time can be
analysed.
ï‚· Sample size determination: When measuring a large population data like business
information regarding with revenues, customer base and more, it is difficult to obtain
accurate result. Therefore, it is essential to take a sample of data with right size, so that
accurate result can be obtained. But if sample fails to include defined variables then it
might creates errors also.
ï‚· Hypothesis testing: This method also known as t-testing that helps in testing if a certain
hypothesis is true for a data set, otherwise alternative hypothesis will accept.
2
Paraphrase This Document
Need a fresh take? Get an instant paraphrase of this document with our AI Paraphraser

2. Sources and types of data or information, that business can access to achieve competitive
advantages
In order to achieve competitive advantages, an organisation like Samsung which operates
its electronic business in various countries, can use a number of sources. It includes statistical
sources which is used to collect data for official purpose like census report and non-statistical
sources that employ for gathering administrative purpose of information.
Sources of gathering statistical information:ï‚· Survey: This method is also called sample survey which is used to estimated the
characteristics of a large population data. Using this method, gives advantage in to a
company in determining the current and previous trend more easily, but it can cause error
also. Samsung can use this source to collect feedback of customers and other stakeholders
about quality of products and services, so that further improvement can be made.ï‚· Census: It is based on each and every item of population to analyse data. Advantage of
using this method is getting accurate and more relevant information. But it includes high
cost and time, for analysing and interpreting the information.
ï‚· Government and Semi-government sources: These sources provide data about current and
past performance of business of an organisation, through which a purpose behind
collecting the data can easily achieved. To collect data about competitive position of own
business and other competitors that deal in same market, managers of Samsung can use
this non-statistical source.
Types of statistical data:ï‚· Primary data: It includes quantitative business raw data i.e. information without
fabrication which can be collected from primary sources only, such as questionnaire,
survey and more.
ï‚· Secondary data: It consists information which may undergone in a statistical treatment
and can be collected through government and semi—government organisation, journals
and other published sources.
3. Difference between a sample and a population
3

4. Value of statistical methods that Samsung can employ to meets its business objectives
5. Difference between descriptive and inferential statistics, with implications for business
intelligence
4
5. Difference between descriptive and inferential statistics, with implications for business
intelligence
4
⊘ This is a preview!⊘
Do you want full access?
Subscribe today to unlock all pages.

Trusted by 1+ million students worldwide

TASK 2
Descriptive and Inferential statistics:
Net profit
Apple MSFT Amazon Netflix
2015 53,394 12,193 123 596
2016 45,687 20,539 187 2371
2017 48,351 25,489 559 3033
2018 59,531 16,571 1211 10073
Apple
Mean 51189.67
Standard Error 4240.97
Median 48351
Standard Deviation 7345.58
Sample Variance 53957605.33
Skewness 1.48
Range 13844
Minimum 45687
Maximum 59531
Sum 153569
Count 3
Largest(1) 59531
Smallest(1) 45687
Confidence Level(95.0%) 18247.44
Microsoft
Mean 18698
Standard Error 2833.52130749
Median 18555
5
Paraphrase This Document
Need a fresh take? Get an instant paraphrase of this document with our AI Paraphraser

Standard Deviation 5667.0426149801
Sample Variance 32115372
Kurtosis -0.7362231163
Skewness 0.1265308912
Range 13296
Minimum 12193
Maximum 25489
Sum 74792
Count 4
Largest(1) 25489
Smallest(1) 12193
Confidence Level(95.0%) 9017.5294159643
6
Sample Variance 32115372
Kurtosis -0.7362231163
Skewness 0.1265308912
Range 13296
Minimum 12193
Maximum 25489
Sum 74792
Count 4
Largest(1) 25489
Smallest(1) 12193
Confidence Level(95.0%) 9017.5294159643
6

Amazon
Mean 520
Standard Error 249.5829855312
Median 373
Standard Deviation 499.1659710624
Sample Variance 249166.666666667
Kurtosis 0.7348682097
Skewness 1.2355157881
Range 1088
Minimum 123
Maximum 1211
Sum 2080
Count 4
Largest(1) 1211
Smallest(1) 123
Confidence Level(95.0%) 794.2844501654
Netflix
Mean 4018.25
Standard Error 2082.7854496243
Median 2702
Mode #N/A
Standard Deviation 4165.5708992486
Sample Variance 17351980.9166667
Kurtosis 2.9892051233
Skewness 1.6275421016
Range 9477
7
⊘ This is a preview!⊘
Do you want full access?
Subscribe today to unlock all pages.

Trusted by 1+ million students worldwide

Minimum 596
Maximum 10073
Sum 16073
Count 4
Largest(1) 10073
Smallest(1) 596
Confidence Level(95.0%) 6628.3528588555
Mean of four year profits of companies named: Apple, MSFT, Amazon and Netflix are
51189.67, 18698, 520 and 4018.25 respectively. While risk or standard deviation of these
companies are 4240.97, 2833.52130749, 249.5829855312 and 2082.7854496243. Which shows
that in case of Amazon standard deviation in lower.
8
Paraphrase This Document
Need a fresh take? Get an instant paraphrase of this document with our AI Paraphraser

Apple: SUMMARY OUTPUT
Regression Statistics
Multiple R 0.9675382273
R Square 0.9361302212
Adjusted R Square 0.9350290181
Standard Error 9.8209074442
Observations 60
ANOVA
df SS MS F Significance F
Regression 1
81992.113957
766
81992.113957
766
850.09771240
98
2.4308631321
5957E-036
Residual 58
5594.1129356
41
96.450223028
3
Total 59
87586.226893
407
Coefficie
nts
Standard
Error t Stat P-value
Lower
95%
Upper
95%
Lower
95.0%
Upper
95.0%
Intercept
-
51.19886
1017
6.467997
5555
-
7.915720
5267
8.479955
78776999
E-011
-
64.14596
48113
-
38.25175
72227
-
64.14596
48113
-
38.25175
72227
X
Variable
1
0.031640
4012
0.001085
1944
29.15643
51801
2.430863
13215953
E-036
0.029468
1485
0.033812
6538
0.029468
1485
0.033812
6538
9

10
4000 4500 5000 5500 6000 6500 7000 7500 8000 8500
-30
-20
-10
0
10
20
30
40
50
X Variable 1 Residual Plot
X Variable 1
Residuals
0 1000 2000 3000 4000 5000 6000 7000 8000 9000
0
50
100
150
200
250
X Variable 1 Line Fit Plot
Series1
Column B
X Variable 1
Y
0 20 40 60 80 100 120
0
100
200
300
Normal Probability Plot
Sample Percentile
Y
⊘ This is a preview!⊘
Do you want full access?
Subscribe today to unlock all pages.

Trusted by 1+ million students worldwide
1 out of 26
Related Documents
Your All-in-One AI-Powered Toolkit for Academic Success.
 +13062052269
info@desklib.com
Available 24*7 on WhatsApp / Email
Unlock your academic potential
Copyright © 2020–2025 A2Z Services. All Rights Reserved. Developed and managed by ZUCOL.


