Statistics for Managerial Decision Assignment Item II Analysis

Verified

Added on  2021/06/17

|25
|987
|17
Homework Assignment
AI Summary
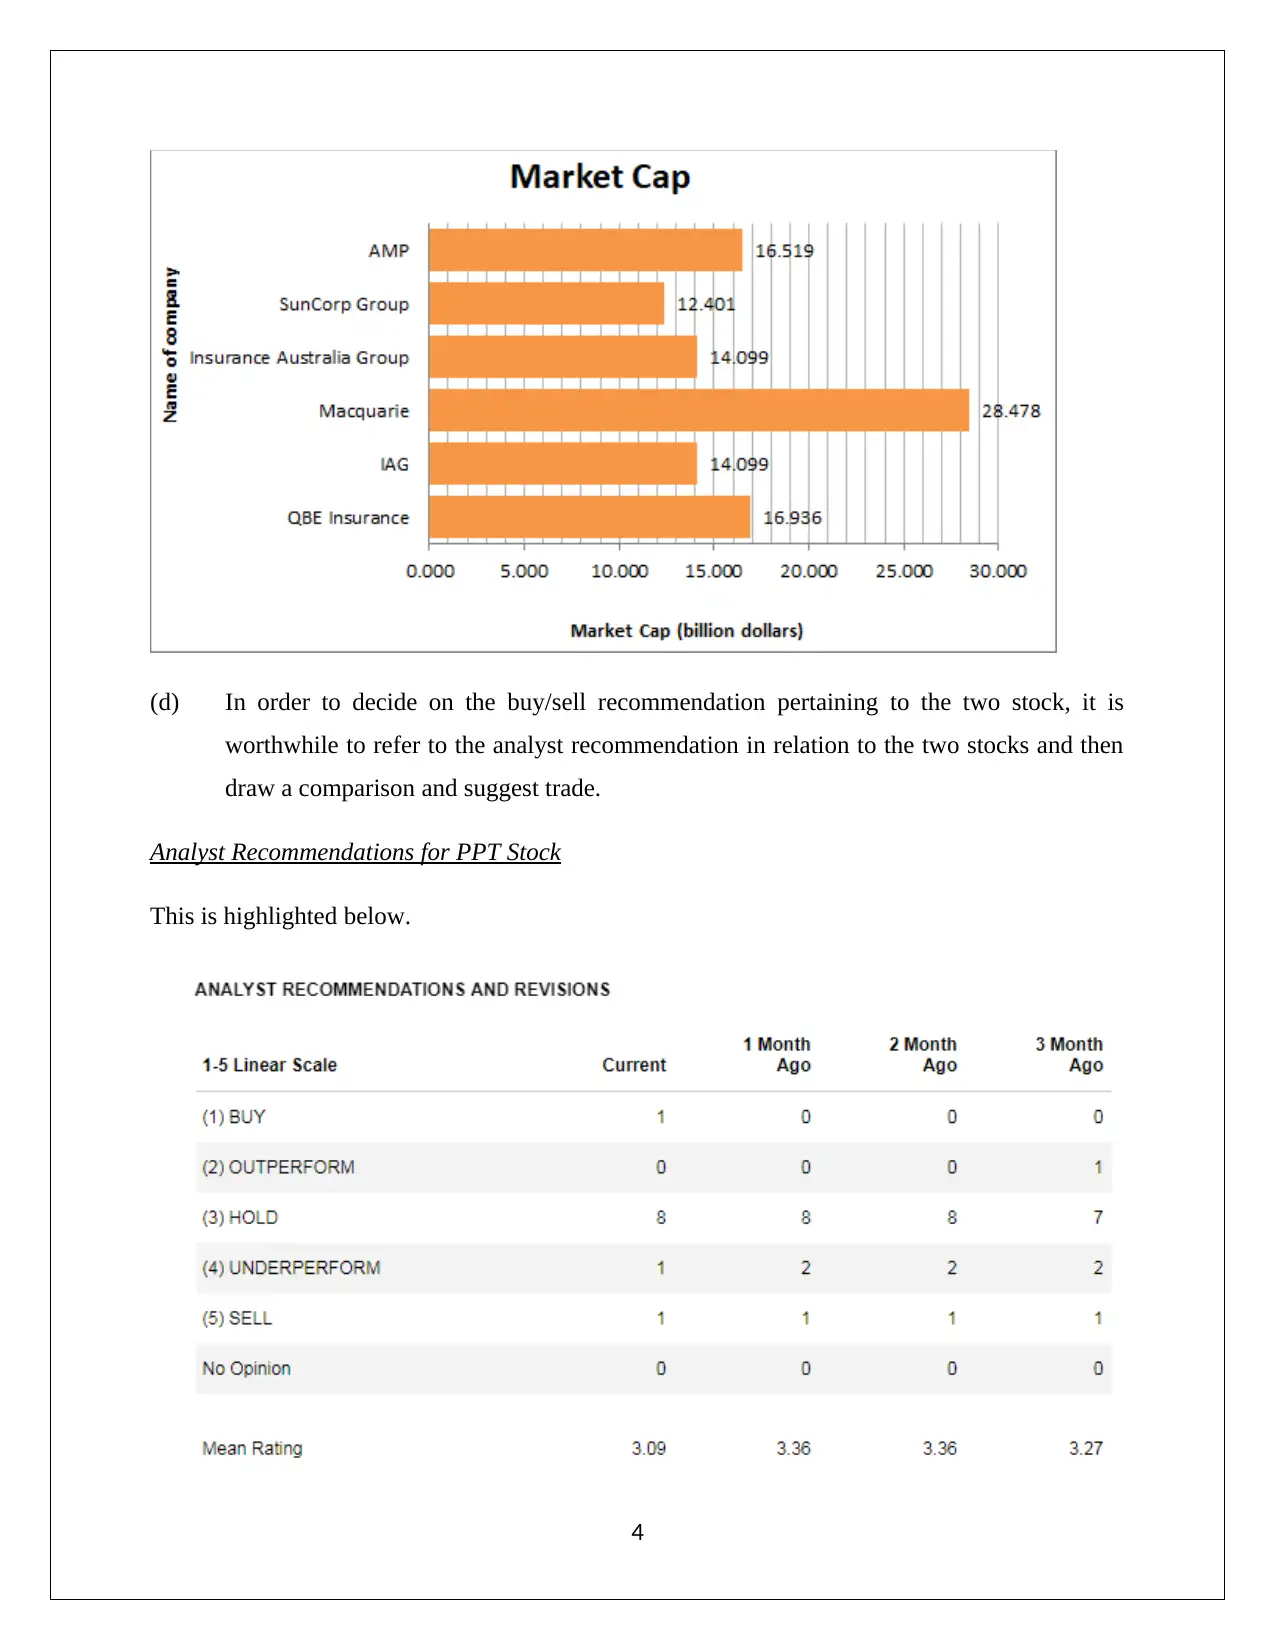
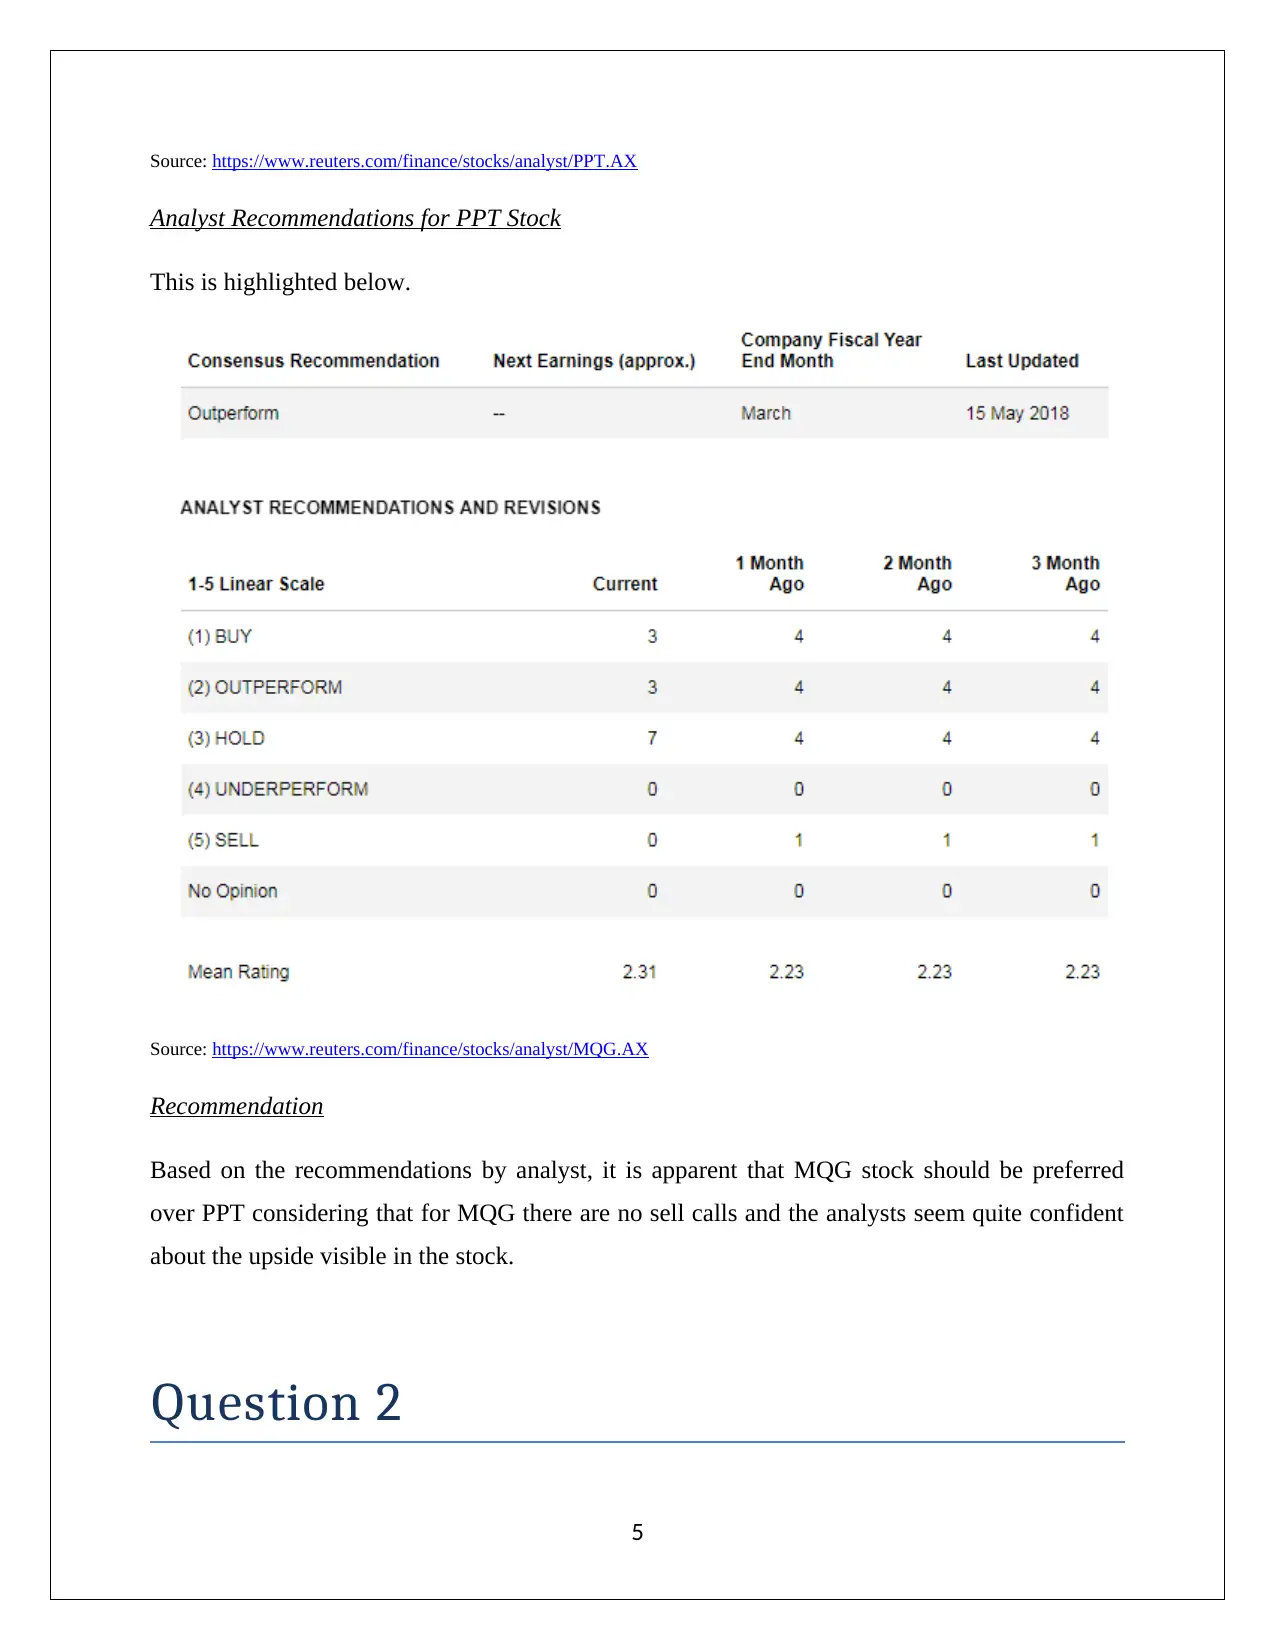
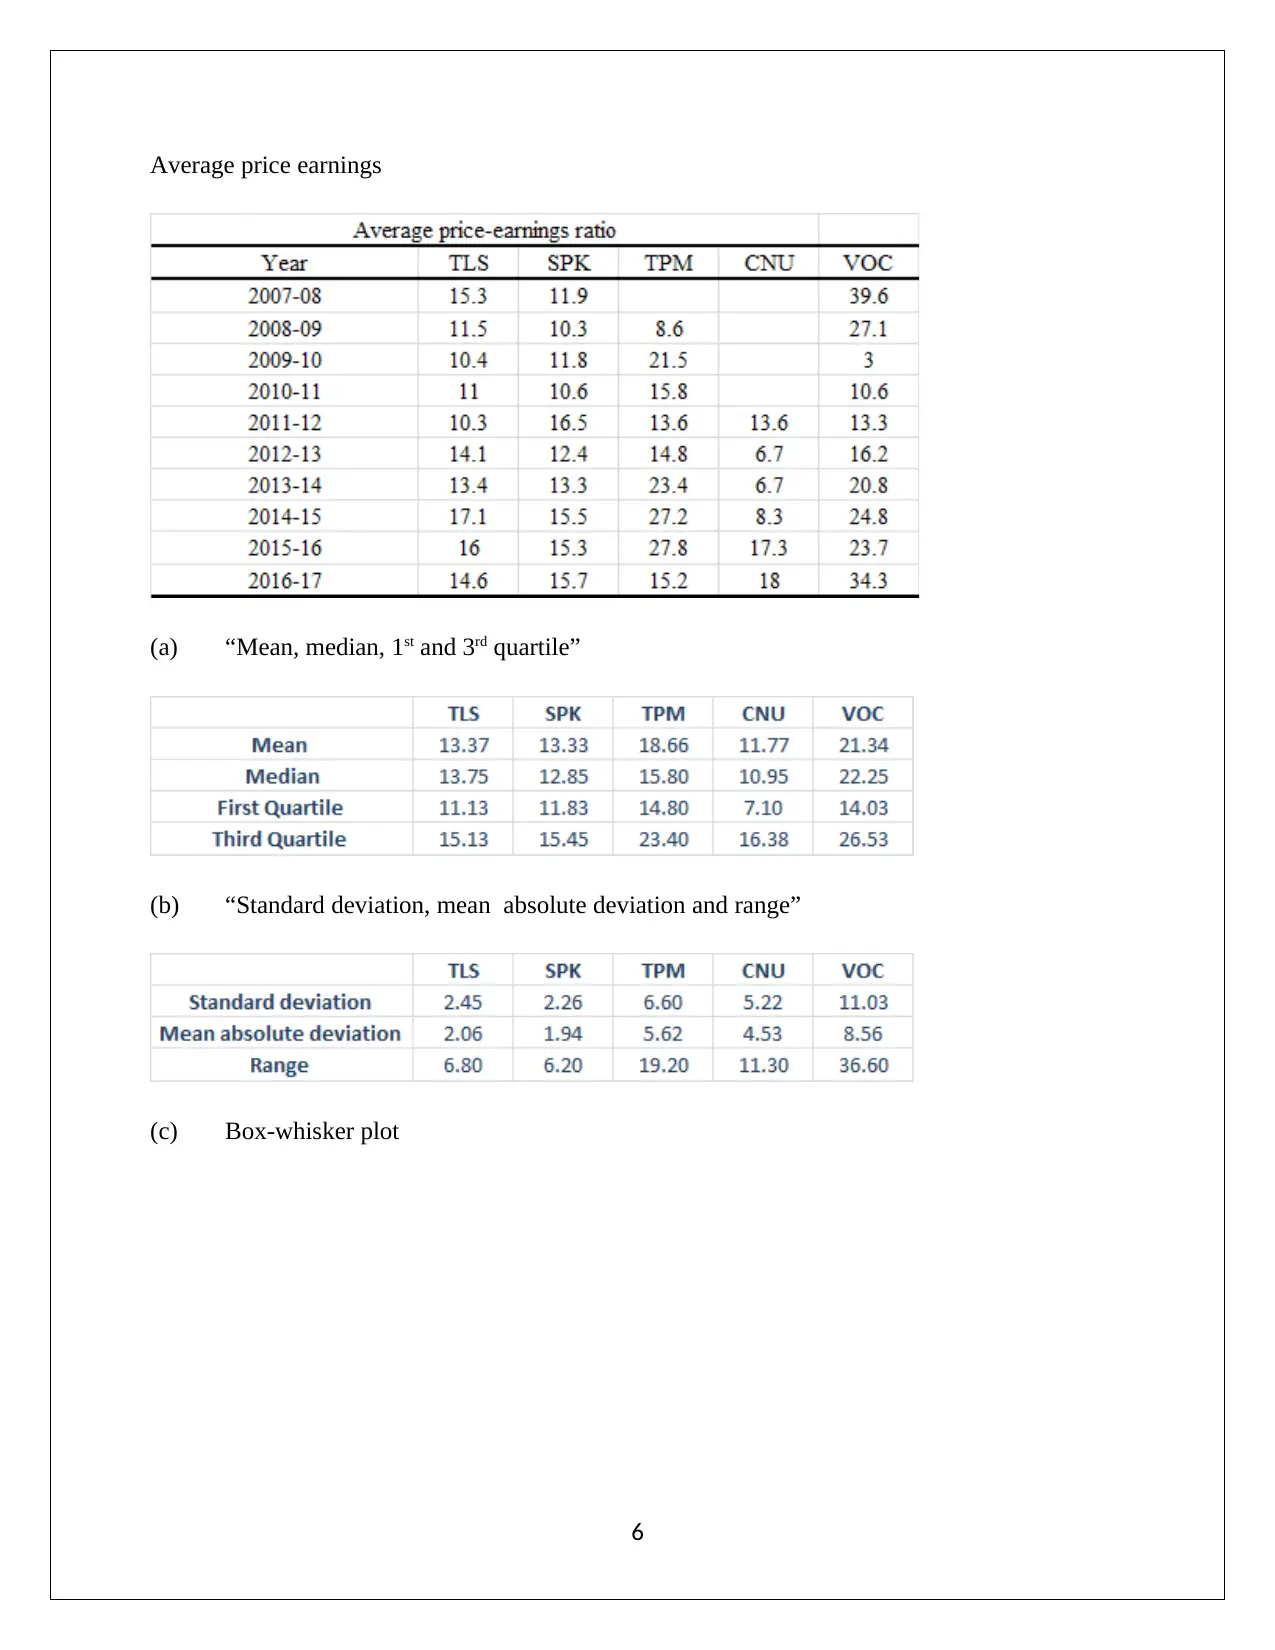
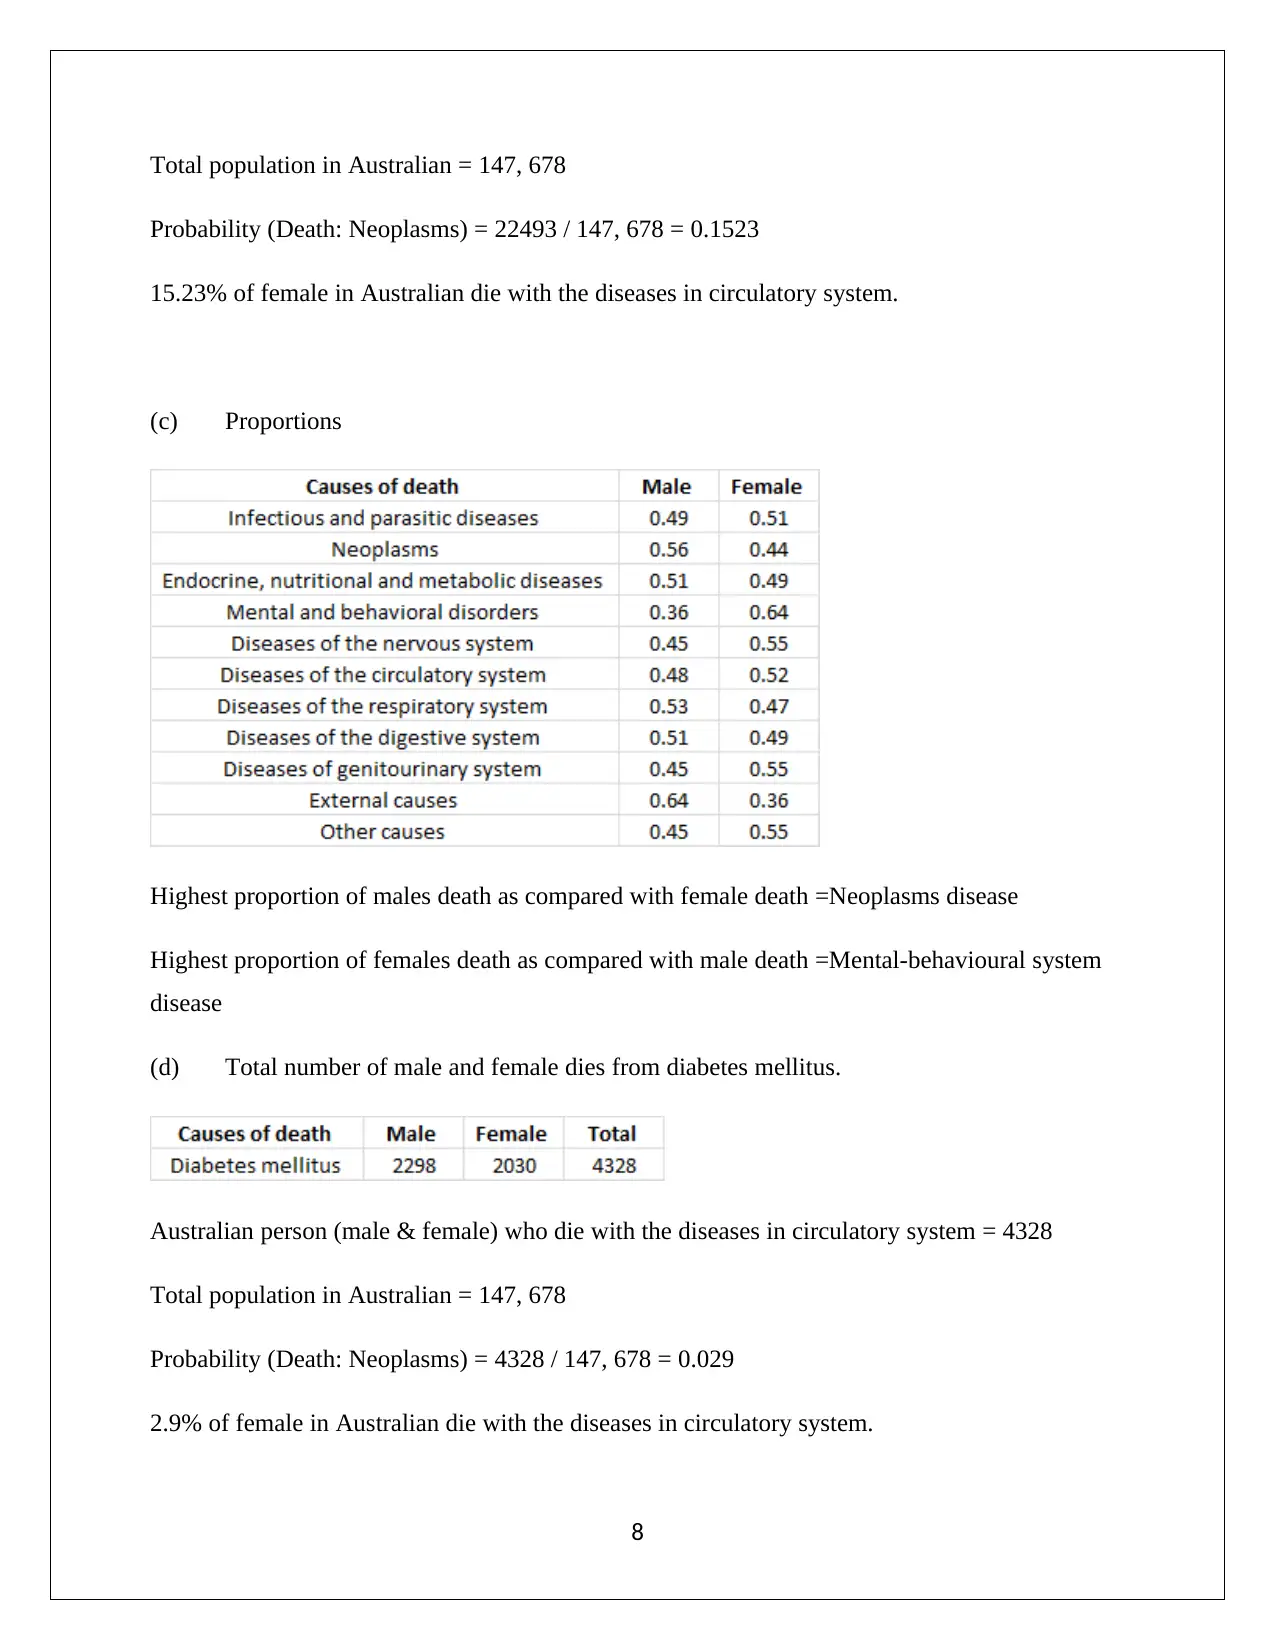
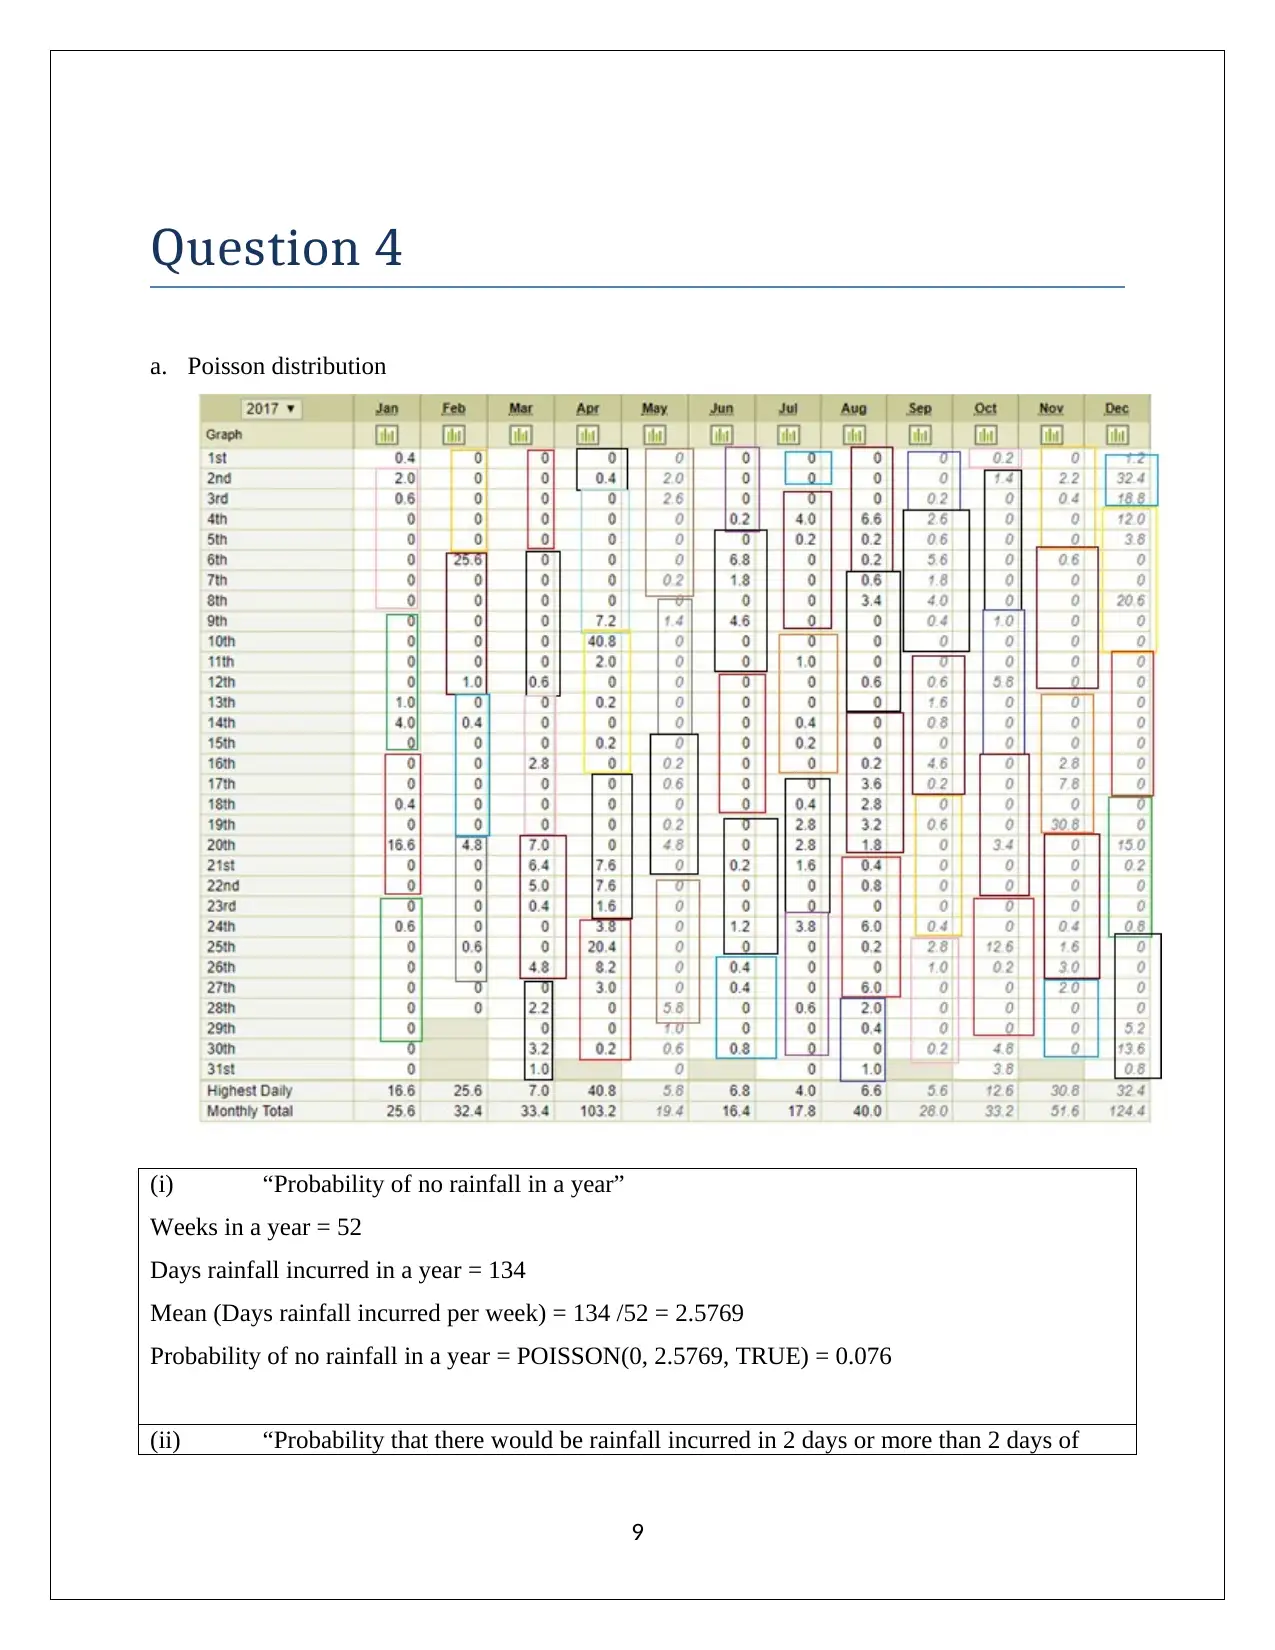
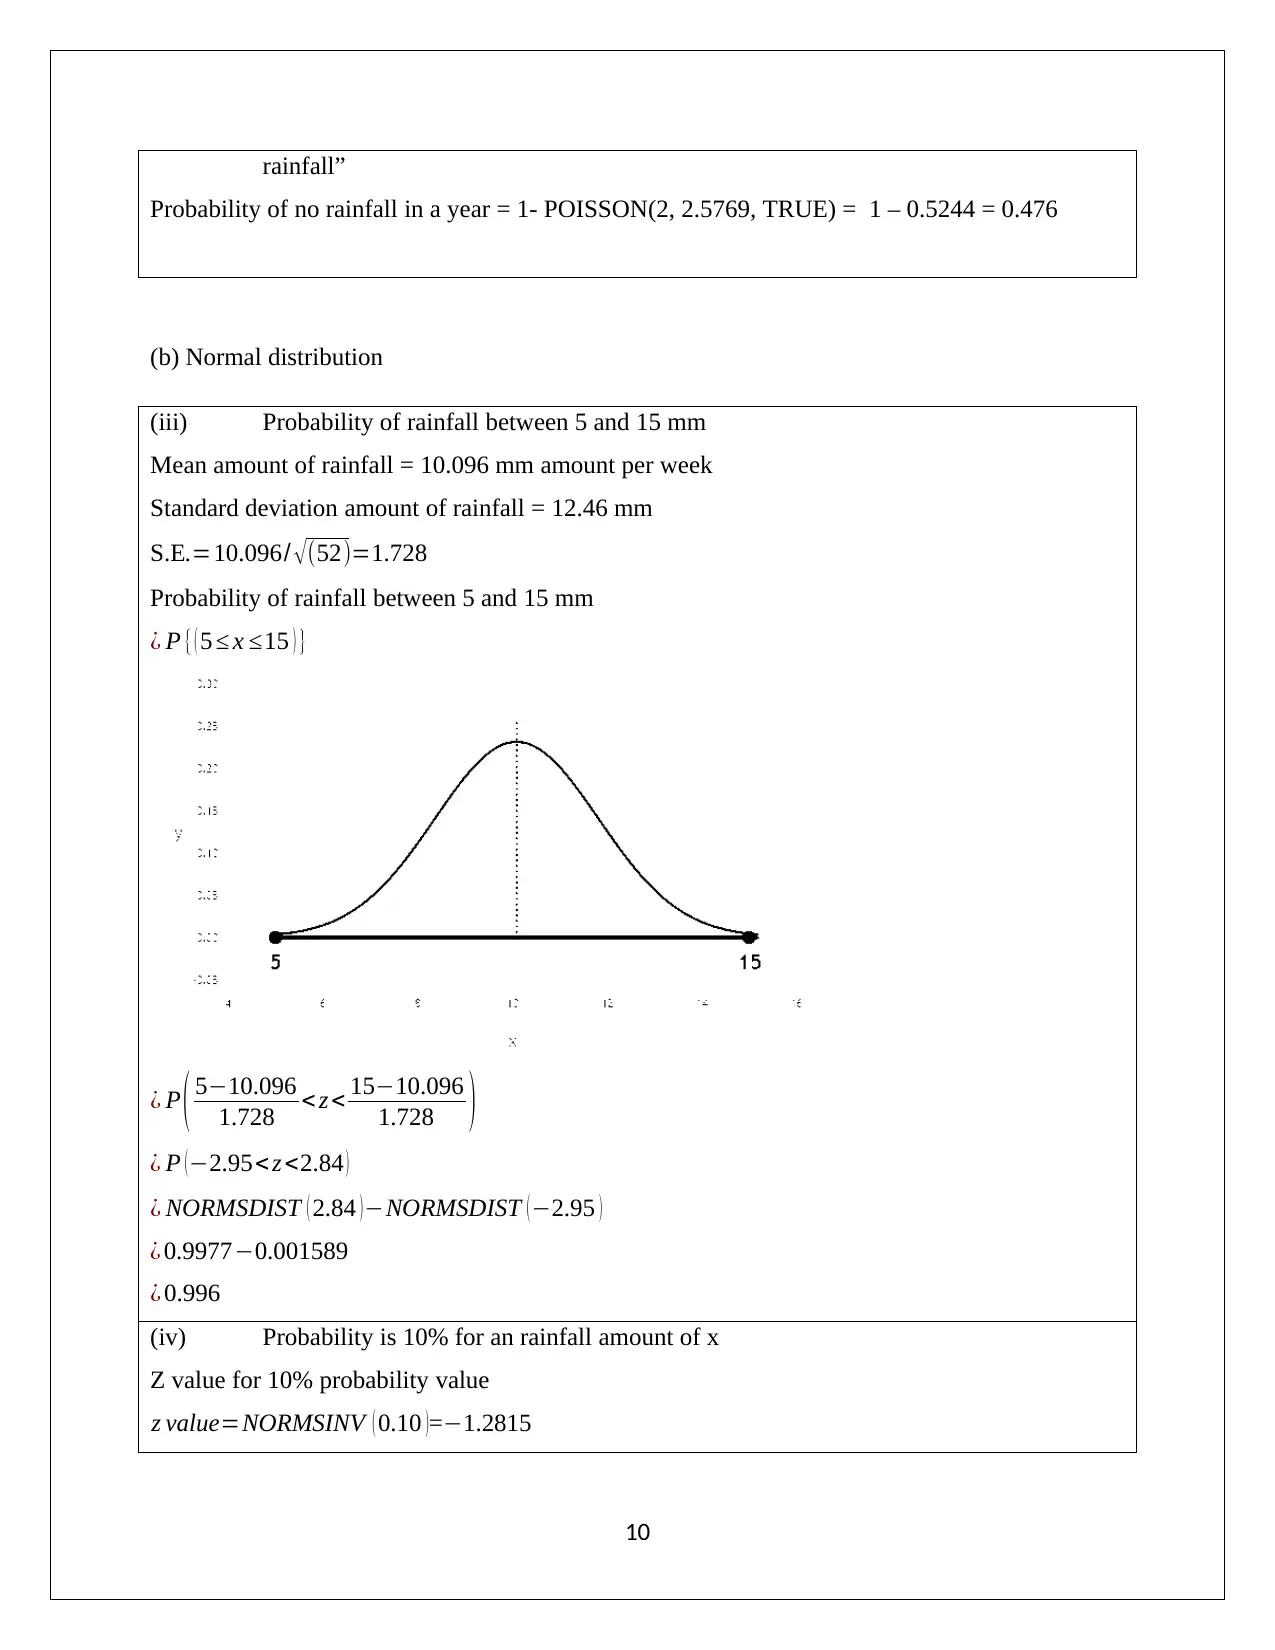
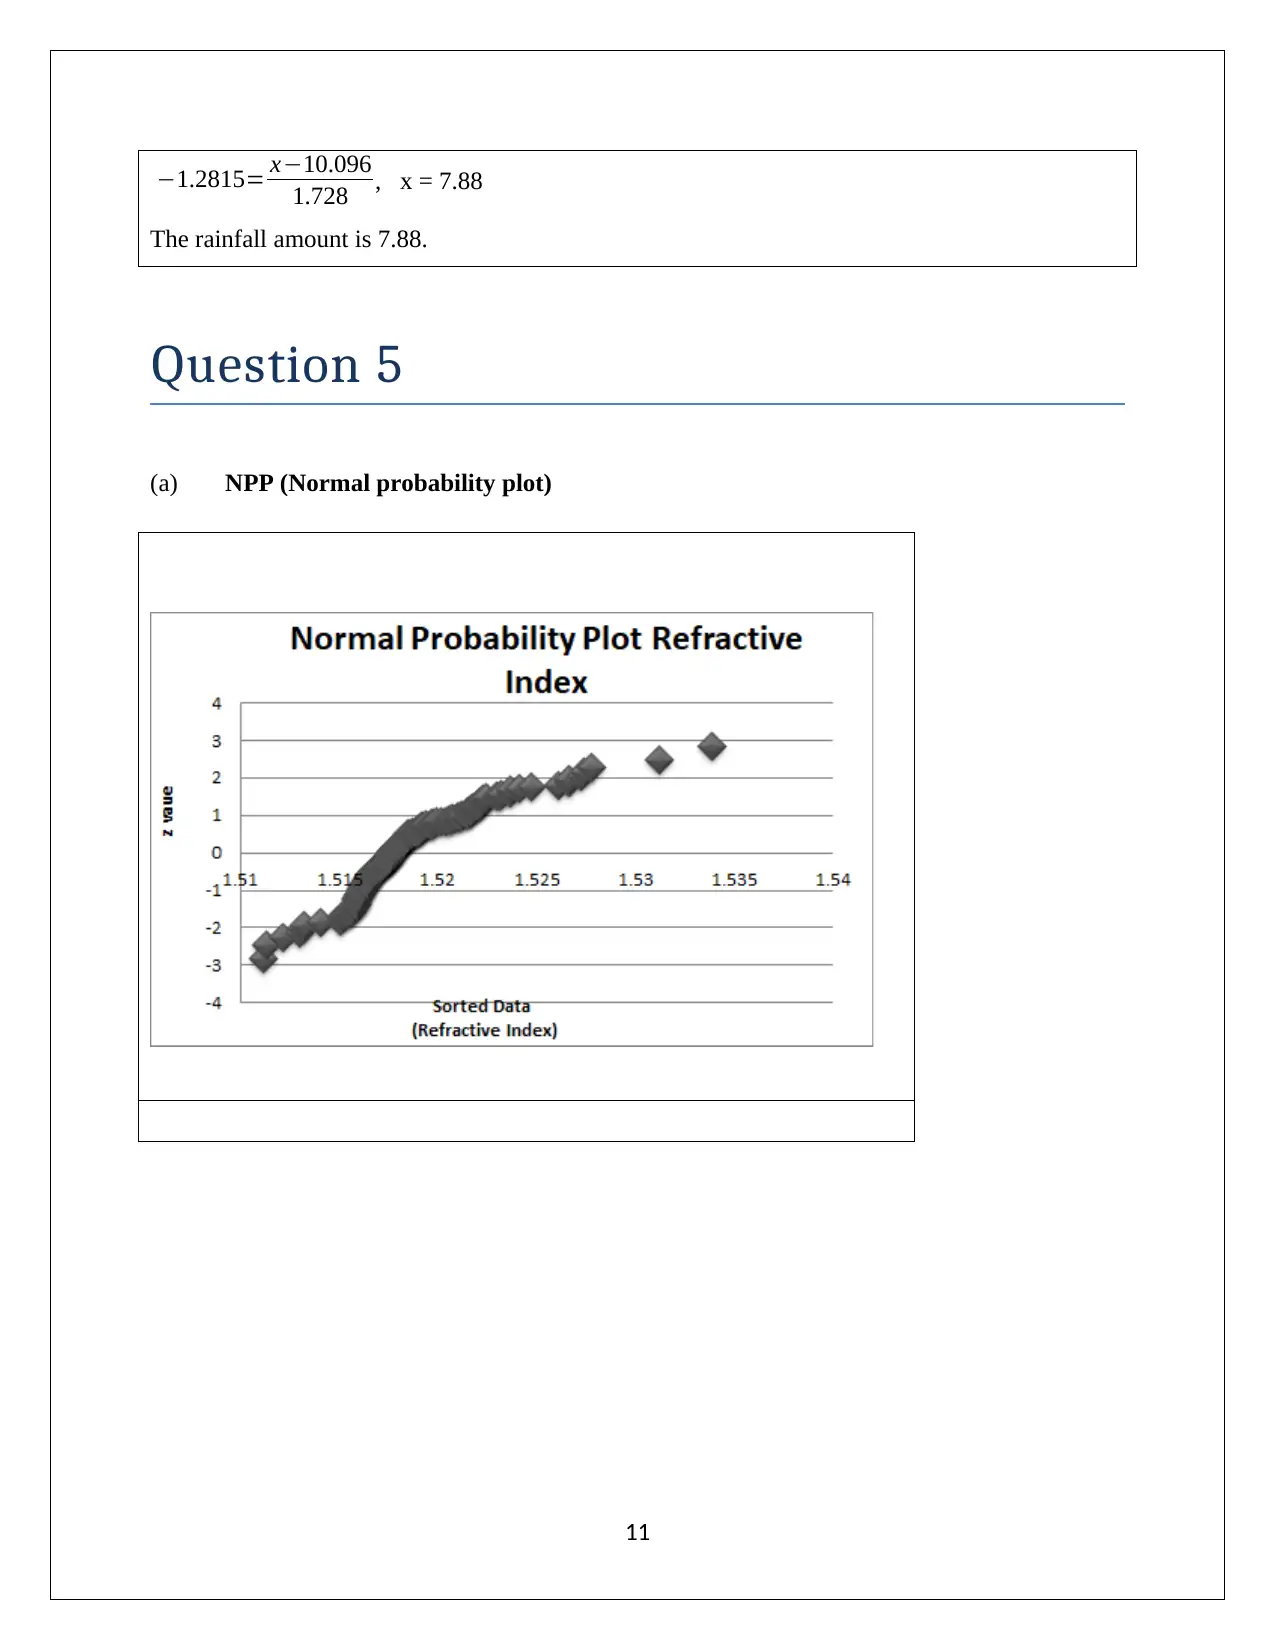
This statistics assignment provides a comprehensive analysis of financial data and statistical concepts. It begins with an evaluation of stock performance, comparing analyst recommendations for Macquarie Group Limited (MQG) and Perpetual Limited (PPT) to suggest a buy/sell recommendation. The assignment then delves into the valuation of stocks using price-earnings ratios, including calculations of mean, median, quartiles, standard deviation, and box-whisker plots. It proceeds to analyze mortality rates in Australia, calculating probabilities related to causes of death like neoplasms, circulatory system diseases, and diabetes. The assignment further explores probability distributions, applying the Poisson distribution to rainfall data and the normal distribution to rainfall amounts. Finally, it examines normal probability plots (NPP) to assess the normality of various variables related to refractive index, aluminum, calcium, sodium, silicon, barium, magnesium, potassium, and iron for float and non-float glass, and calculates confidence intervals to determine the significance of differences between the two types of glass.
Document Page
STATISTICS FOR MANAGERIAL DECISION
ASSIGNMENT ITEM II
Student Name
[Pick the date]
tabler-icon-diamond-filled.svg

Secure Best Marks with AI Grader

Need help grading? Try our AI Grader for instant feedback on your assignments.
Document Page
Question 1
(a) Quarterly opening prices ($) and stem-leaf plot
Quarterly opening prices
Stem-leaf plot
1
Document Page
(b) The respective graph is representation below:
Relative frequency histogram: Macquarie Group Limited
Frequency polygon: Perpetual Limited
2
Document Page
(c) The respective bar chart to represent the market capitals/total assets for the six companies
in 2017 is shown below:
3
tabler-icon-diamond-filled.svg

Secure Best Marks with AI Grader

Need help grading? Try our AI Grader for instant feedback on your assignments.
Document Page
(d) In order to decide on the buy/sell recommendation pertaining to the two stock, it is
worthwhile to refer to the analyst recommendation in relation to the two stocks and then
draw a comparison and suggest trade.
Analyst Recommendations for PPT Stock
This is highlighted below.
4
Document Page
Source: https://www.reuters.com/finance/stocks/analyst/PPT.AX
Analyst Recommendations for PPT Stock
This is highlighted below.
Source: https://www.reuters.com/finance/stocks/analyst/MQG.AX
Recommendation
Based on the recommendations by analyst, it is apparent that MQG stock should be preferred
over PPT considering that for MQG there are no sell calls and the analysts seem quite confident
about the upside visible in the stock.
Question 2
5
Document Page
Average price earnings
(a) “Mean, median, 1st and 3rd quartile”
(b) “Standard deviation, mean absolute deviation and range”
(c) Box-whisker plot
6
tabler-icon-diamond-filled.svg

Paraphrase This Document

Need a fresh take? Get an instant paraphrase of this document with our AI Paraphraser
Document Page
(d) The P/E of the stock plays a vital role in the valuation of the business. This ratio besides
depending on industry, past financial performance tends to highly depend on future
growth that the business can potentially deliver. As a result, businesses that tend to trade
at above average P/E ratios are typically those with high growth prospects going ahead.
Question 3
(a) Australian person (male & female) who die with Neoplasms = 44,674
Total population in Australian = 147, 678
Probability (Death: Neoplasms) = 44,674 / 147, 678 = 0.3025
30.25% of people in Australian die with Neoplasms diseases.
(b) Australian person (female) who die with the diseases in circulatory system = 22,493
7
Document Page
Total population in Australian = 147, 678
Probability (Death: Neoplasms) = 22493 / 147, 678 = 0.1523
15.23% of female in Australian die with the diseases in circulatory system.
(c) Proportions
Highest proportion of males death as compared with female death =Neoplasms disease
Highest proportion of females death as compared with male death =Mental-behavioural system
disease
(d) Total number of male and female dies from diabetes mellitus.
Australian person (male & female) who die with the diseases in circulatory system = 4328
Total population in Australian = 147, 678
Probability (Death: Neoplasms) = 4328 / 147, 678 = 0.029
2.9% of female in Australian die with the diseases in circulatory system.
8
Document Page
Question 4
a. Poisson distribution
(i) “Probability of no rainfall in a year”
Weeks in a year = 52
Days rainfall incurred in a year = 134
Mean (Days rainfall incurred per week) = 134 /52 = 2.5769
Probability of no rainfall in a year = POISSON(0, 2.5769, TRUE) = 0.076
(ii) “Probability that there would be rainfall incurred in 2 days or more than 2 days of
9
tabler-icon-diamond-filled.svg

Secure Best Marks with AI Grader

Need help grading? Try our AI Grader for instant feedback on your assignments.
Document Page
rainfall”
Probability of no rainfall in a year = 1- POISSON(2, 2.5769, TRUE) = 1 – 0.5244 = 0.476
(b) Normal distribution
(iii) Probability of rainfall between 5 and 15 mm
Mean amount of rainfall = 10.096 mm amount per week
Standard deviation amount of rainfall = 12.46 mm
S.E.=10.096/ (52)=1.728
Probability of rainfall between 5 and 15 mm
¿ P {( 5 x 15 ) }
¿ P ( 510.096
1.728 < z < 1510.096
1.728 )
¿ P ( 2.95< z <2.84 )
¿ NORMSDIST ( 2.84 )NORMSDIST (2.95 )
¿ 0.99770.001589
¿ 0.996
(iv) Probability is 10% for an rainfall amount of x
Z value for 10% probability value
z value=NORMSINV ( 0.10 )=1.2815
10
Document Page
1.2815= x10.096
1.728 , x = 7.88
The rainfall amount is 7.88.
Question 5
(a) NPP (Normal probability plot)
11
Document Page
12
tabler-icon-diamond-filled.svg

Paraphrase This Document

Need a fresh take? Get an instant paraphrase of this document with our AI Paraphraser
Document Page
69 70 71 72 73 74 75 76
-4
-3
-2
-1
0
1
2
3
4
Normal Probability Plot Silicon
Sorted data
Silicon)
z value
13
Document Page
14
Document Page
0 0.1 0.2 0.3 0.4 0.5 0.6
-4
-3
-2
-1
0
1
2
3
4
Normal Probability Plot Iron
Sorted data
(Iron)
z value
For a given variable to be distributed normally, it is essential that the normal probability plot
must have a nearly linear trend. Any significant departure from the same implies that the
assumption of variable being normally distributed does not hold. Hence, the following variables
can be assumed as normally distributed.
Refractive Index
Sodium
Aluminium
Silicon
15
tabler-icon-diamond-filled.svg

Secure Best Marks with AI Grader

Need help grading? Try our AI Grader for instant feedback on your assignments.
Document Page
Potassium
(b) The confidence interval (90%) for both float glass and non- float glass is shown below:
Refractive Index
Float glass
Non-float glass
The two confidence intervals do overlap with each other owing to which the difference between
the two glass types cannot be considered significant.
16
Document Page
Aluminium
Float glass
Non-float glass
The two confidence intervals do not overlap with each other owing to which the difference
between the two glass types can be considered significant.
Calcium
Float glass
17
Document Page
Non-float glass
The two confidence intervals do overlap with each other owing to which the difference between
the two glass types cannot be considered significant.
Sodium
Float glass
18
tabler-icon-diamond-filled.svg

Paraphrase This Document

Need a fresh take? Get an instant paraphrase of this document with our AI Paraphraser
Document Page
Non-float glass
The two confidence intervals do overlap with each other owing to which the difference between
the two glass types cannot be considered significant.
Silicon
Float glass
19
Document Page
Non-float glass
The two confidence intervals do overlap with each other owing to which the difference between
the two glass types cannot be considered significant.
Barium
Float glass
20
Document Page
Non-float glass
The two confidence intervals do not overlap with each other owing to which the difference
between the two glass types can be considered significant.
Magnesium
Float glass
21
tabler-icon-diamond-filled.svg

Secure Best Marks with AI Grader

Need help grading? Try our AI Grader for instant feedback on your assignments.
Document Page
Non-float glass
The two confidence intervals do not overlap with each other owing to which the difference
between the two glass types can be considered significant.
Potassium
Float glass
22
Document Page
Non-float glass
The two confidence intervals do overlap with each other owing to which the difference between
the two glass types cannot be considered significant.
Iron
Float glass
23
Document Page
Non-float glass
The two confidence intervals do overlap with each other owing to which the difference between
the two glass types cannot be considered significant.
24
chevron_up_icon
1 out of 25
circle_padding
hide_on_mobile
zoom_out_icon
logo.png

Your All-in-One AI-Powered Toolkit for Academic Success.

Available 24*7 on WhatsApp / Email

[object Object]