Statistics Assignment: MANOVA and Reflection on Cholesterol Study

Verified

Added on  2023/01/11

|10
|1454
|60
Homework Assignment
AI Summary
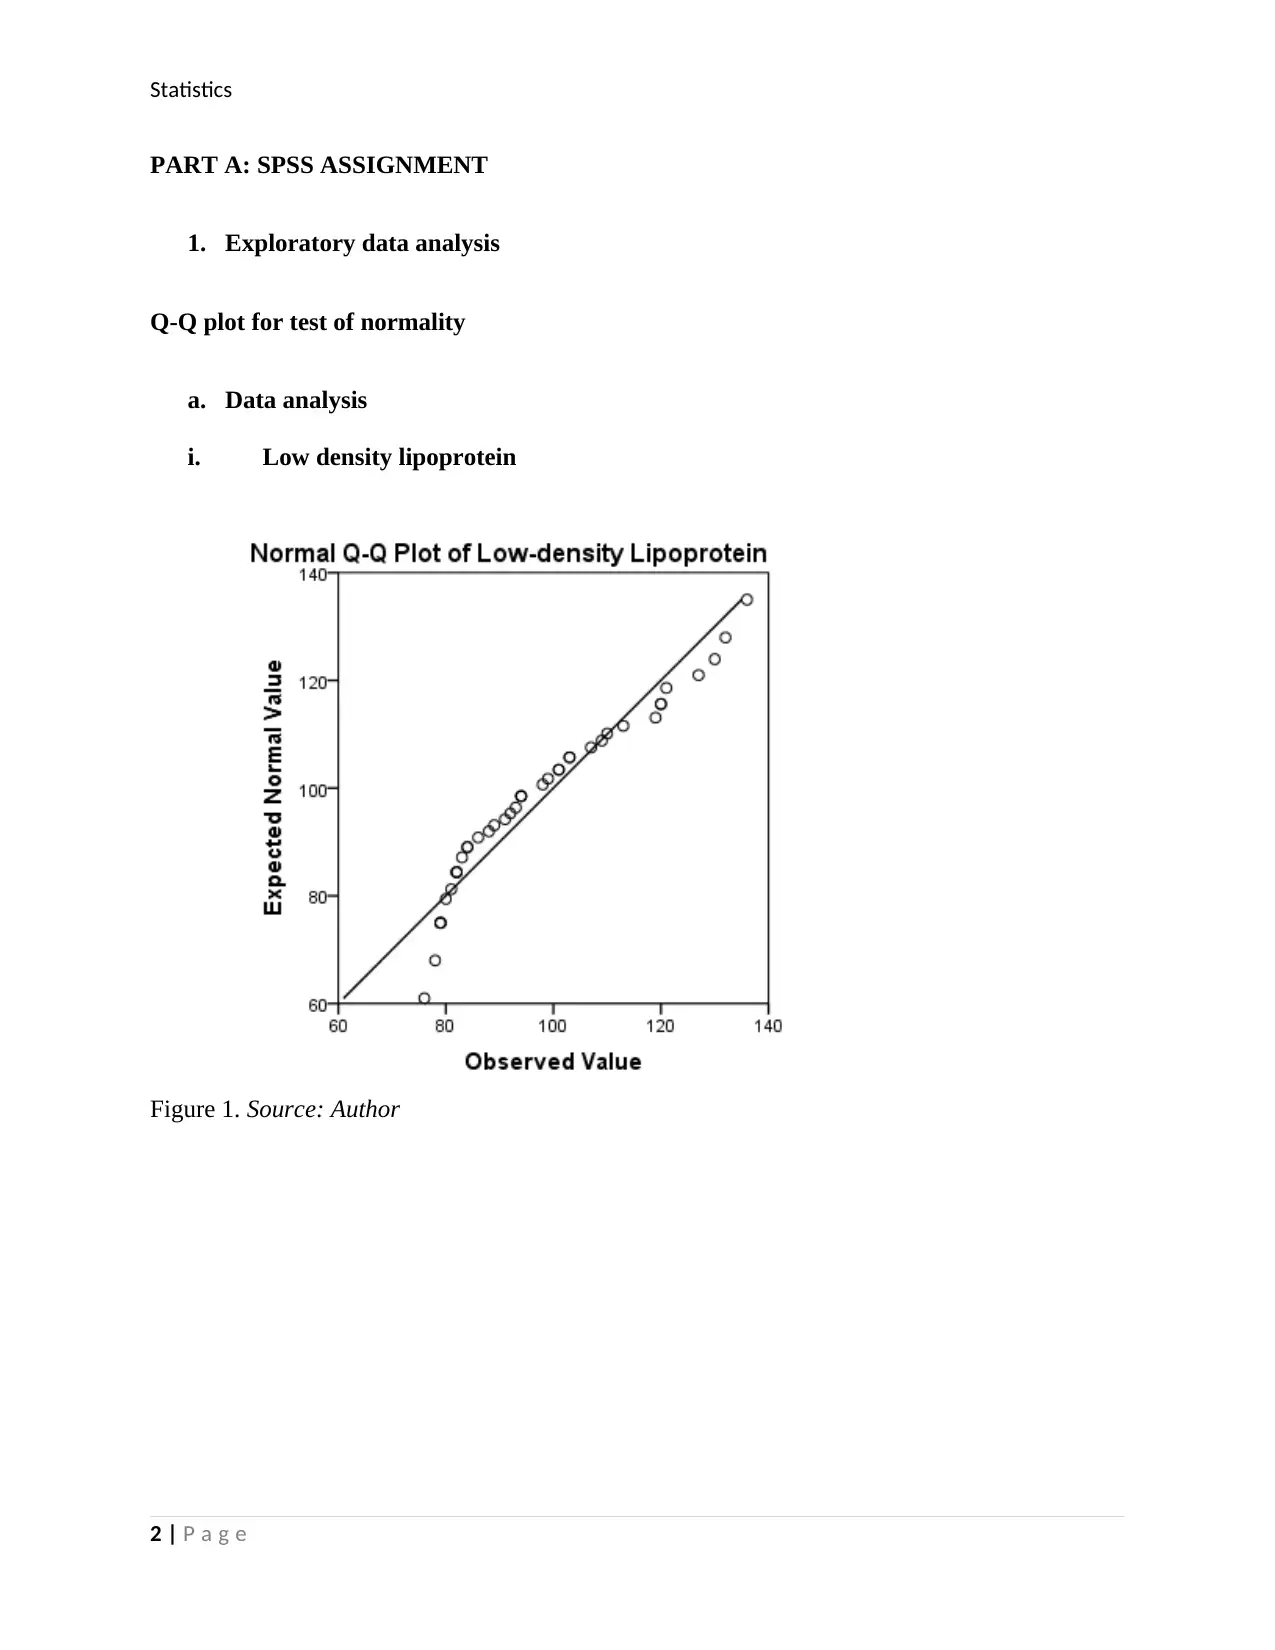
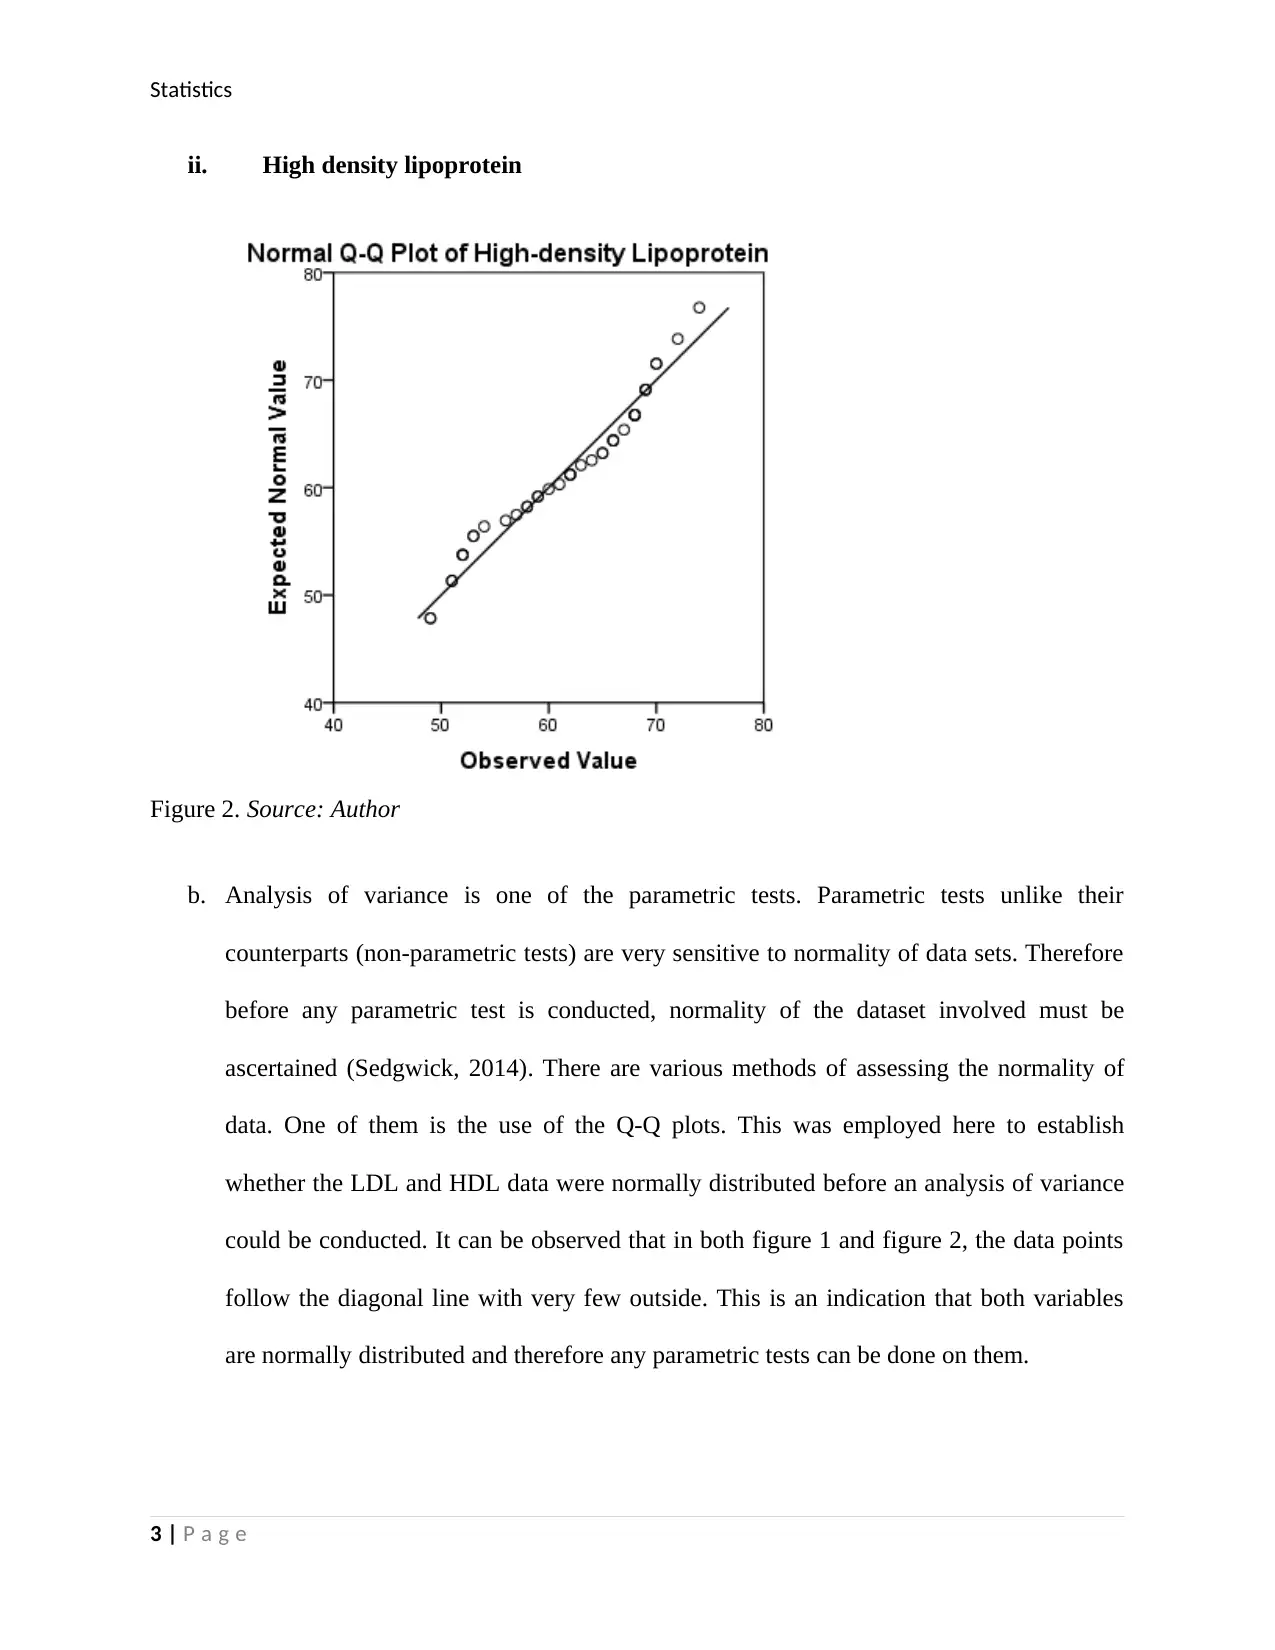
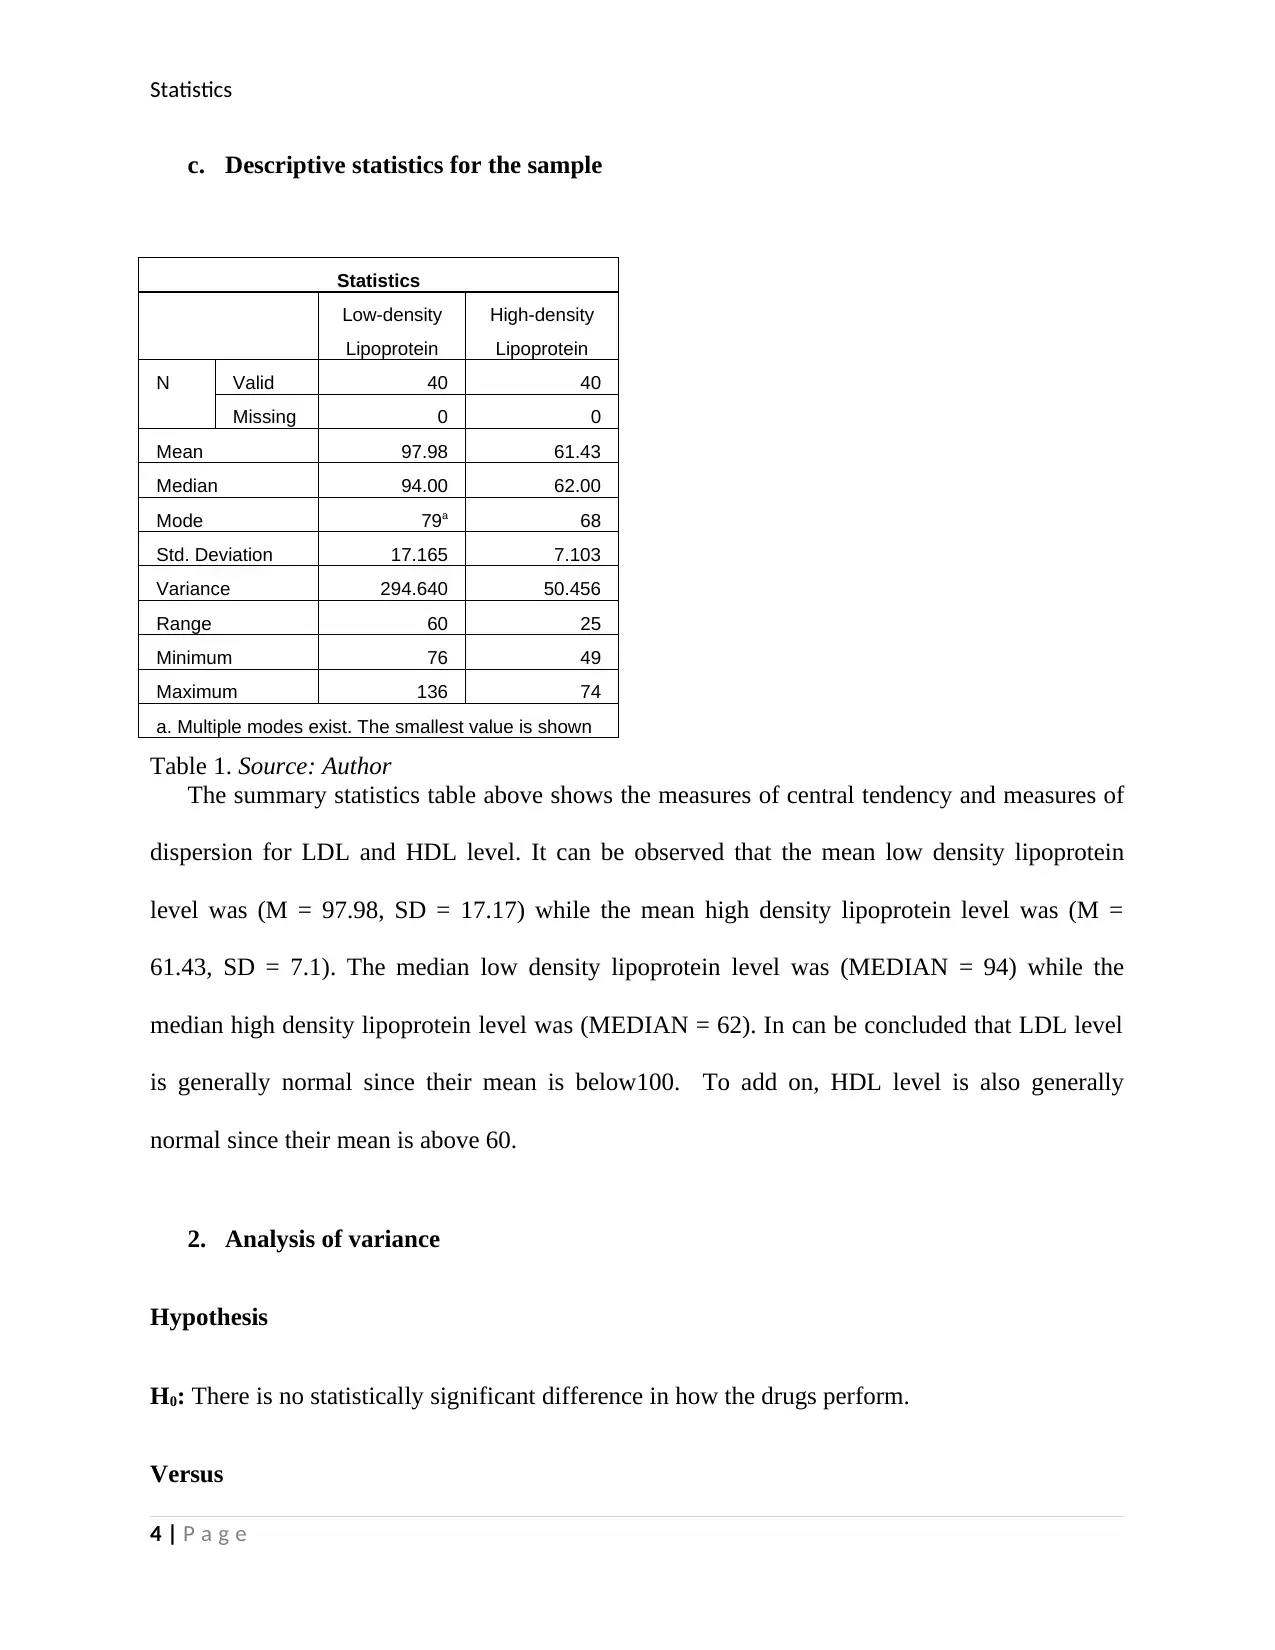
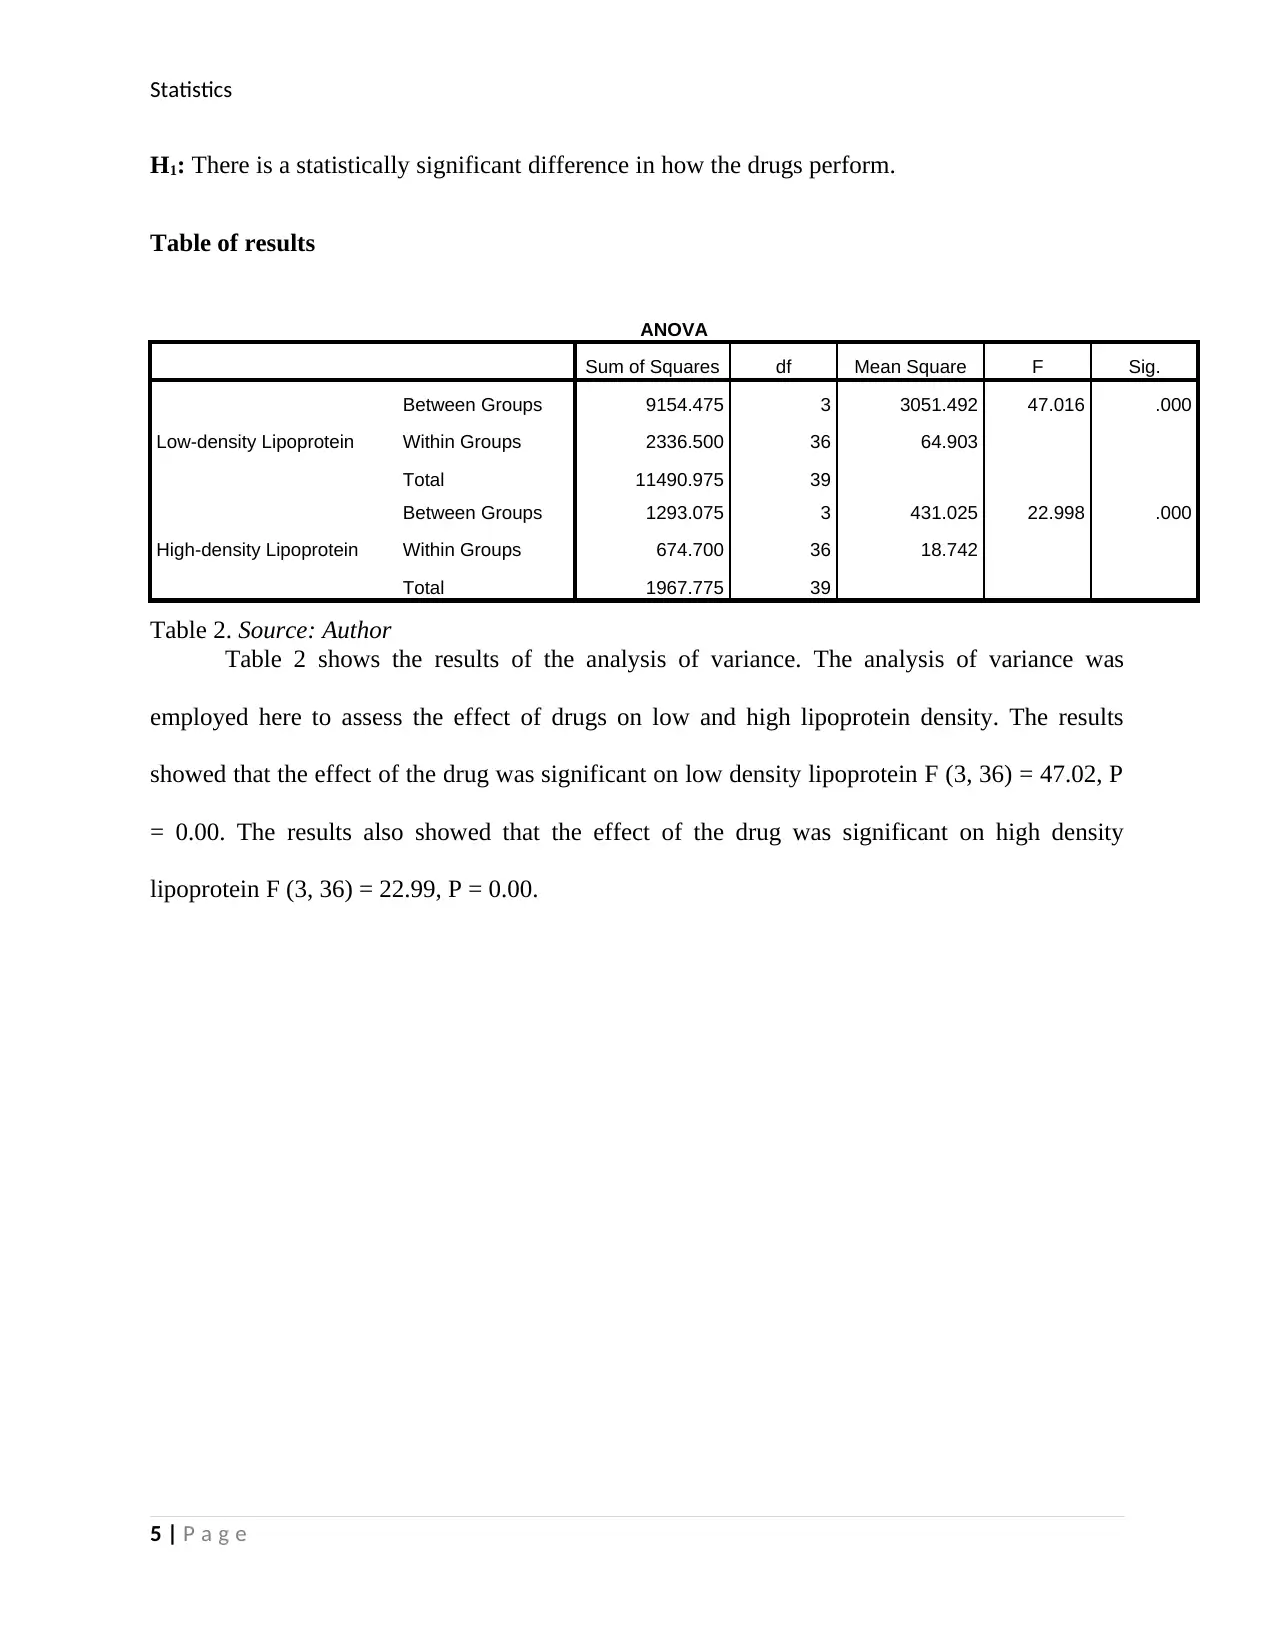
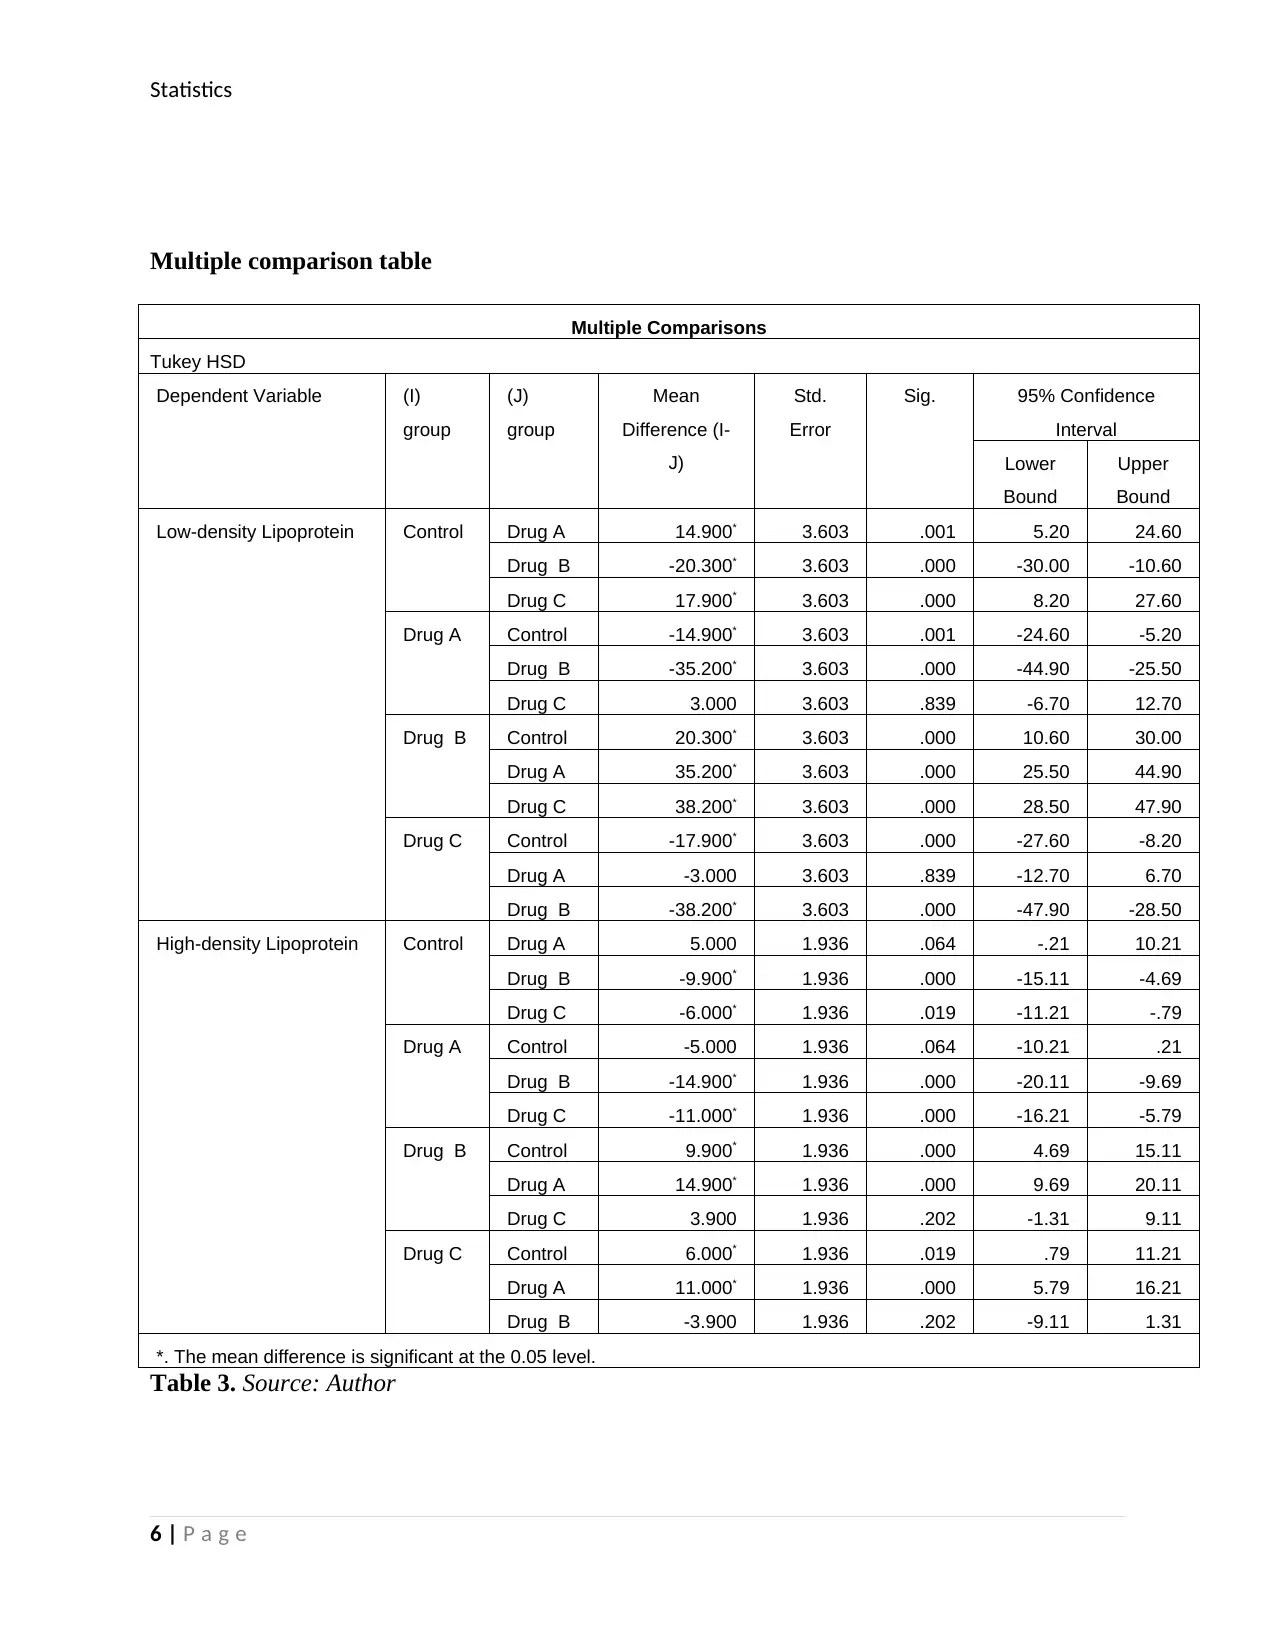
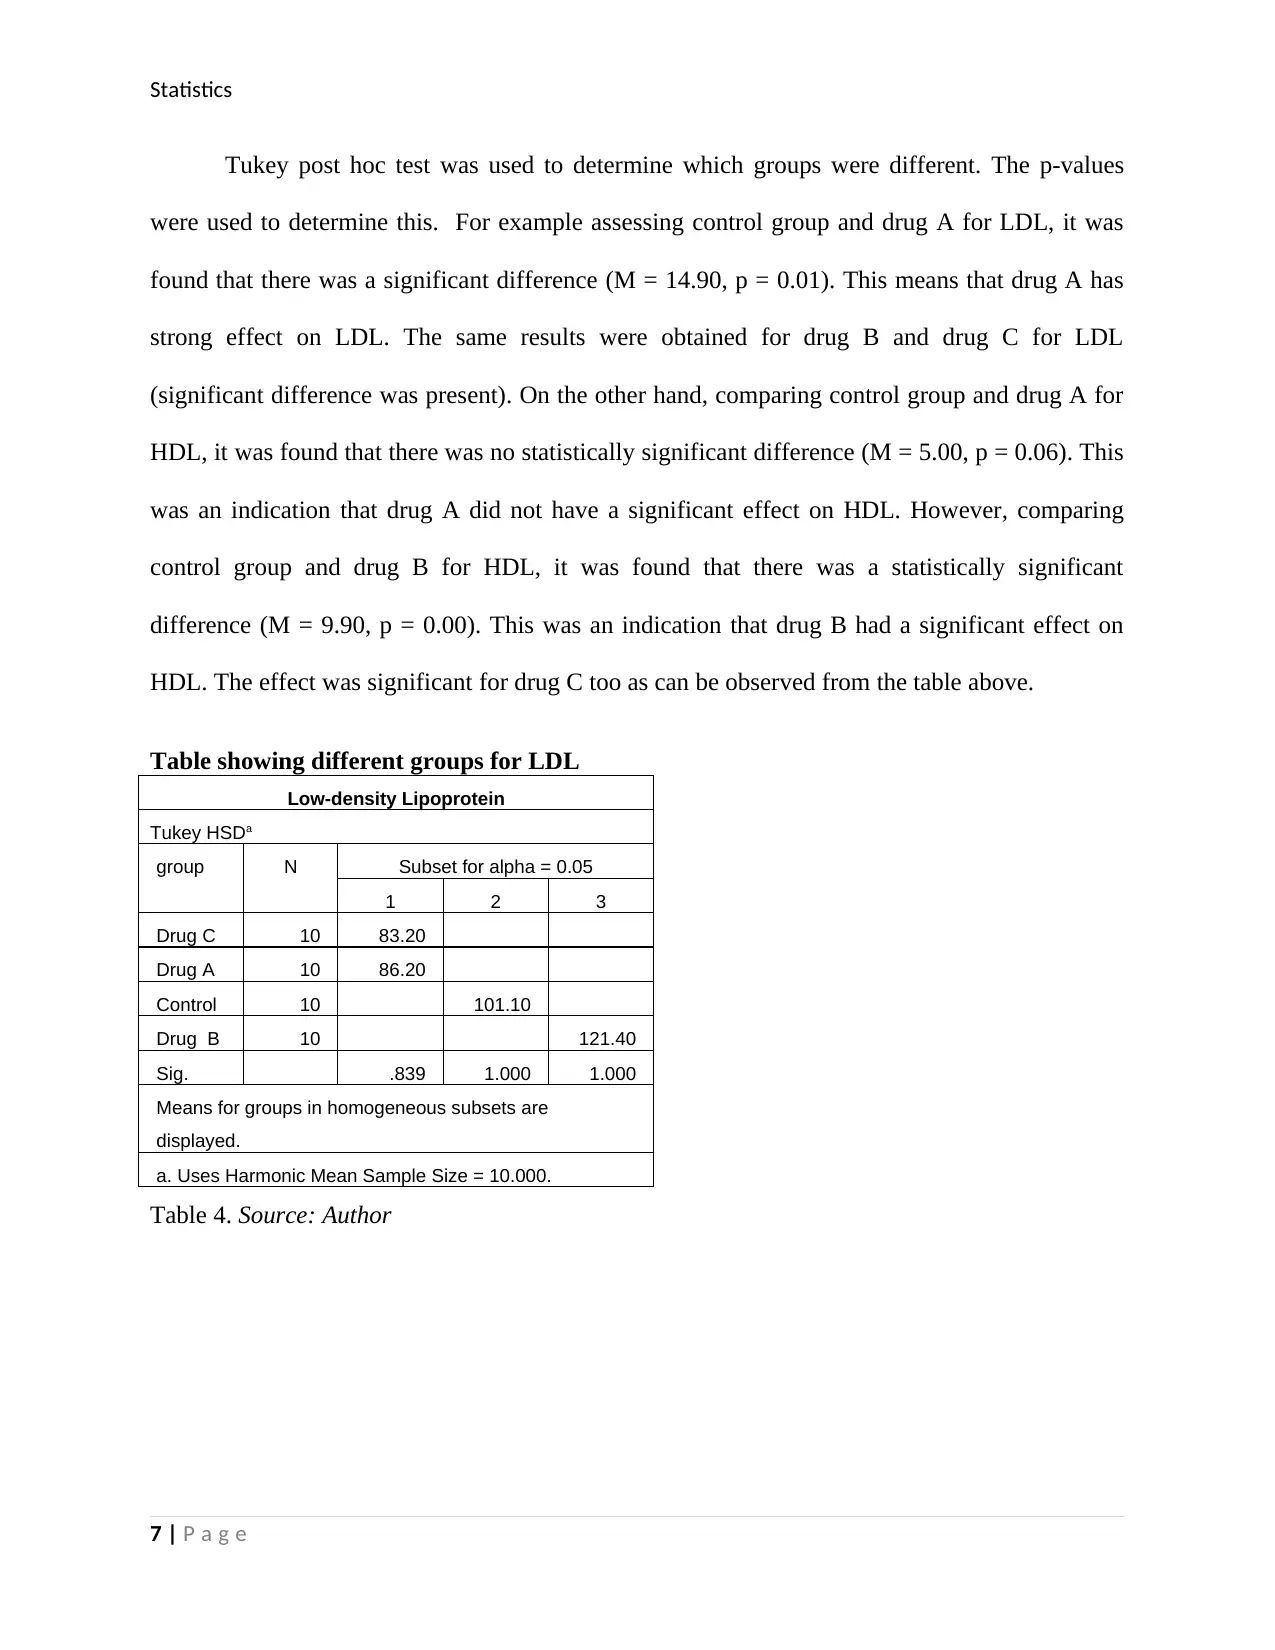
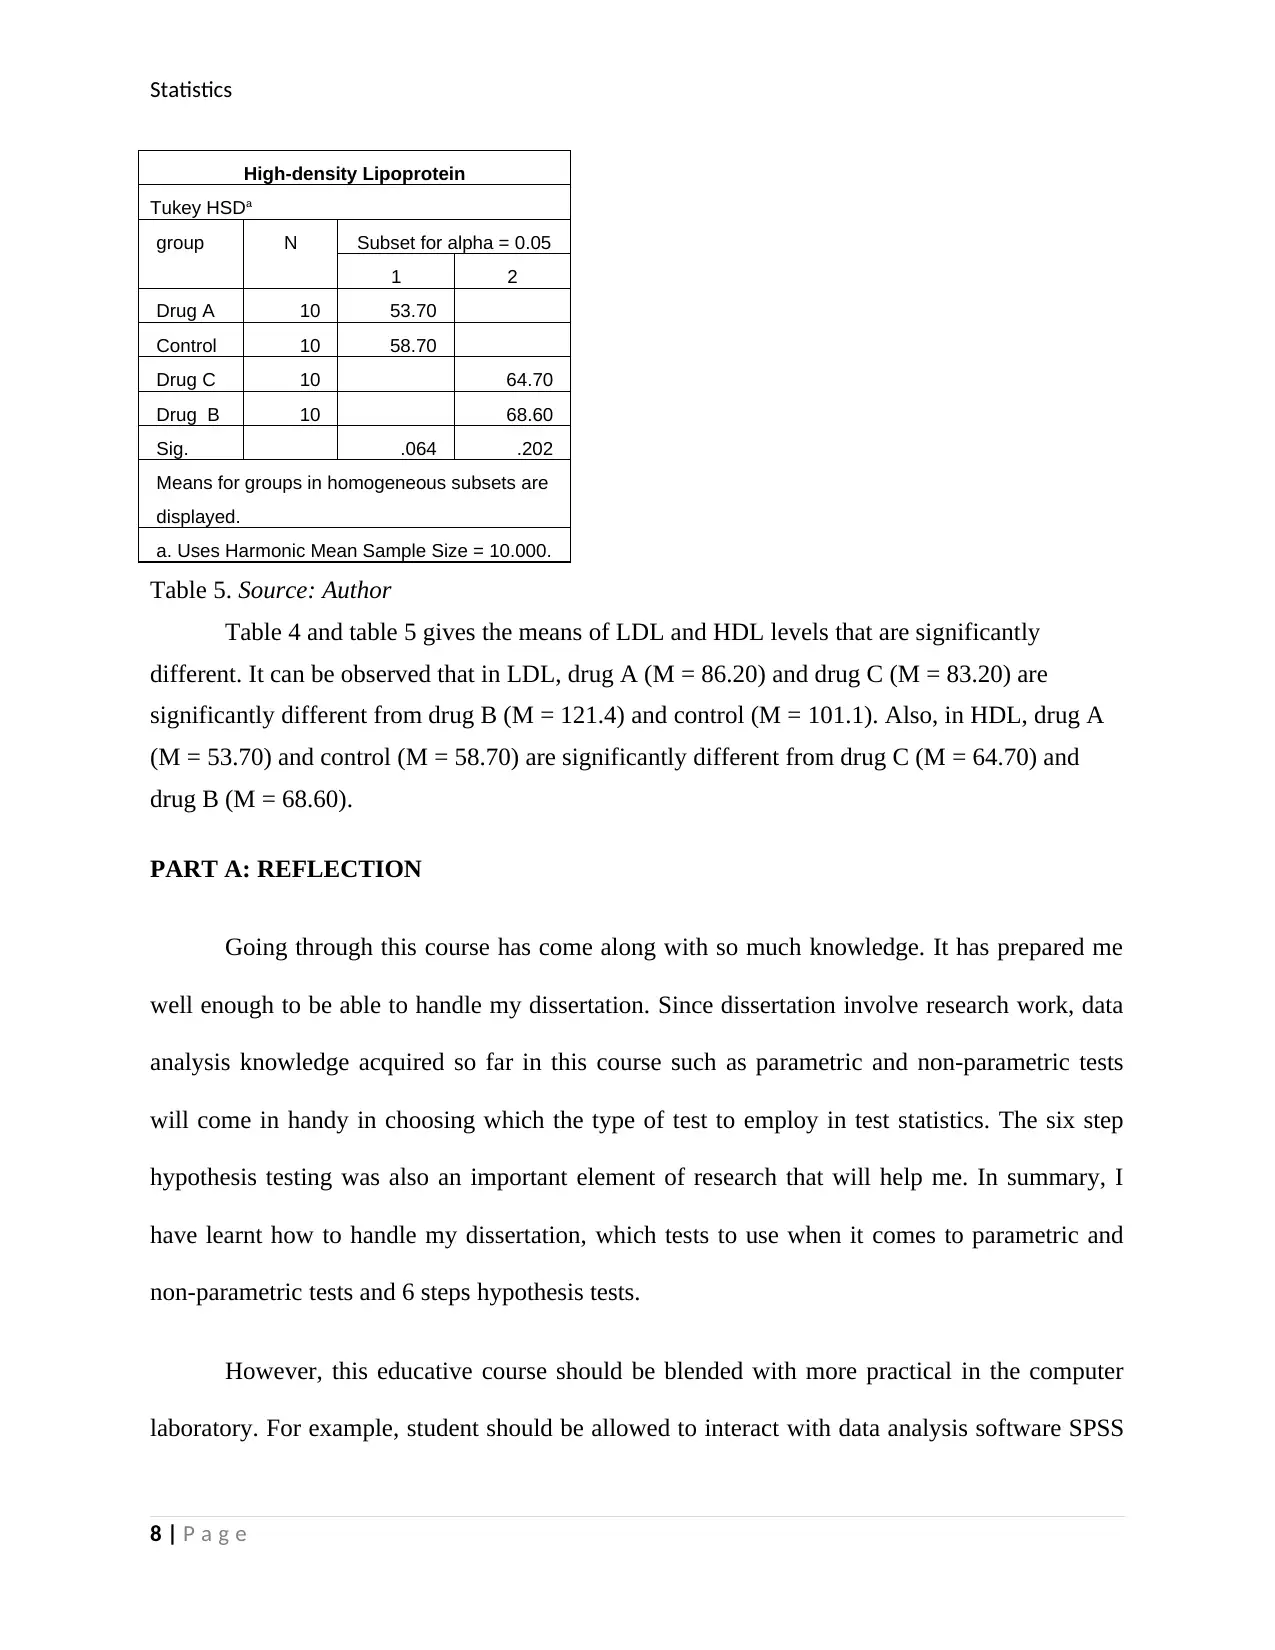
This assignment presents a student's analysis of a dataset using MANOVA to assess the effects of different drugs on cholesterol levels (LDL and HDL). The student utilized SPSS to conduct exploratory data analysis, including Q-Q plots to test for normality, and descriptive statistics to summarize the data. The core of the assignment involves performing an ANOVA and MANOVA to determine if there are statistically significant differences in the performance of the drugs. The results, including ANOVA tables and multiple comparison tables, are provided. The student also conducted a Tukey post hoc test to determine specific group differences. The assignment concludes with a reflection on the course, highlighting the knowledge gained in statistical tests, hypothesis testing, and the application of these skills to research, particularly in the context of dissertation work. The student suggests the need for more hands-on practice with SPSS and access to different data analysis software.
tabler-icon-diamond-filled.svg

Contribute Materials

Your contribution can guide someone’s learning journey. Share your documents today.
Document Page
Statistics
MANOVA and Reflection:
Student name:
Instructor:
1 | P a g e
tabler-icon-diamond-filled.svg

Secure Best Marks with AI Grader

Need help grading? Try our AI Grader for instant feedback on your assignments.
Document Page
Statistics
PART A: SPSS ASSIGNMENT
1. Exploratory data analysis
Q-Q plot for test of normality
a. Data analysis
i. Low density lipoprotein
Figure 1. Source: Author
2 | P a g e
Document Page
Statistics
ii. High density lipoprotein
Figure 2. Source: Author
b. Analysis of variance is one of the parametric tests. Parametric tests unlike their
counterparts (non-parametric tests) are very sensitive to normality of data sets. Therefore
before any parametric test is conducted, normality of the dataset involved must be
ascertained (Sedgwick, 2014). There are various methods of assessing the normality of
data. One of them is the use of the Q-Q plots. This was employed here to establish
whether the LDL and HDL data were normally distributed before an analysis of variance
could be conducted. It can be observed that in both figure 1 and figure 2, the data points
follow the diagonal line with very few outside. This is an indication that both variables
are normally distributed and therefore any parametric tests can be done on them.
3 | P a g e
Document Page
Statistics
c. Descriptive statistics for the sample
Statistics
Low-density
Lipoprotein
High-density
Lipoprotein
N Valid 40 40
Missing 0 0
Mean 97.98 61.43
Median 94.00 62.00
Mode 79a 68
Std. Deviation 17.165 7.103
Variance 294.640 50.456
Range 60 25
Minimum 76 49
Maximum 136 74
a. Multiple modes exist. The smallest value is shown
Table 1. Source: Author
The summary statistics table above shows the measures of central tendency and measures of
dispersion for LDL and HDL level. It can be observed that the mean low density lipoprotein
level was (M = 97.98, SD = 17.17) while the mean high density lipoprotein level was (M =
61.43, SD = 7.1). The median low density lipoprotein level was (MEDIAN = 94) while the
median high density lipoprotein level was (MEDIAN = 62). In can be concluded that LDL level
is generally normal since their mean is below100. To add on, HDL level is also generally
normal since their mean is above 60.
2. Analysis of variance
Hypothesis
H0: There is no statistically significant difference in how the drugs perform.
Versus
4 | P a g e
tabler-icon-diamond-filled.svg

Secure Best Marks with AI Grader

Need help grading? Try our AI Grader for instant feedback on your assignments.
Document Page
Statistics
H1: There is a statistically significant difference in how the drugs perform.
Table of results
ANOVA
Sum of Squares df Mean Square F Sig.
Low-density Lipoprotein
Between Groups 9154.475 3 3051.492 47.016 .000
Within Groups 2336.500 36 64.903
Total 11490.975 39
High-density Lipoprotein
Between Groups 1293.075 3 431.025 22.998 .000
Within Groups 674.700 36 18.742
Total 1967.775 39
Table 2. Source: Author
Table 2 shows the results of the analysis of variance. The analysis of variance was
employed here to assess the effect of drugs on low and high lipoprotein density. The results
showed that the effect of the drug was significant on low density lipoprotein F (3, 36) = 47.02, P
= 0.00. The results also showed that the effect of the drug was significant on high density
lipoprotein F (3, 36) = 22.99, P = 0.00.
5 | P a g e
Document Page
Statistics
Multiple comparison table
Multiple Comparisons
Tukey HSD
Dependent Variable (I)
group
(J)
group
Mean
Difference (I-
J)
Std.
Error
Sig. 95% Confidence
Interval
Lower
Bound
Upper
Bound
Low-density Lipoprotein Control Drug A 14.900* 3.603 .001 5.20 24.60
Drug B -20.300* 3.603 .000 -30.00 -10.60
Drug C 17.900* 3.603 .000 8.20 27.60
Drug A Control -14.900* 3.603 .001 -24.60 -5.20
Drug B -35.200* 3.603 .000 -44.90 -25.50
Drug C 3.000 3.603 .839 -6.70 12.70
Drug B Control 20.300* 3.603 .000 10.60 30.00
Drug A 35.200* 3.603 .000 25.50 44.90
Drug C 38.200* 3.603 .000 28.50 47.90
Drug C Control -17.900* 3.603 .000 -27.60 -8.20
Drug A -3.000 3.603 .839 -12.70 6.70
Drug B -38.200* 3.603 .000 -47.90 -28.50
High-density Lipoprotein Control Drug A 5.000 1.936 .064 -.21 10.21
Drug B -9.900* 1.936 .000 -15.11 -4.69
Drug C -6.000* 1.936 .019 -11.21 -.79
Drug A Control -5.000 1.936 .064 -10.21 .21
Drug B -14.900* 1.936 .000 -20.11 -9.69
Drug C -11.000* 1.936 .000 -16.21 -5.79
Drug B Control 9.900* 1.936 .000 4.69 15.11
Drug A 14.900* 1.936 .000 9.69 20.11
Drug C 3.900 1.936 .202 -1.31 9.11
Drug C Control 6.000* 1.936 .019 .79 11.21
Drug A 11.000* 1.936 .000 5.79 16.21
Drug B -3.900 1.936 .202 -9.11 1.31
*. The mean difference is significant at the 0.05 level.
Table 3. Source: Author
6 | P a g e
Document Page
Statistics
Tukey post hoc test was used to determine which groups were different. The p-values
were used to determine this. For example assessing control group and drug A for LDL, it was
found that there was a significant difference (M = 14.90, p = 0.01). This means that drug A has
strong effect on LDL. The same results were obtained for drug B and drug C for LDL
(significant difference was present). On the other hand, comparing control group and drug A for
HDL, it was found that there was no statistically significant difference (M = 5.00, p = 0.06). This
was an indication that drug A did not have a significant effect on HDL. However, comparing
control group and drug B for HDL, it was found that there was a statistically significant
difference (M = 9.90, p = 0.00). This was an indication that drug B had a significant effect on
HDL. The effect was significant for drug C too as can be observed from the table above.
Table showing different groups for LDL
Low-density Lipoprotein
Tukey HSDa
group N Subset for alpha = 0.05
1 2 3
Drug C 10 83.20
Drug A 10 86.20
Control 10 101.10
Drug B 10 121.40
Sig. .839 1.000 1.000
Means for groups in homogeneous subsets are
displayed.
a. Uses Harmonic Mean Sample Size = 10.000.
Table 4. Source: Author
7 | P a g e
tabler-icon-diamond-filled.svg

Paraphrase This Document

Need a fresh take? Get an instant paraphrase of this document with our AI Paraphraser
Document Page
Statistics
High-density Lipoprotein
Tukey HSDa
group N Subset for alpha = 0.05
1 2
Drug A 10 53.70
Control 10 58.70
Drug C 10 64.70
Drug B 10 68.60
Sig. .064 .202
Means for groups in homogeneous subsets are
displayed.
a. Uses Harmonic Mean Sample Size = 10.000.
Table 5. Source: Author
Table 4 and table 5 gives the means of LDL and HDL levels that are significantly
different. It can be observed that in LDL, drug A (M = 86.20) and drug C (M = 83.20) are
significantly different from drug B (M = 121.4) and control (M = 101.1). Also, in HDL, drug A
(M = 53.70) and control (M = 58.70) are significantly different from drug C (M = 64.70) and
drug B (M = 68.60).
PART A: REFLECTION
Going through this course has come along with so much knowledge. It has prepared me
well enough to be able to handle my dissertation. Since dissertation involve research work, data
analysis knowledge acquired so far in this course such as parametric and non-parametric tests
will come in handy in choosing which the type of test to employ in test statistics. The six step
hypothesis testing was also an important element of research that will help me. In summary, I
have learnt how to handle my dissertation, which tests to use when it comes to parametric and
non-parametric tests and 6 steps hypothesis tests.
However, this educative course should be blended with more practical in the computer
laboratory. For example, student should be allowed to interact with data analysis software SPSS
8 | P a g e
Document Page
Statistics
hands on. Other analysis software should also be made available in the unit so as to be able to
cater for different structures of data.
9 | P a g e
Document Page
Statistics
References
Sedgwick, P. (2014). Non-parametric statistical tests for two related groups. Saint Louis.
10 | P a g e
chevron_up_icon
1 out of 10
circle_padding
hide_on_mobile
zoom_out_icon
logo.png

Your All-in-One AI-Powered Toolkit for Academic Success.

Available 24*7 on WhatsApp / Email

[object Object]