Statistics Assignment: Statistical Analysis of Market Data and Report
VerifiedAdded on 2021/01/03
|21
|4859
|41
Homework Assignment
AI Summary
This statistics assignment presents a comprehensive analysis of market data using various statistical tools and techniques. The assignment begins with analyzing data for CSR Ltd and SFR Ltd, including stem-and-leaf diagrams, relative frequency histograms, and frequency polygons. It then moves on to a bar chart analysis of six listed companies in the material sector. Furthermore, the assignment delves into recommendations for investment based on fundamental analysis and expert advice. The second part of the assignment focuses on calculating descriptive statistics, such as mean, median, quartiles, standard deviation, and range, for apartment prices in different Australian cities, along with box and whisker plots. Probability calculations are also performed based on provided data. The assignment concludes with a discussion of recent trends in apartment prices and recommendations for investment based on the analysis.
STATISTICS
Paraphrase This Document
Need a fresh take? Get an instant paraphrase of this document with our AI Paraphraser
Table of Contents
QUESTION 1...................................................................................................................................1
(a) Data for CSR Ltd and SFR Ltd along with stem-and-leaf diagram using Excel..............1
(b) Construction of Relative frequency for CSR Ltd and frequency polygon for SFR Ltd:. .4
(c) Bar Chart for six listed companies in Material Sector according to market capital.........6
(d) Recommendations to invest in CSR Ltd or SFR Ltd. based on fundamental analysis and
expert advice...........................................................................................................................7
QUESTION 2...................................................................................................................................8
(a) Calculation of Mean, Median, first quartile, and third quartile of sold prices for each city
using excel..............................................................................................................................8
(b) Calculation of standard deviation, mean absolute deviation and range for each city using
excel........................................................................................................................................8
c) Box and Whisker Plot for the sold prices of each city.......................................................9
d) Recent trends in apartment prices in Australia..................................................................9
QUESTION 3.................................................................................................................................10
a) Calculation of probability that an employee in Australia.................................................11
b) Probability of male sale worker employed in Australia...................................................11
c) Probability of female employee working in part time of clerical and administrative workers
..............................................................................................................................................11
d) Ratio for total persons in 2013 between Owner managers of incorporated enterprises to
Owner managers of unincorporated enterprises...................................................................12
b) Professional......................................................................................................................14
QUESTION 4.................................................................................................................................14
b)...........................................................................................................................................14
QUESTION 5...................................................................................................................................1
CONCLUSION................................................................................................................................2
REFERENCES................................................................................................................................3
APPENDIX......................................................................................................................................4
QUESTION 1
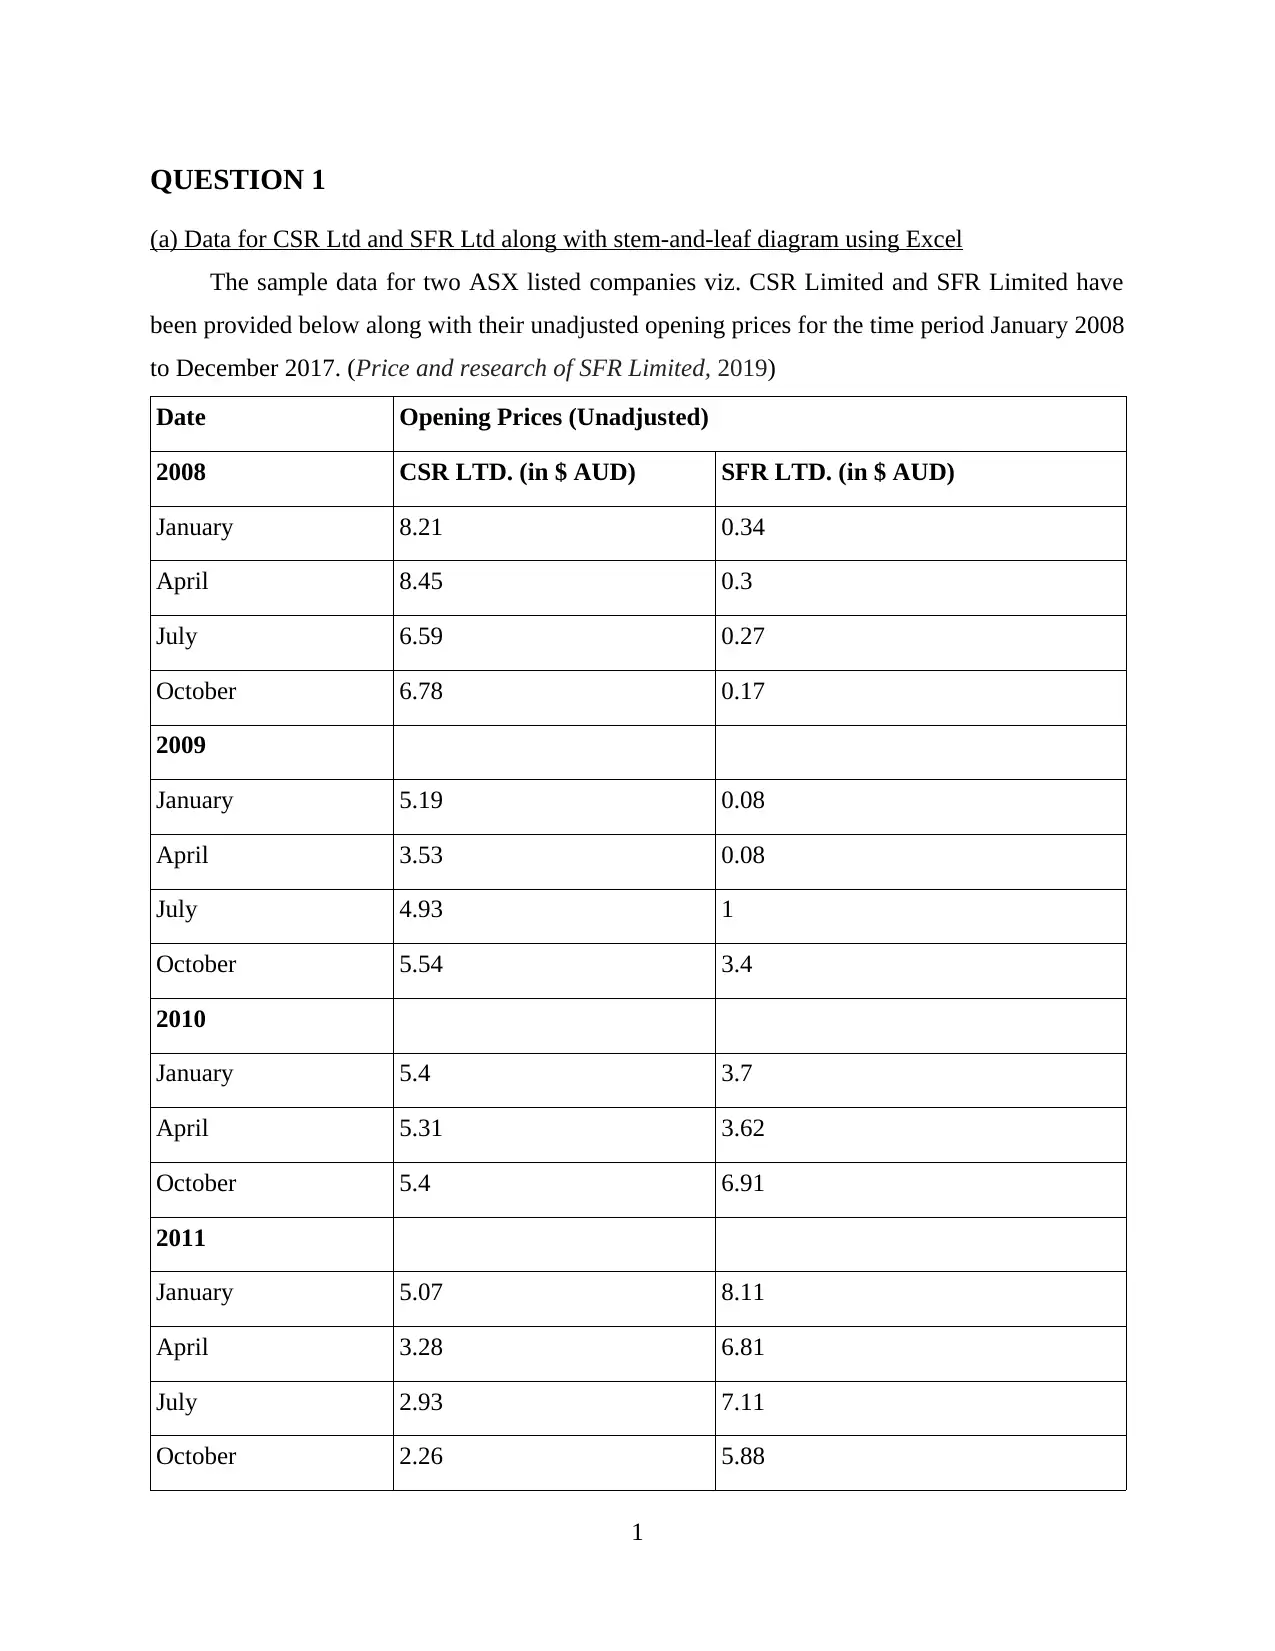
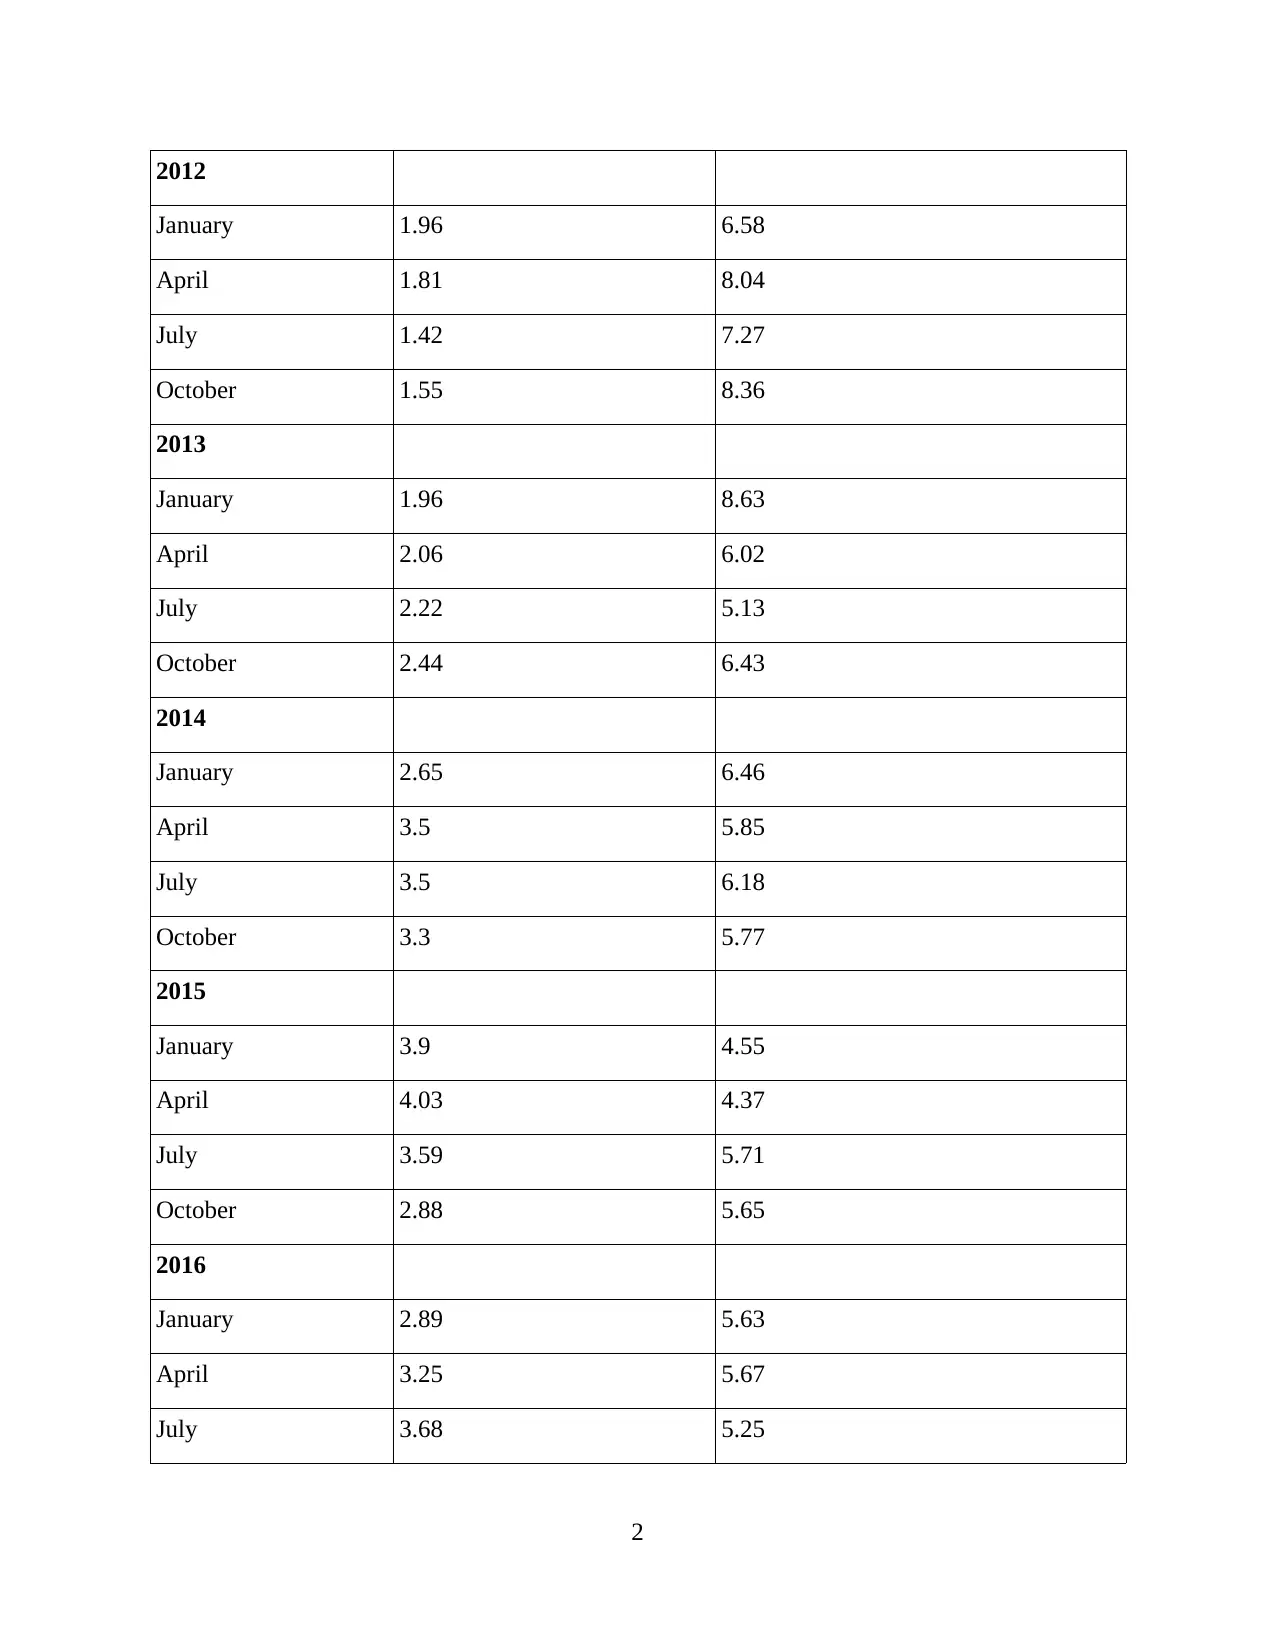
(a) Data for CSR Ltd and SFR Ltd along with stem-and-leaf diagram using Excel
The sample data for two ASX listed companies viz. CSR Limited and SFR Limited have
been provided below along with their unadjusted opening prices for the time period January 2008
to December 2017. (Price and research of SFR Limited, 2019)
Date Opening Prices (Unadjusted)
2008 CSR LTD. (in $ AUD) SFR LTD. (in $ AUD)
January 8.21 0.34
April 8.45 0.3
July 6.59 0.27
October 6.78 0.17
2009
January 5.19 0.08
April 3.53 0.08
July 4.93 1
October 5.54 3.4
2010
January 5.4 3.7
April 5.31 3.62
October 5.4 6.91
2011
January 5.07 8.11
April 3.28 6.81
July 2.93 7.11
October 2.26 5.88
1
⊘ This is a preview!⊘
Do you want full access?
Subscribe today to unlock all pages.
Trusted by 1+ million students worldwide
2012
January 1.96 6.58
April 1.81 8.04
July 1.42 7.27
October 1.55 8.36
2013
January 1.96 8.63
April 2.06 6.02
July 2.22 5.13
October 2.44 6.43
2014
January 2.65 6.46
April 3.5 5.85
July 3.5 6.18
October 3.3 5.77
2015
January 3.9 4.55
April 4.03 4.37
July 3.59 5.71
October 2.88 5.65
2016
January 2.89 5.63
April 3.25 5.67
July 3.68 5.25
2
Paraphrase This Document
Need a fresh take? Get an instant paraphrase of this document with our AI Paraphraser
October 3.65 5.08
2017
January 4.62 5.64
April 4.5 6.37
July 4.22 5.62
October 4.72 5.76
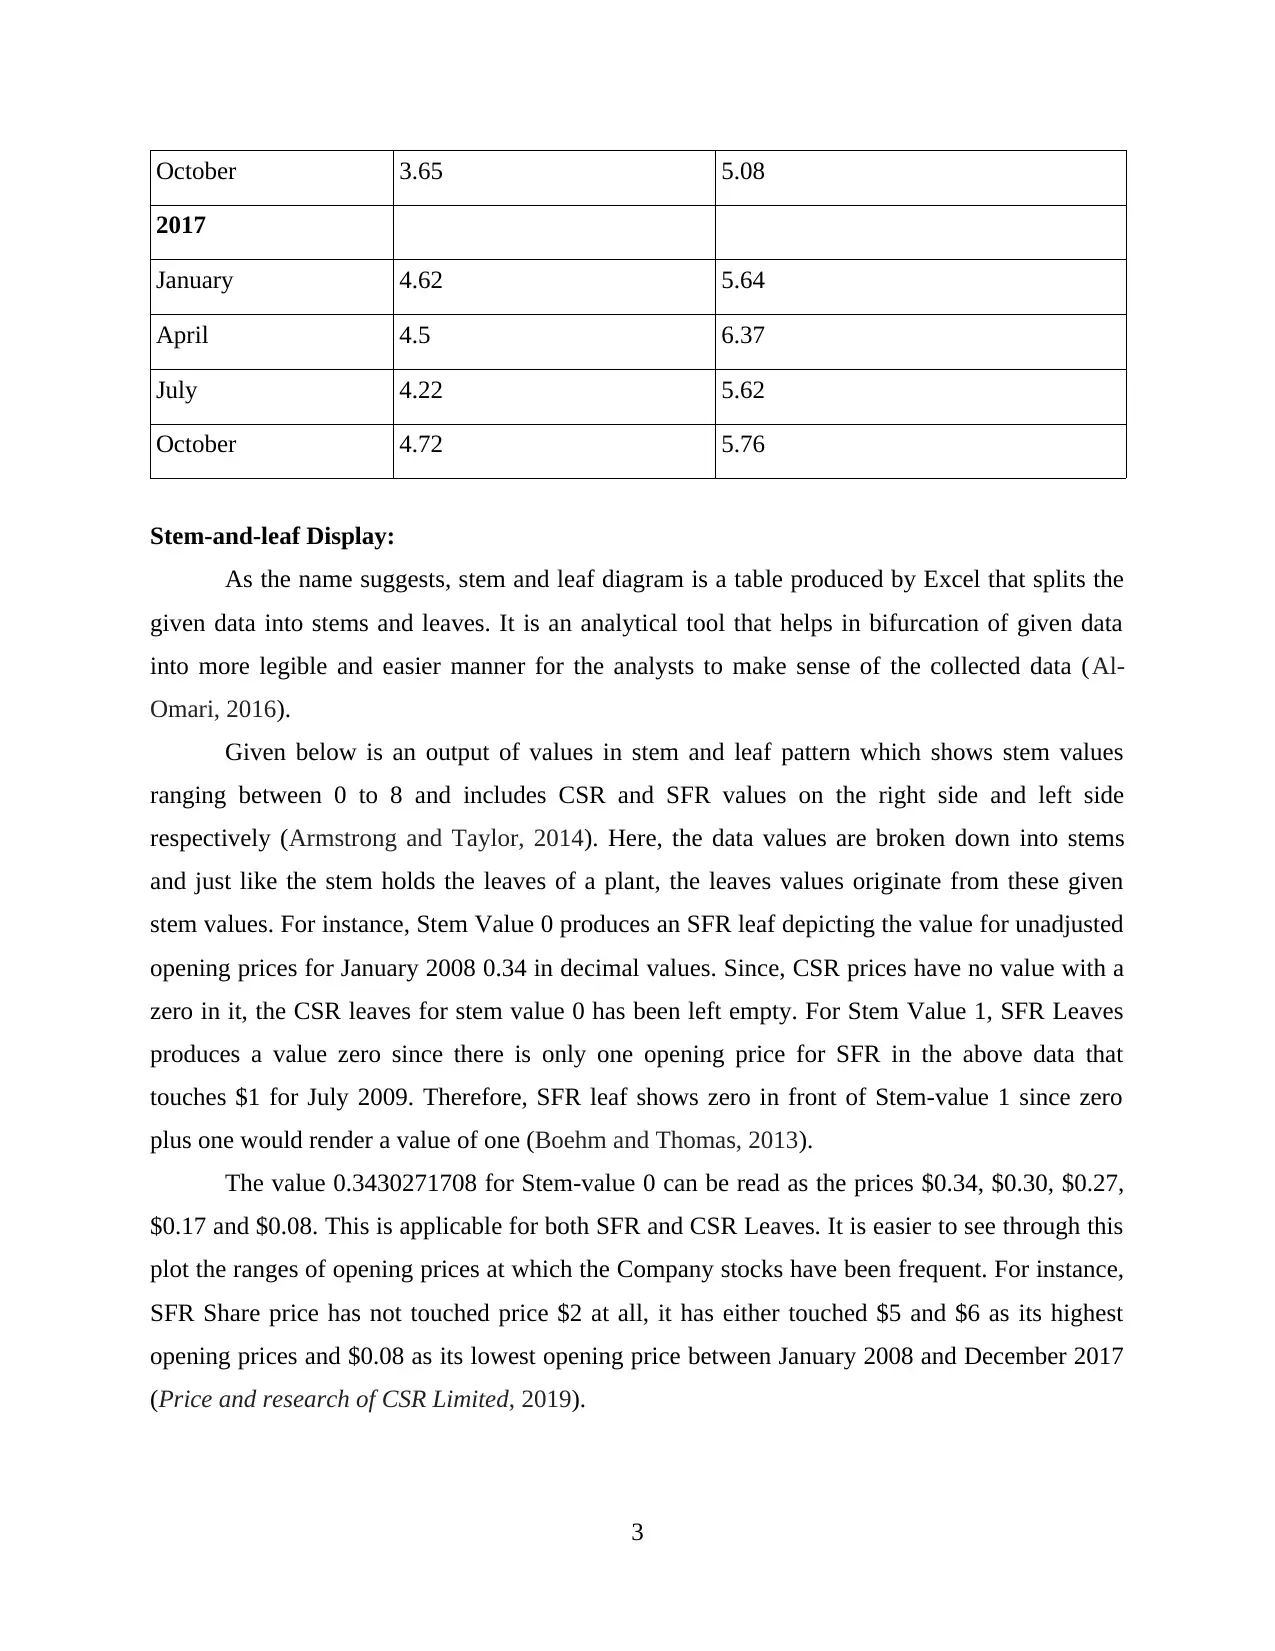
Stem-and-leaf Display:
As the name suggests, stem and leaf diagram is a table produced by Excel that splits the
given data into stems and leaves. It is an analytical tool that helps in bifurcation of given data
into more legible and easier manner for the analysts to make sense of the collected data (Al-
Omari, 2016).
Given below is an output of values in stem and leaf pattern which shows stem values
ranging between 0 to 8 and includes CSR and SFR values on the right side and left side
respectively (Armstrong and Taylor, 2014). Here, the data values are broken down into stems
and just like the stem holds the leaves of a plant, the leaves values originate from these given
stem values. For instance, Stem Value 0 produces an SFR leaf depicting the value for unadjusted
opening prices for January 2008 0.34 in decimal values. Since, CSR prices have no value with a
zero in it, the CSR leaves for stem value 0 has been left empty. For Stem Value 1, SFR Leaves
produces a value zero since there is only one opening price for SFR in the above data that
touches $1 for July 2009. Therefore, SFR leaf shows zero in front of Stem-value 1 since zero
plus one would render a value of one (Boehm and Thomas, 2013).
The value 0.3430271708 for Stem-value 0 can be read as the prices $0.34, $0.30, $0.27,
$0.17 and $0.08. This is applicable for both SFR and CSR Leaves. It is easier to see through this
plot the ranges of opening prices at which the Company stocks have been frequent. For instance,
SFR Share price has not touched price $2 at all, it has either touched $5 and $6 as its highest
opening prices and $0.08 as its lowest opening price between January 2008 and December 2017
(Price and research of CSR Limited, 2019).
3
2017
January 4.62 5.64
April 4.5 6.37
July 4.22 5.62
October 4.72 5.76
Stem-and-leaf Display:
As the name suggests, stem and leaf diagram is a table produced by Excel that splits the
given data into stems and leaves. It is an analytical tool that helps in bifurcation of given data
into more legible and easier manner for the analysts to make sense of the collected data (Al-
Omari, 2016).
Given below is an output of values in stem and leaf pattern which shows stem values
ranging between 0 to 8 and includes CSR and SFR values on the right side and left side
respectively (Armstrong and Taylor, 2014). Here, the data values are broken down into stems
and just like the stem holds the leaves of a plant, the leaves values originate from these given
stem values. For instance, Stem Value 0 produces an SFR leaf depicting the value for unadjusted
opening prices for January 2008 0.34 in decimal values. Since, CSR prices have no value with a
zero in it, the CSR leaves for stem value 0 has been left empty. For Stem Value 1, SFR Leaves
produces a value zero since there is only one opening price for SFR in the above data that
touches $1 for July 2009. Therefore, SFR leaf shows zero in front of Stem-value 1 since zero
plus one would render a value of one (Boehm and Thomas, 2013).
The value 0.3430271708 for Stem-value 0 can be read as the prices $0.34, $0.30, $0.27,
$0.17 and $0.08. This is applicable for both SFR and CSR Leaves. It is easier to see through this
plot the ranges of opening prices at which the Company stocks have been frequent. For instance,
SFR Share price has not touched price $2 at all, it has either touched $5 and $6 as its highest
opening prices and $0.08 as its lowest opening price between January 2008 and December 2017
(Price and research of CSR Limited, 2019).
3
SFR Leaves Stem CSR Leaves
0.3430271708 0
0 1 0.9681425596
2 0.9326062245
0.40706221 3 0.5328553959
0.5537 4 0.9398036252
0.8813857772 5 0.1954431407
0.9181580243 6 0.5978
0.1127 7
0.11043663 8 0.2145
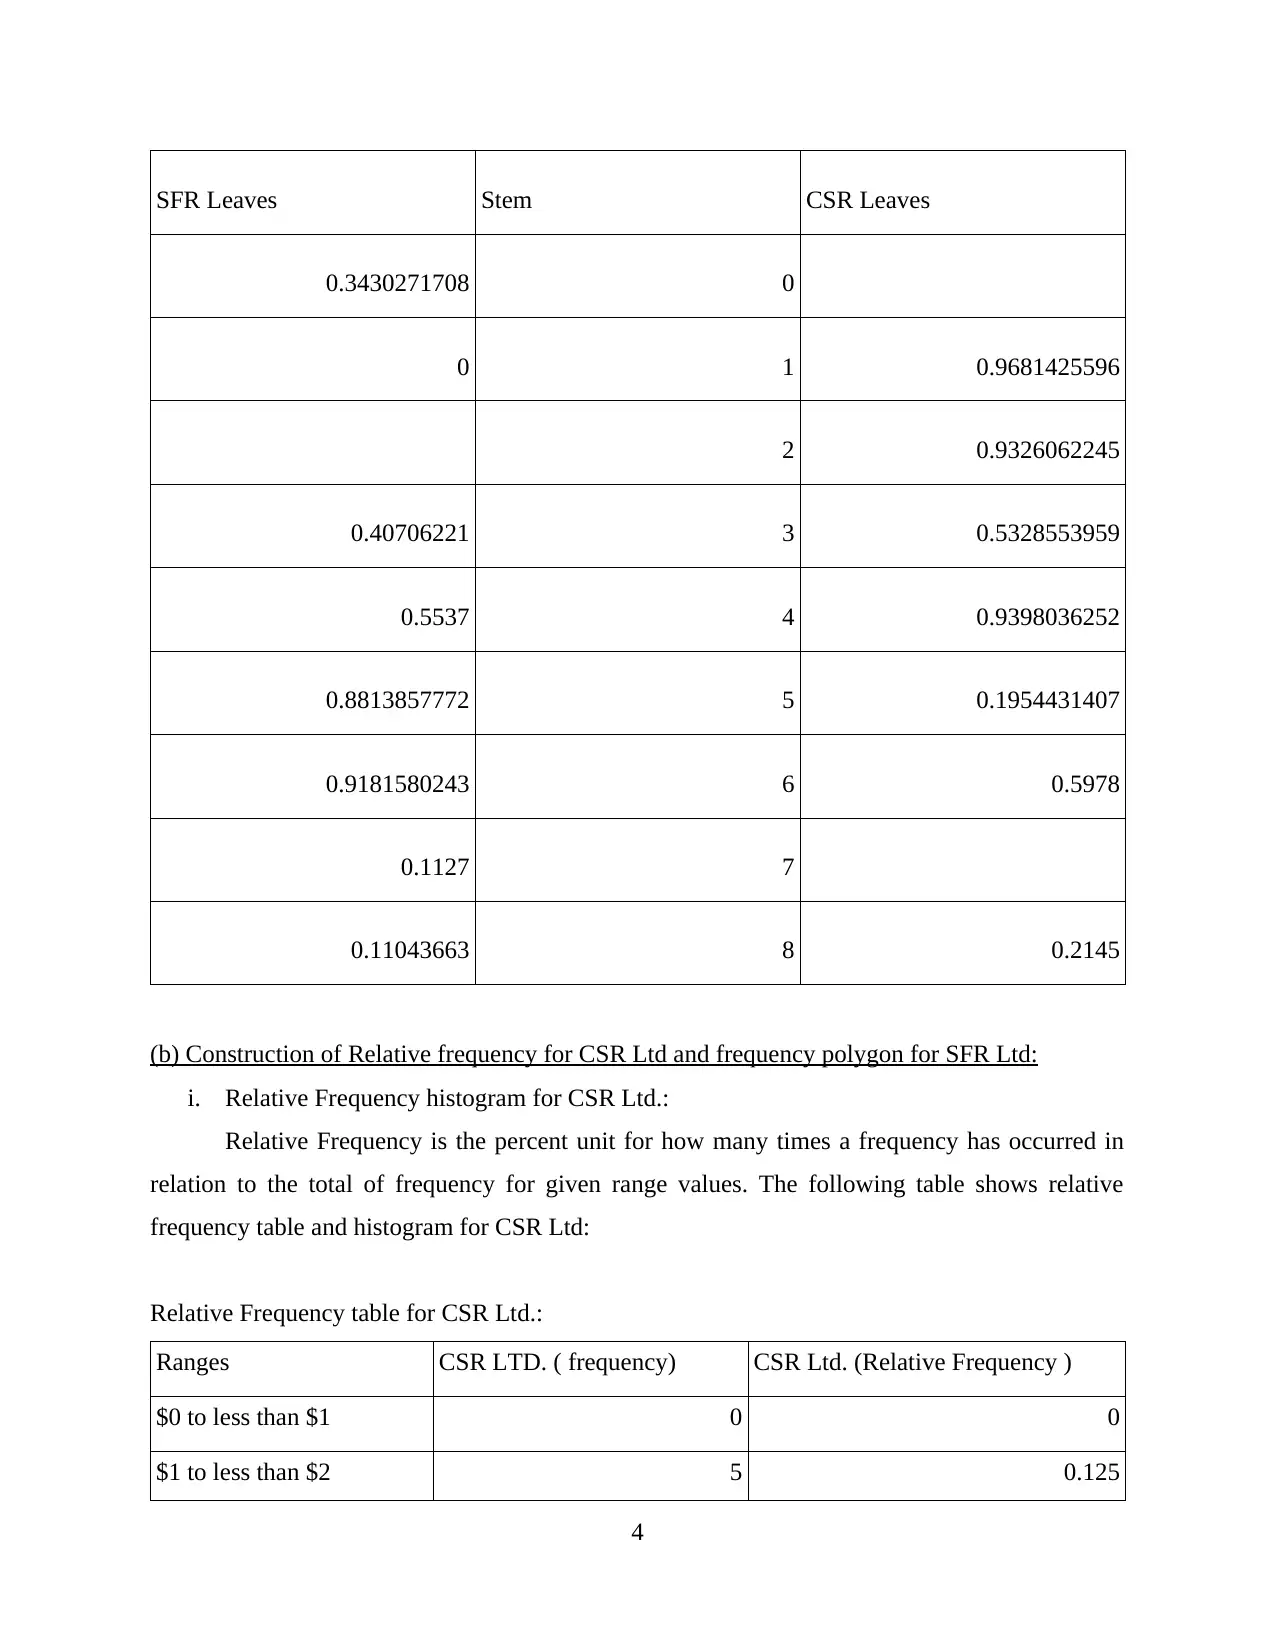
(b) Construction of Relative frequency for CSR Ltd and frequency polygon for SFR Ltd:
i. Relative Frequency histogram for CSR Ltd.:
Relative Frequency is the percent unit for how many times a frequency has occurred in
relation to the total of frequency for given range values. The following table shows relative
frequency table and histogram for CSR Ltd:
Relative Frequency table for CSR Ltd.:
Ranges CSR LTD. ( frequency) CSR Ltd. (Relative Frequency )
$0 to less than $1 0 0
$1 to less than $2 5 0.125
4
0.3430271708 0
0 1 0.9681425596
2 0.9326062245
0.40706221 3 0.5328553959
0.5537 4 0.9398036252
0.8813857772 5 0.1954431407
0.9181580243 6 0.5978
0.1127 7
0.11043663 8 0.2145
(b) Construction of Relative frequency for CSR Ltd and frequency polygon for SFR Ltd:
i. Relative Frequency histogram for CSR Ltd.:
Relative Frequency is the percent unit for how many times a frequency has occurred in
relation to the total of frequency for given range values. The following table shows relative
frequency table and histogram for CSR Ltd:
Relative Frequency table for CSR Ltd.:
Ranges CSR LTD. ( frequency) CSR Ltd. (Relative Frequency )
$0 to less than $1 0 0
$1 to less than $2 5 0.125
4
⊘ This is a preview!⊘
Do you want full access?
Subscribe today to unlock all pages.
Trusted by 1+ million students worldwide
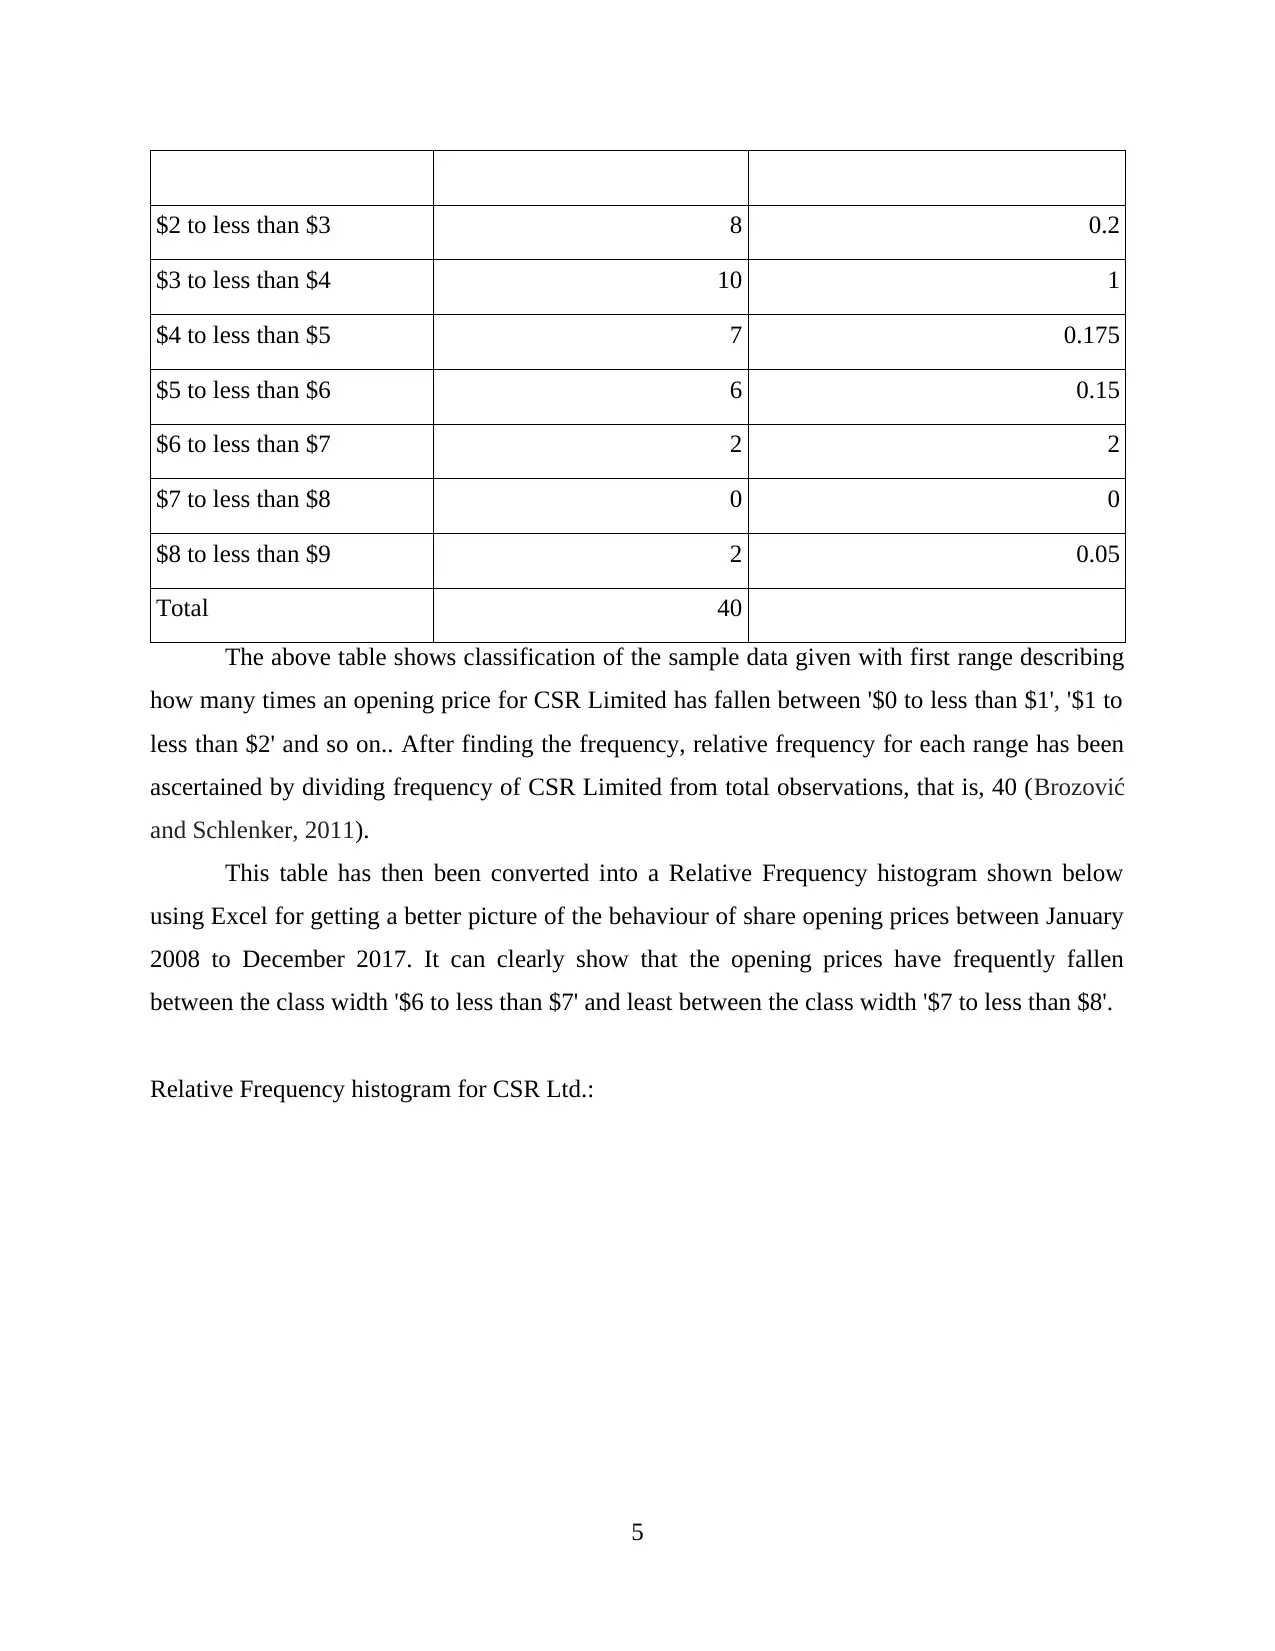
$2 to less than $3 8 0.2
$3 to less than $4 10 1
$4 to less than $5 7 0.175
$5 to less than $6 6 0.15
$6 to less than $7 2 2
$7 to less than $8 0 0
$8 to less than $9 2 0.05
Total 40
The above table shows classification of the sample data given with first range describing
how many times an opening price for CSR Limited has fallen between '$0 to less than $1', '$1 to
less than $2' and so on.. After finding the frequency, relative frequency for each range has been
ascertained by dividing frequency of CSR Limited from total observations, that is, 40 (Brozović
and Schlenker, 2011).
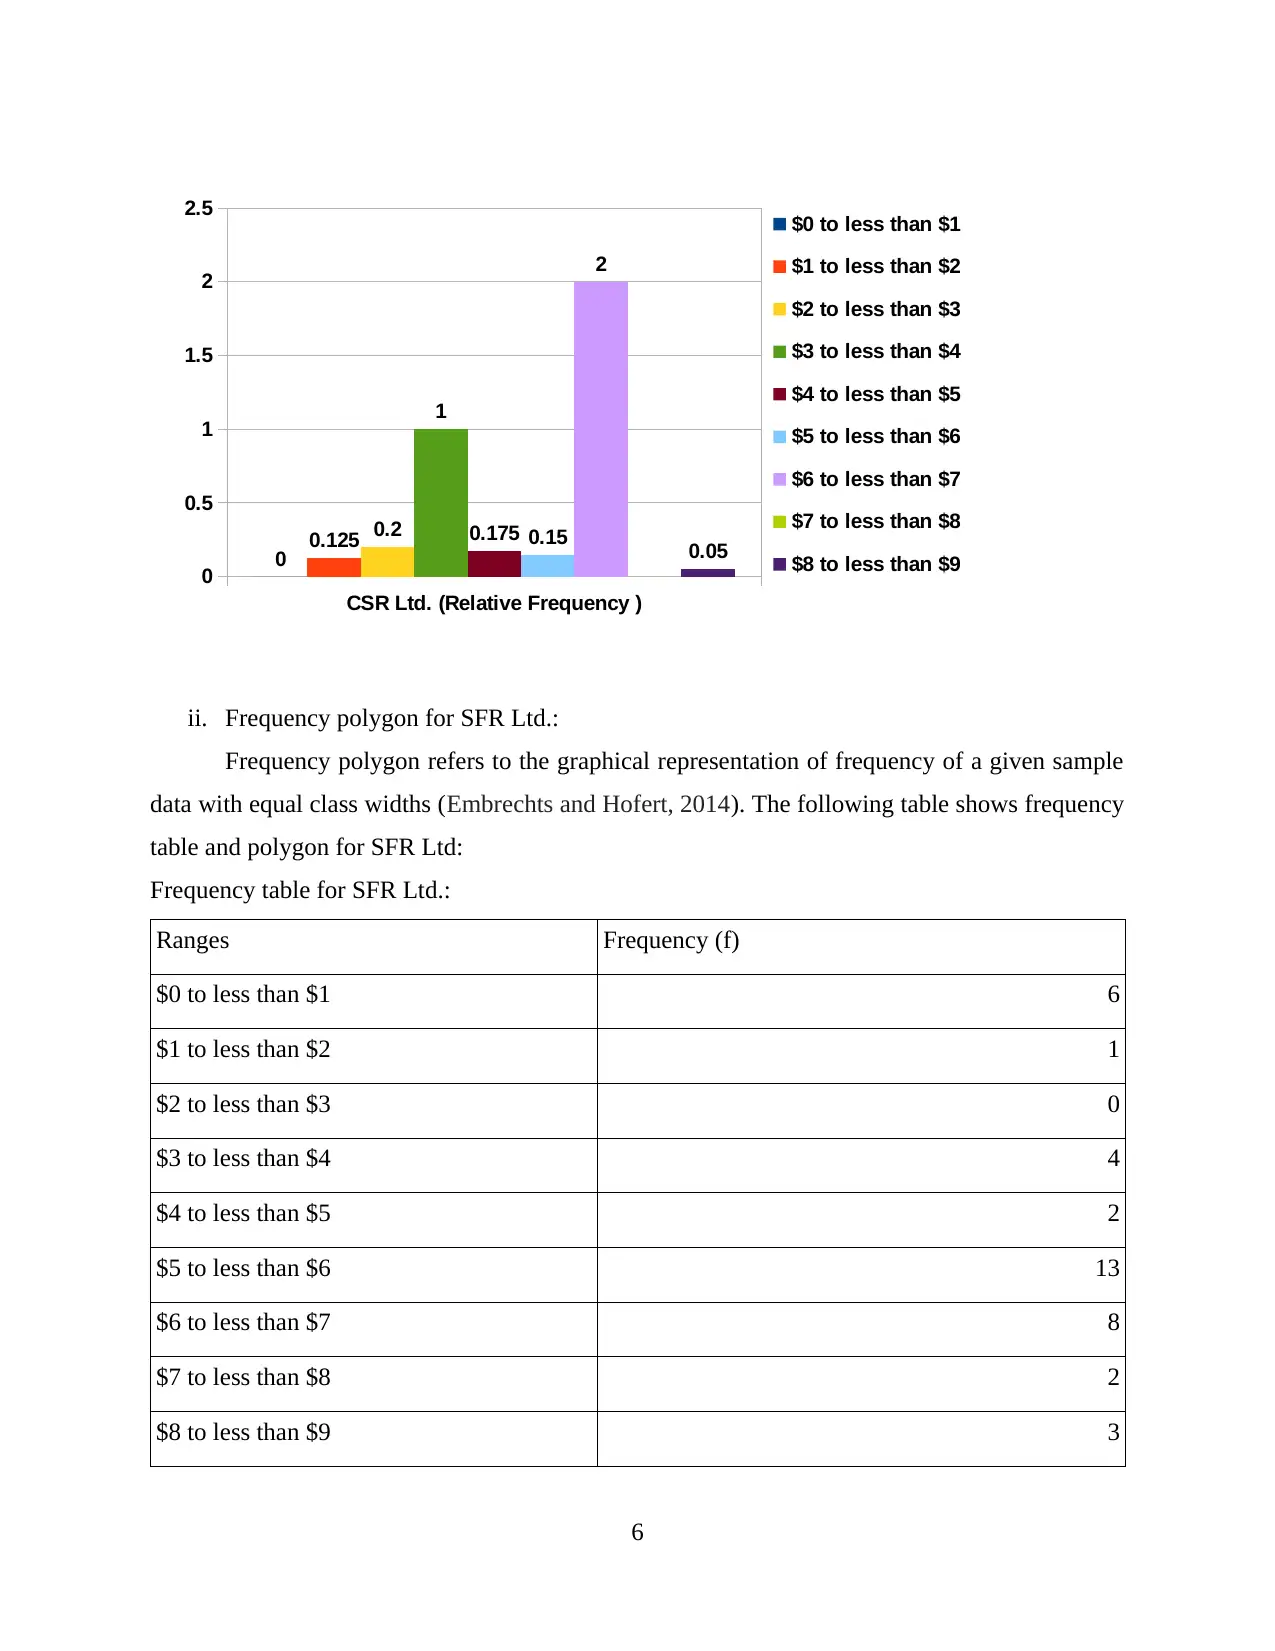
This table has then been converted into a Relative Frequency histogram shown below
using Excel for getting a better picture of the behaviour of share opening prices between January
2008 to December 2017. It can clearly show that the opening prices have frequently fallen
between the class width '$6 to less than $7' and least between the class width '$7 to less than $8'.
Relative Frequency histogram for CSR Ltd.:
5
$3 to less than $4 10 1
$4 to less than $5 7 0.175
$5 to less than $6 6 0.15
$6 to less than $7 2 2
$7 to less than $8 0 0
$8 to less than $9 2 0.05
Total 40
The above table shows classification of the sample data given with first range describing
how many times an opening price for CSR Limited has fallen between '$0 to less than $1', '$1 to
less than $2' and so on.. After finding the frequency, relative frequency for each range has been
ascertained by dividing frequency of CSR Limited from total observations, that is, 40 (Brozović
and Schlenker, 2011).
This table has then been converted into a Relative Frequency histogram shown below
using Excel for getting a better picture of the behaviour of share opening prices between January
2008 to December 2017. It can clearly show that the opening prices have frequently fallen
between the class width '$6 to less than $7' and least between the class width '$7 to less than $8'.
Relative Frequency histogram for CSR Ltd.:
5
Paraphrase This Document
Need a fresh take? Get an instant paraphrase of this document with our AI Paraphraser
CSR Ltd. (Relative Frequency )
0
0.5
1
1.5
2
2.5
0 0.125 0.2
1
0.175 0.15
2
0.05
$0 to less than $1
$1 to less than $2
$2 to less than $3
$3 to less than $4
$4 to less than $5
$5 to less than $6
$6 to less than $7
$7 to less than $8
$8 to less than $9
ii. Frequency polygon for SFR Ltd.:
Frequency polygon refers to the graphical representation of frequency of a given sample
data with equal class widths (Embrechts and Hofert, 2014). The following table shows frequency
table and polygon for SFR Ltd:
Frequency table for SFR Ltd.:
Ranges Frequency (f)
$0 to less than $1 6
$1 to less than $2 1
$2 to less than $3 0
$3 to less than $4 4
$4 to less than $5 2
$5 to less than $6 13
$6 to less than $7 8
$7 to less than $8 2
$8 to less than $9 3
6
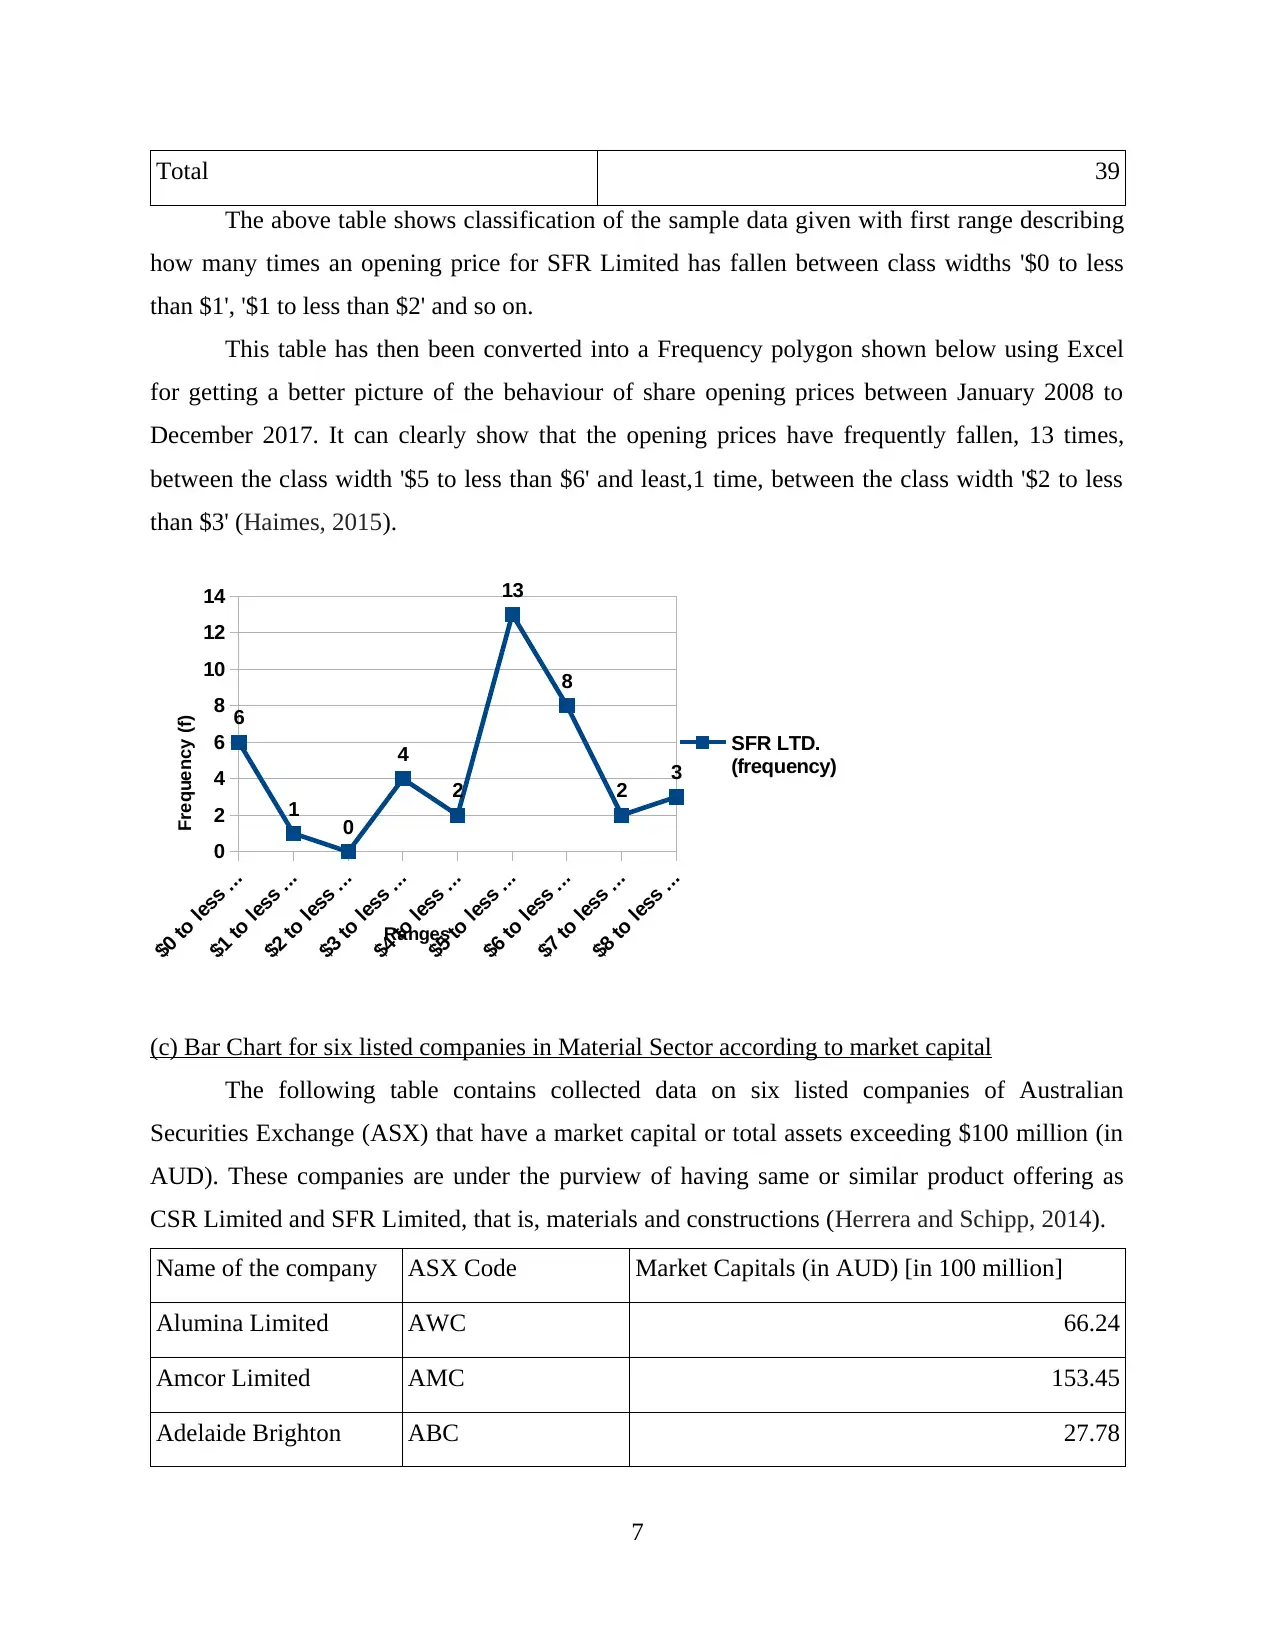
Total 39
The above table shows classification of the sample data given with first range describing
how many times an opening price for SFR Limited has fallen between class widths '$0 to less
than $1', '$1 to less than $2' and so on.
This table has then been converted into a Frequency polygon shown below using Excel
for getting a better picture of the behaviour of share opening prices between January 2008 to
December 2017. It can clearly show that the opening prices have frequently fallen, 13 times,
between the class width '$5 to less than $6' and least,1 time, between the class width '$2 to less
than $3' (Haimes, 2015).
$0 to less ...
$1 to less ...
$2 to less ...
$3 to less ...
$4 to less ...
$5 to less ...
$6 to less ...
$7 to less ...
$8 to less ...
0
2
4
6
8
10
12
14
6
1 0
4
2
13
8
2 3
SFR LTD.
(frequency)
Ranges
Frequency (f)
(c) Bar Chart for six listed companies in Material Sector according to market capital
The following table contains collected data on six listed companies of Australian
Securities Exchange (ASX) that have a market capital or total assets exceeding $100 million (in
AUD). These companies are under the purview of having same or similar product offering as
CSR Limited and SFR Limited, that is, materials and constructions (Herrera and Schipp, 2014).
Name of the company ASX Code Market Capitals (in AUD) [in 100 million]
Alumina Limited AWC 66.24
Amcor Limited AMC 153.45
Adelaide Brighton ABC 27.78
7
⊘ This is a preview!⊘
Do you want full access?
Subscribe today to unlock all pages.
Trusted by 1+ million students worldwide
Ausdrill Limited ASL 8.13
BHP Group Limited BHP 1008.36
Bluescope Steel
Limited BSL 58.6
0 200 400 600 800 1000 1200
66.2364
153.454
27.7811
8.12831
1008.36
58.5986
Bluescope Steel
Limited
BHP Group Limited
Ausdrill Limited
Adelaide Brighton
Amcor Limited
Alumina Limited
Market Capital (in 100 Mil.)
Company
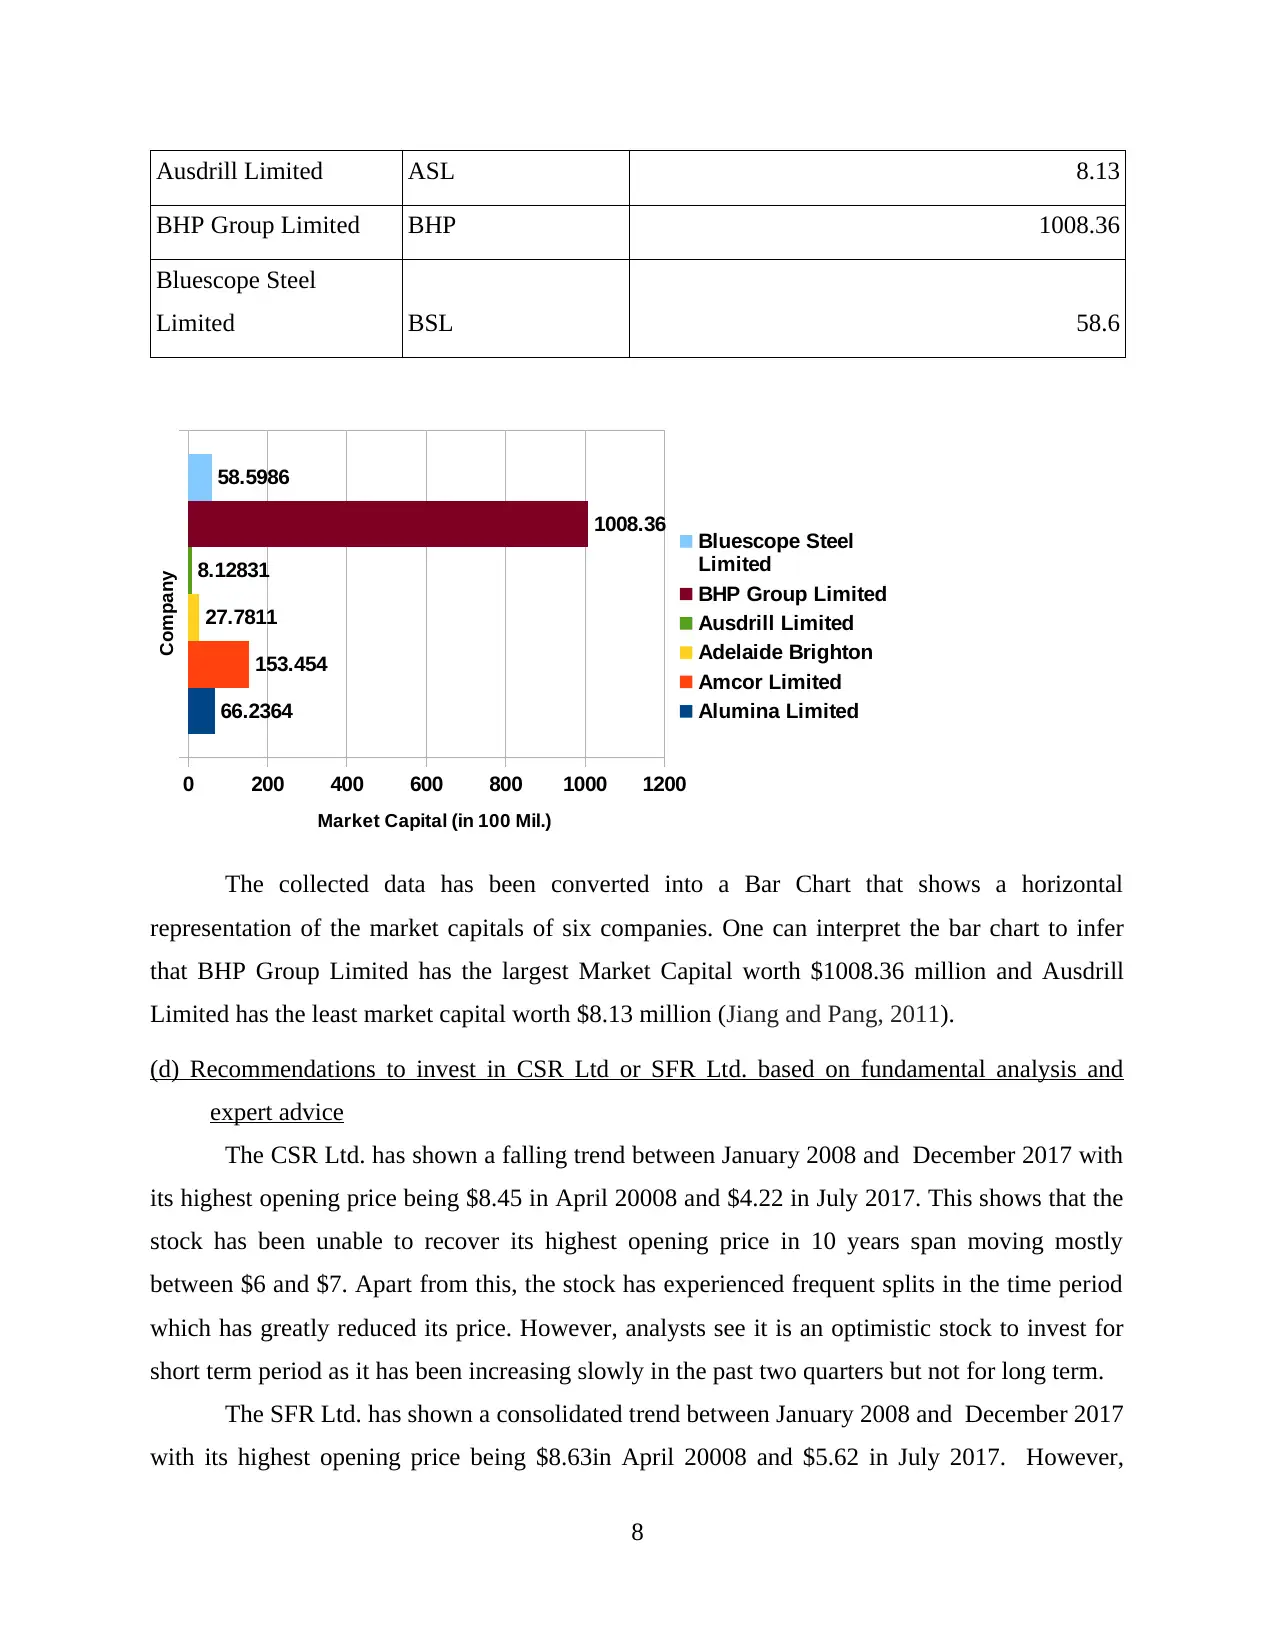
The collected data has been converted into a Bar Chart that shows a horizontal
representation of the market capitals of six companies. One can interpret the bar chart to infer
that BHP Group Limited has the largest Market Capital worth $1008.36 million and Ausdrill
Limited has the least market capital worth $8.13 million (Jiang and Pang, 2011).
(d) Recommendations to invest in CSR Ltd or SFR Ltd. based on fundamental analysis and
expert advice
The CSR Ltd. has shown a falling trend between January 2008 and December 2017 with
its highest opening price being $8.45 in April 20008 and $4.22 in July 2017. This shows that the
stock has been unable to recover its highest opening price in 10 years span moving mostly
between $6 and $7. Apart from this, the stock has experienced frequent splits in the time period
which has greatly reduced its price. However, analysts see it is an optimistic stock to invest for
short term period as it has been increasing slowly in the past two quarters but not for long term.
The SFR Ltd. has shown a consolidated trend between January 2008 and December 2017
with its highest opening price being $8.63in April 20008 and $5.62 in July 2017. However,
8
BHP Group Limited BHP 1008.36
Bluescope Steel
Limited BSL 58.6
0 200 400 600 800 1000 1200
66.2364
153.454
27.7811
8.12831
1008.36
58.5986
Bluescope Steel
Limited
BHP Group Limited
Ausdrill Limited
Adelaide Brighton
Amcor Limited
Alumina Limited
Market Capital (in 100 Mil.)
Company
The collected data has been converted into a Bar Chart that shows a horizontal
representation of the market capitals of six companies. One can interpret the bar chart to infer
that BHP Group Limited has the largest Market Capital worth $1008.36 million and Ausdrill
Limited has the least market capital worth $8.13 million (Jiang and Pang, 2011).
(d) Recommendations to invest in CSR Ltd or SFR Ltd. based on fundamental analysis and
expert advice
The CSR Ltd. has shown a falling trend between January 2008 and December 2017 with
its highest opening price being $8.45 in April 20008 and $4.22 in July 2017. This shows that the
stock has been unable to recover its highest opening price in 10 years span moving mostly
between $6 and $7. Apart from this, the stock has experienced frequent splits in the time period
which has greatly reduced its price. However, analysts see it is an optimistic stock to invest for
short term period as it has been increasing slowly in the past two quarters but not for long term.
The SFR Ltd. has shown a consolidated trend between January 2008 and December 2017
with its highest opening price being $8.63in April 20008 and $5.62 in July 2017. However,
8
Paraphrase This Document
Need a fresh take? Get an instant paraphrase of this document with our AI Paraphraser
analysts see it is not an optimistic stock to invest since it has been a consolidated phase for a very
long period (Kyriakarakos and et. al., 2013).
QUESTION 2
(a) Calculation of Mean, Median, first quartile, and third quartile of sold prices for each city
using excel
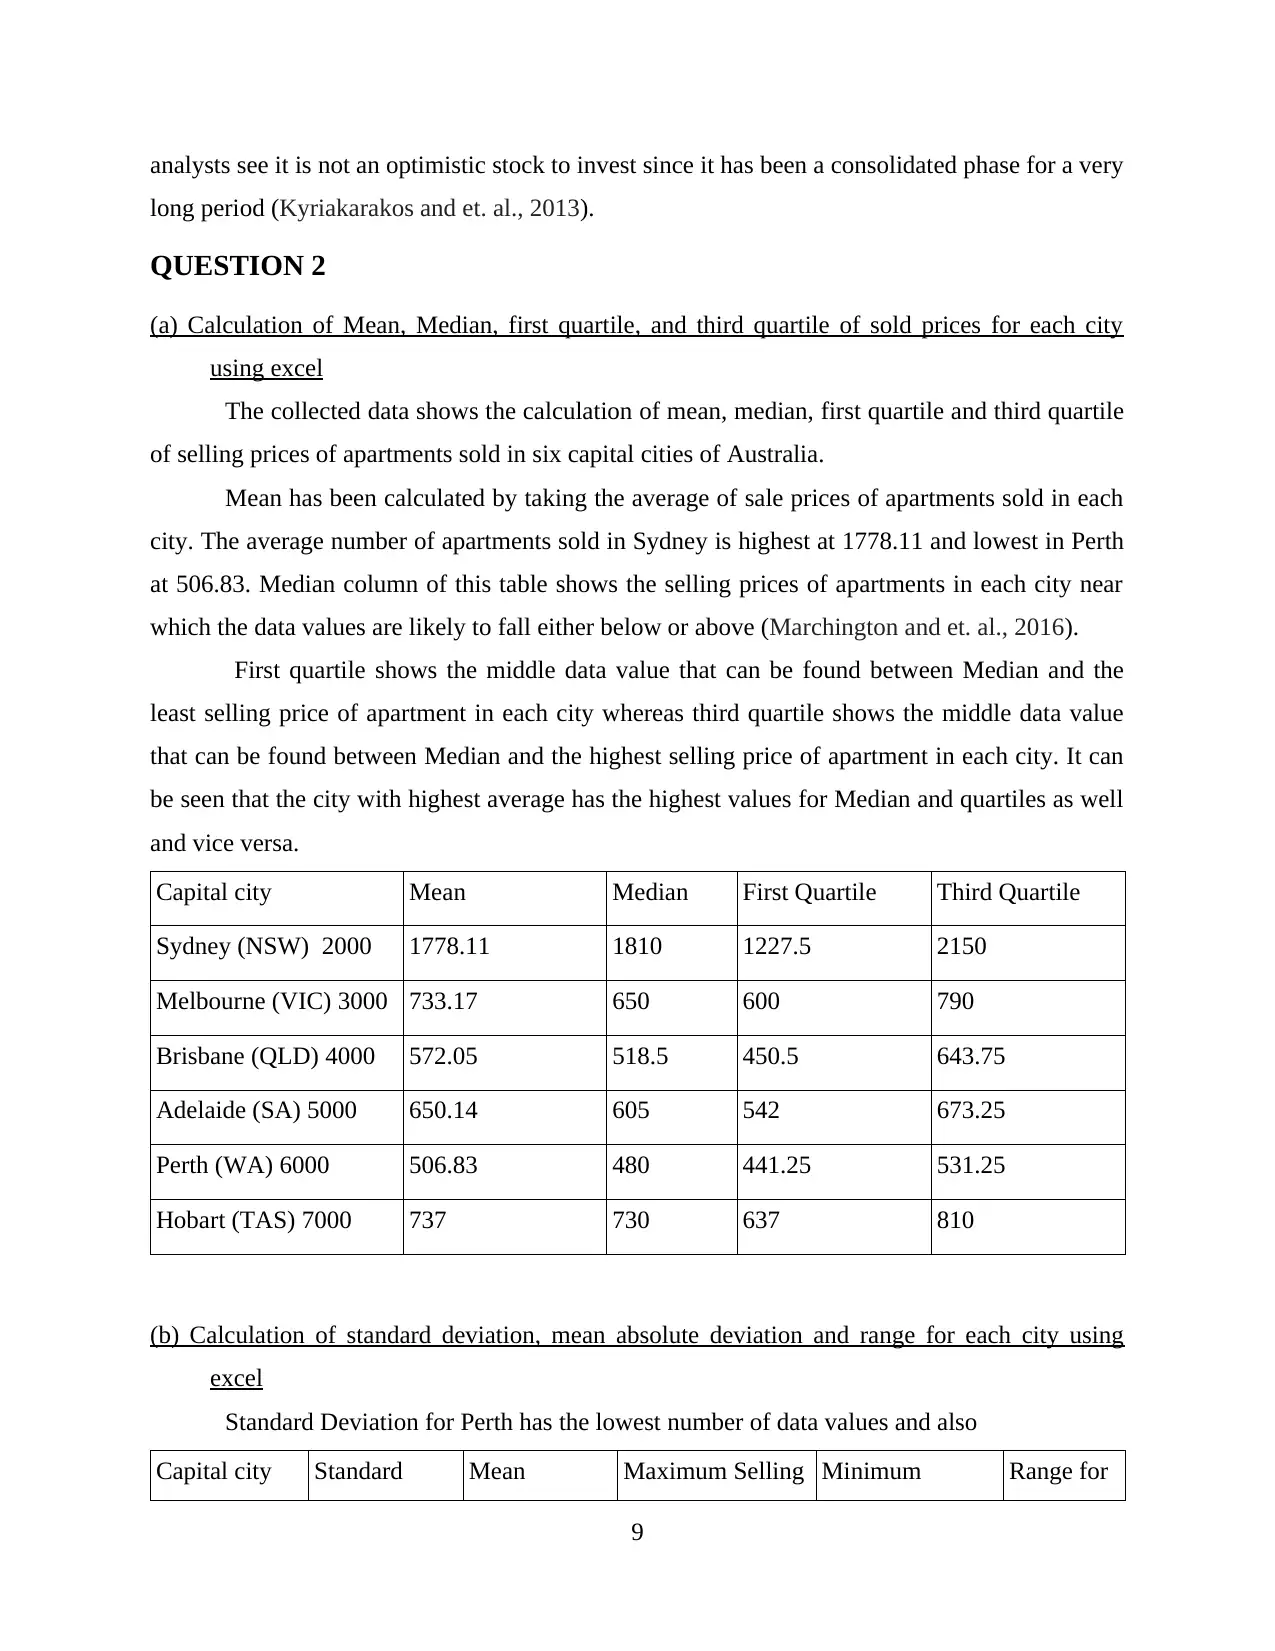
The collected data shows the calculation of mean, median, first quartile and third quartile
of selling prices of apartments sold in six capital cities of Australia.
Mean has been calculated by taking the average of sale prices of apartments sold in each
city. The average number of apartments sold in Sydney is highest at 1778.11 and lowest in Perth
at 506.83. Median column of this table shows the selling prices of apartments in each city near
which the data values are likely to fall either below or above (Marchington and et. al., 2016).
First quartile shows the middle data value that can be found between Median and the
least selling price of apartment in each city whereas third quartile shows the middle data value
that can be found between Median and the highest selling price of apartment in each city. It can
be seen that the city with highest average has the highest values for Median and quartiles as well
and vice versa.
Capital city Mean Median First Quartile Third Quartile
Sydney (NSW) 2000 1778.11 1810 1227.5 2150
Melbourne (VIC) 3000 733.17 650 600 790
Brisbane (QLD) 4000 572.05 518.5 450.5 643.75
Adelaide (SA) 5000 650.14 605 542 673.25
Perth (WA) 6000 506.83 480 441.25 531.25
Hobart (TAS) 7000 737 730 637 810
(b) Calculation of standard deviation, mean absolute deviation and range for each city using
excel
Standard Deviation for Perth has the lowest number of data values and also
Capital city Standard Mean Maximum Selling Minimum Range for
9
long period (Kyriakarakos and et. al., 2013).
QUESTION 2
(a) Calculation of Mean, Median, first quartile, and third quartile of sold prices for each city
using excel
The collected data shows the calculation of mean, median, first quartile and third quartile
of selling prices of apartments sold in six capital cities of Australia.
Mean has been calculated by taking the average of sale prices of apartments sold in each
city. The average number of apartments sold in Sydney is highest at 1778.11 and lowest in Perth
at 506.83. Median column of this table shows the selling prices of apartments in each city near
which the data values are likely to fall either below or above (Marchington and et. al., 2016).
First quartile shows the middle data value that can be found between Median and the
least selling price of apartment in each city whereas third quartile shows the middle data value
that can be found between Median and the highest selling price of apartment in each city. It can
be seen that the city with highest average has the highest values for Median and quartiles as well
and vice versa.
Capital city Mean Median First Quartile Third Quartile
Sydney (NSW) 2000 1778.11 1810 1227.5 2150
Melbourne (VIC) 3000 733.17 650 600 790
Brisbane (QLD) 4000 572.05 518.5 450.5 643.75
Adelaide (SA) 5000 650.14 605 542 673.25
Perth (WA) 6000 506.83 480 441.25 531.25
Hobart (TAS) 7000 737 730 637 810
(b) Calculation of standard deviation, mean absolute deviation and range for each city using
excel
Standard Deviation for Perth has the lowest number of data values and also
Capital city Standard Mean Maximum Selling Minimum Range for
9
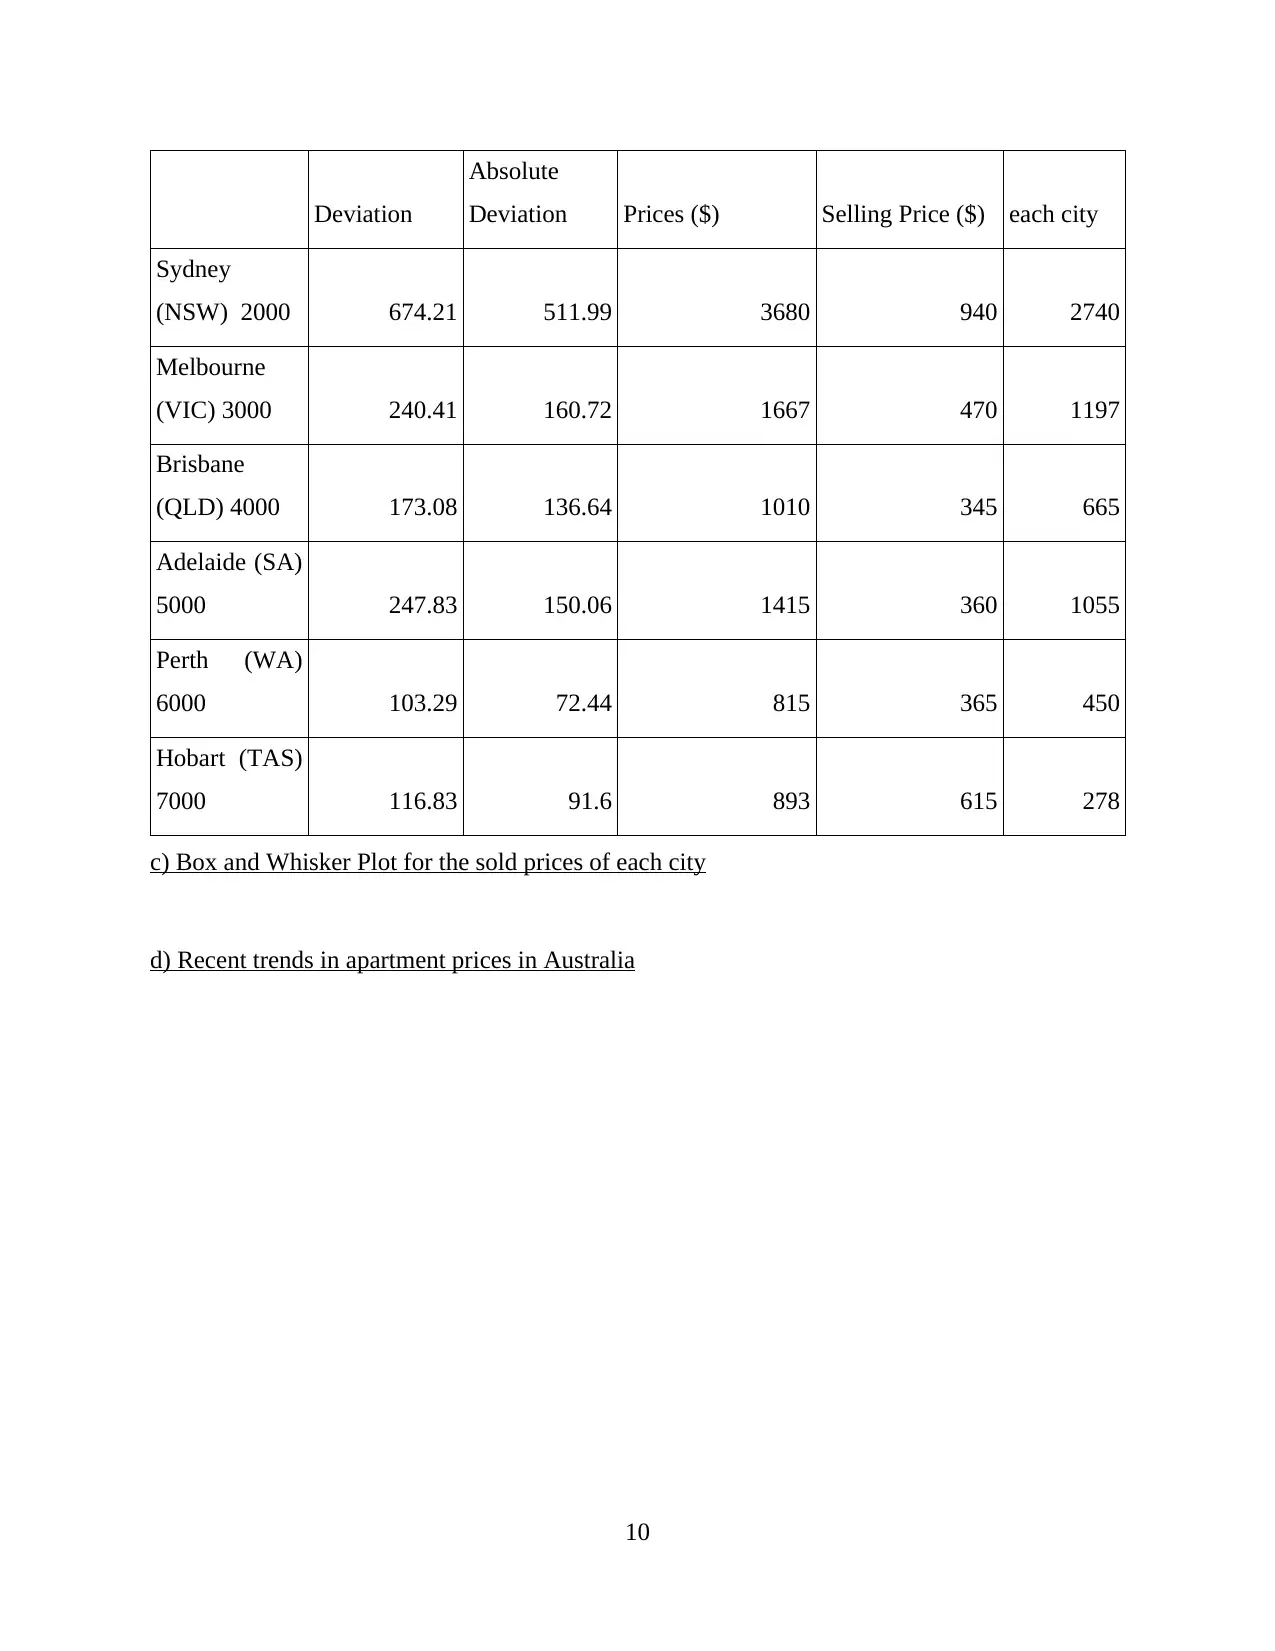
Deviation
Absolute
Deviation Prices ($) Selling Price ($) each city
Sydney
(NSW) 2000 674.21 511.99 3680 940 2740
Melbourne
(VIC) 3000 240.41 160.72 1667 470 1197
Brisbane
(QLD) 4000 173.08 136.64 1010 345 665
Adelaide (SA)
5000 247.83 150.06 1415 360 1055
Perth (WA)
6000 103.29 72.44 815 365 450
Hobart (TAS)
7000 116.83 91.6 893 615 278
c) Box and Whisker Plot for the sold prices of each city
d) Recent trends in apartment prices in Australia
10
⊘ This is a preview!⊘
Do you want full access?
Subscribe today to unlock all pages.
Trusted by 1+ million students worldwide
1 out of 21
Related Documents


Your All-in-One AI-Powered Toolkit for Academic Success.
+13062052269
info@desklib.com
Available 24*7 on WhatsApp / Email
![[object Object]](/_next/static/media/star-bottom.7253800d.svg)
Unlock your academic potential
Copyright © 2020–2026 A2Z Services. All Rights Reserved. Developed and managed by ZUCOL.