Statistics Assignment: Data Analysis and Probability Calculations

Verified

Added on  2023/06/12

|10
|1137
|476
Homework Assignment
AI Summary
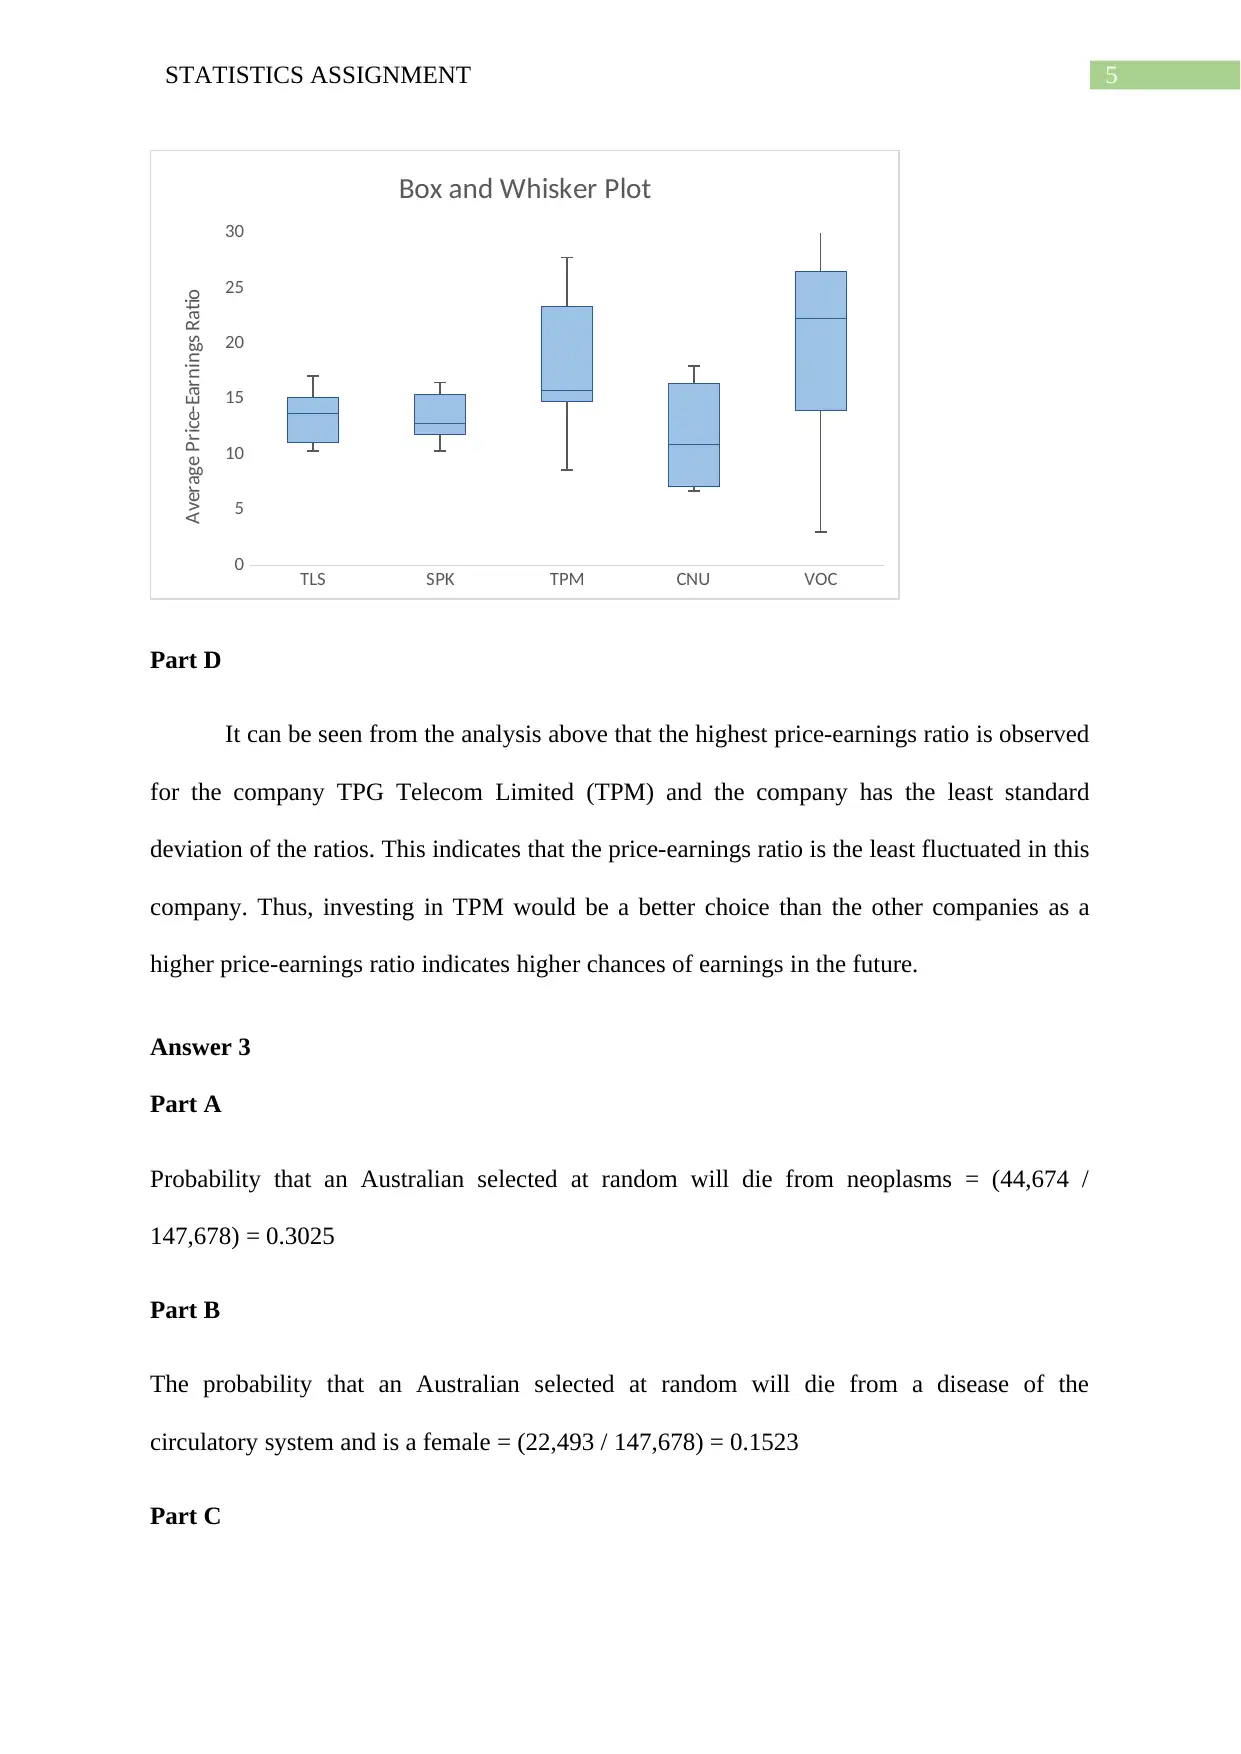
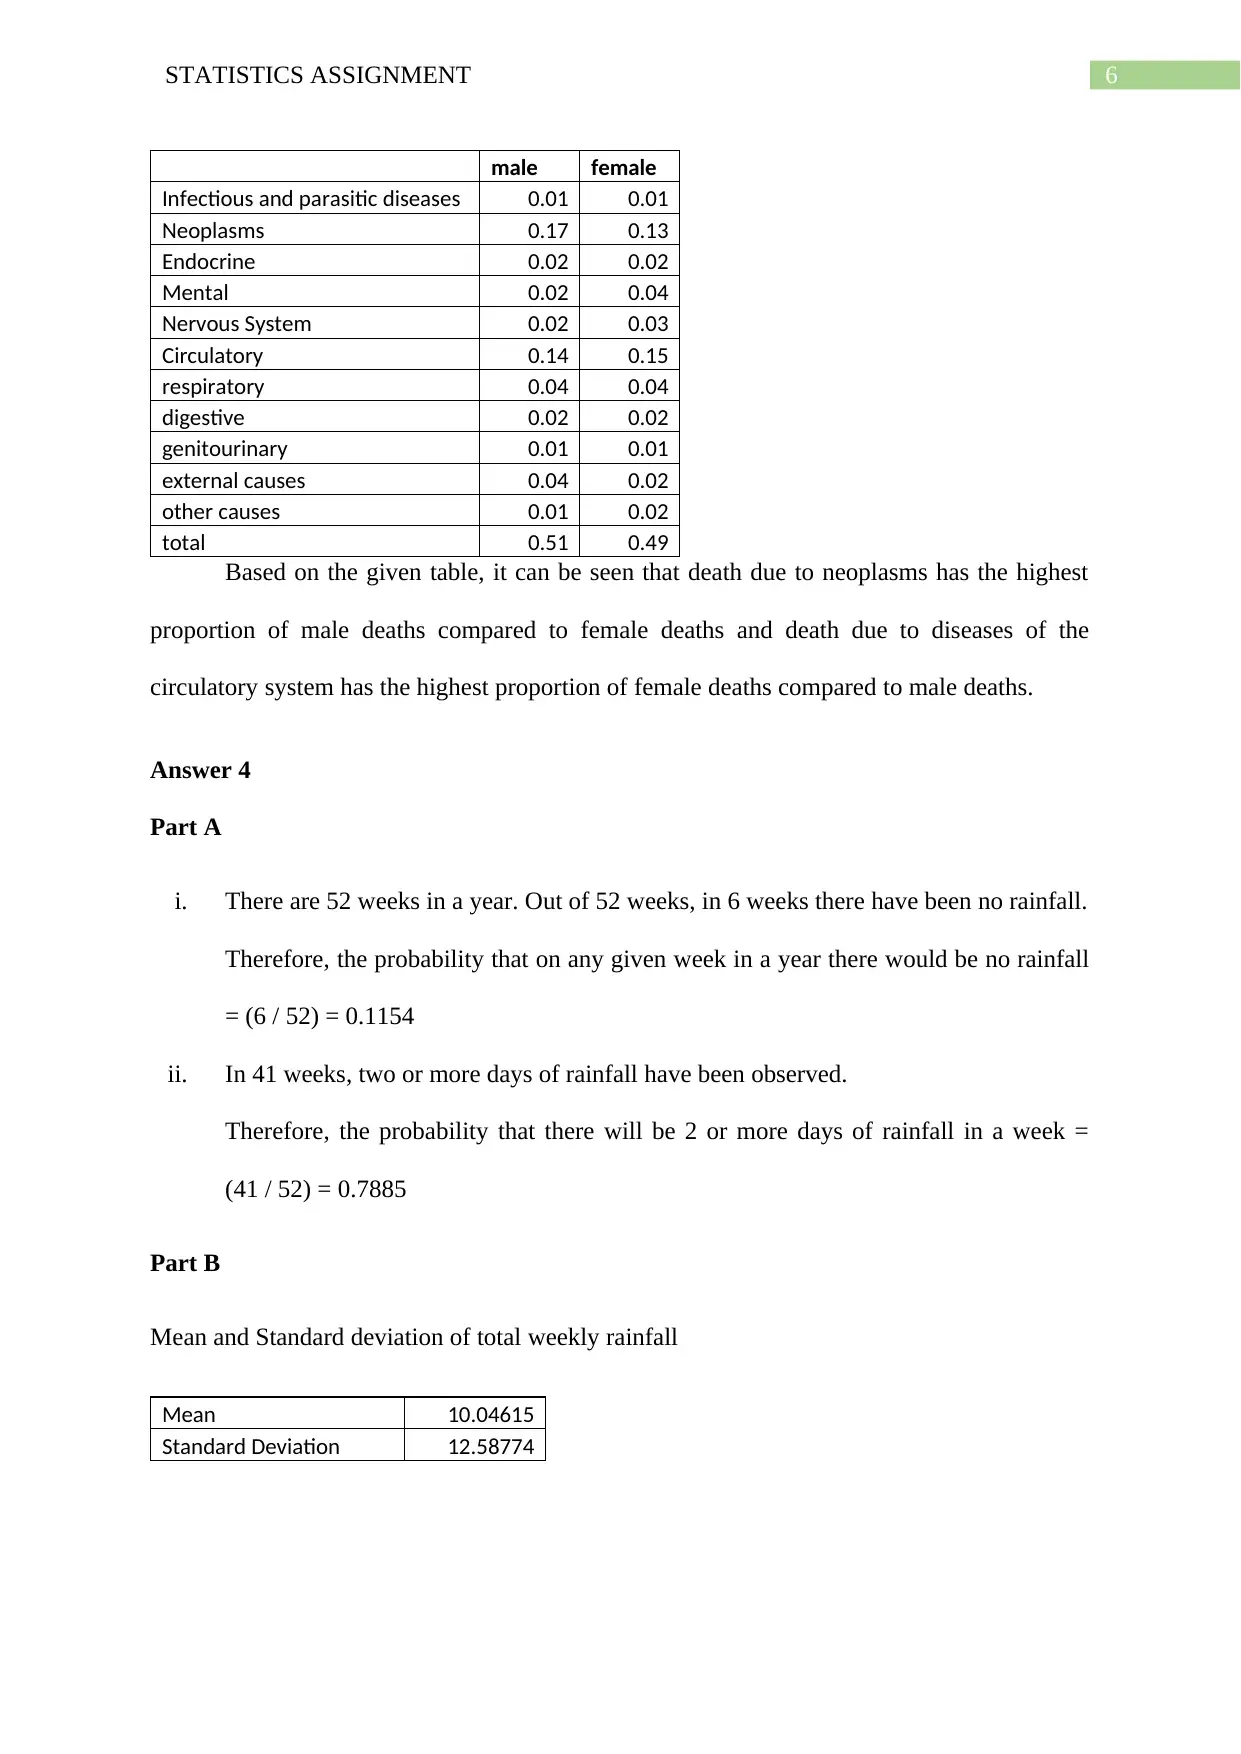
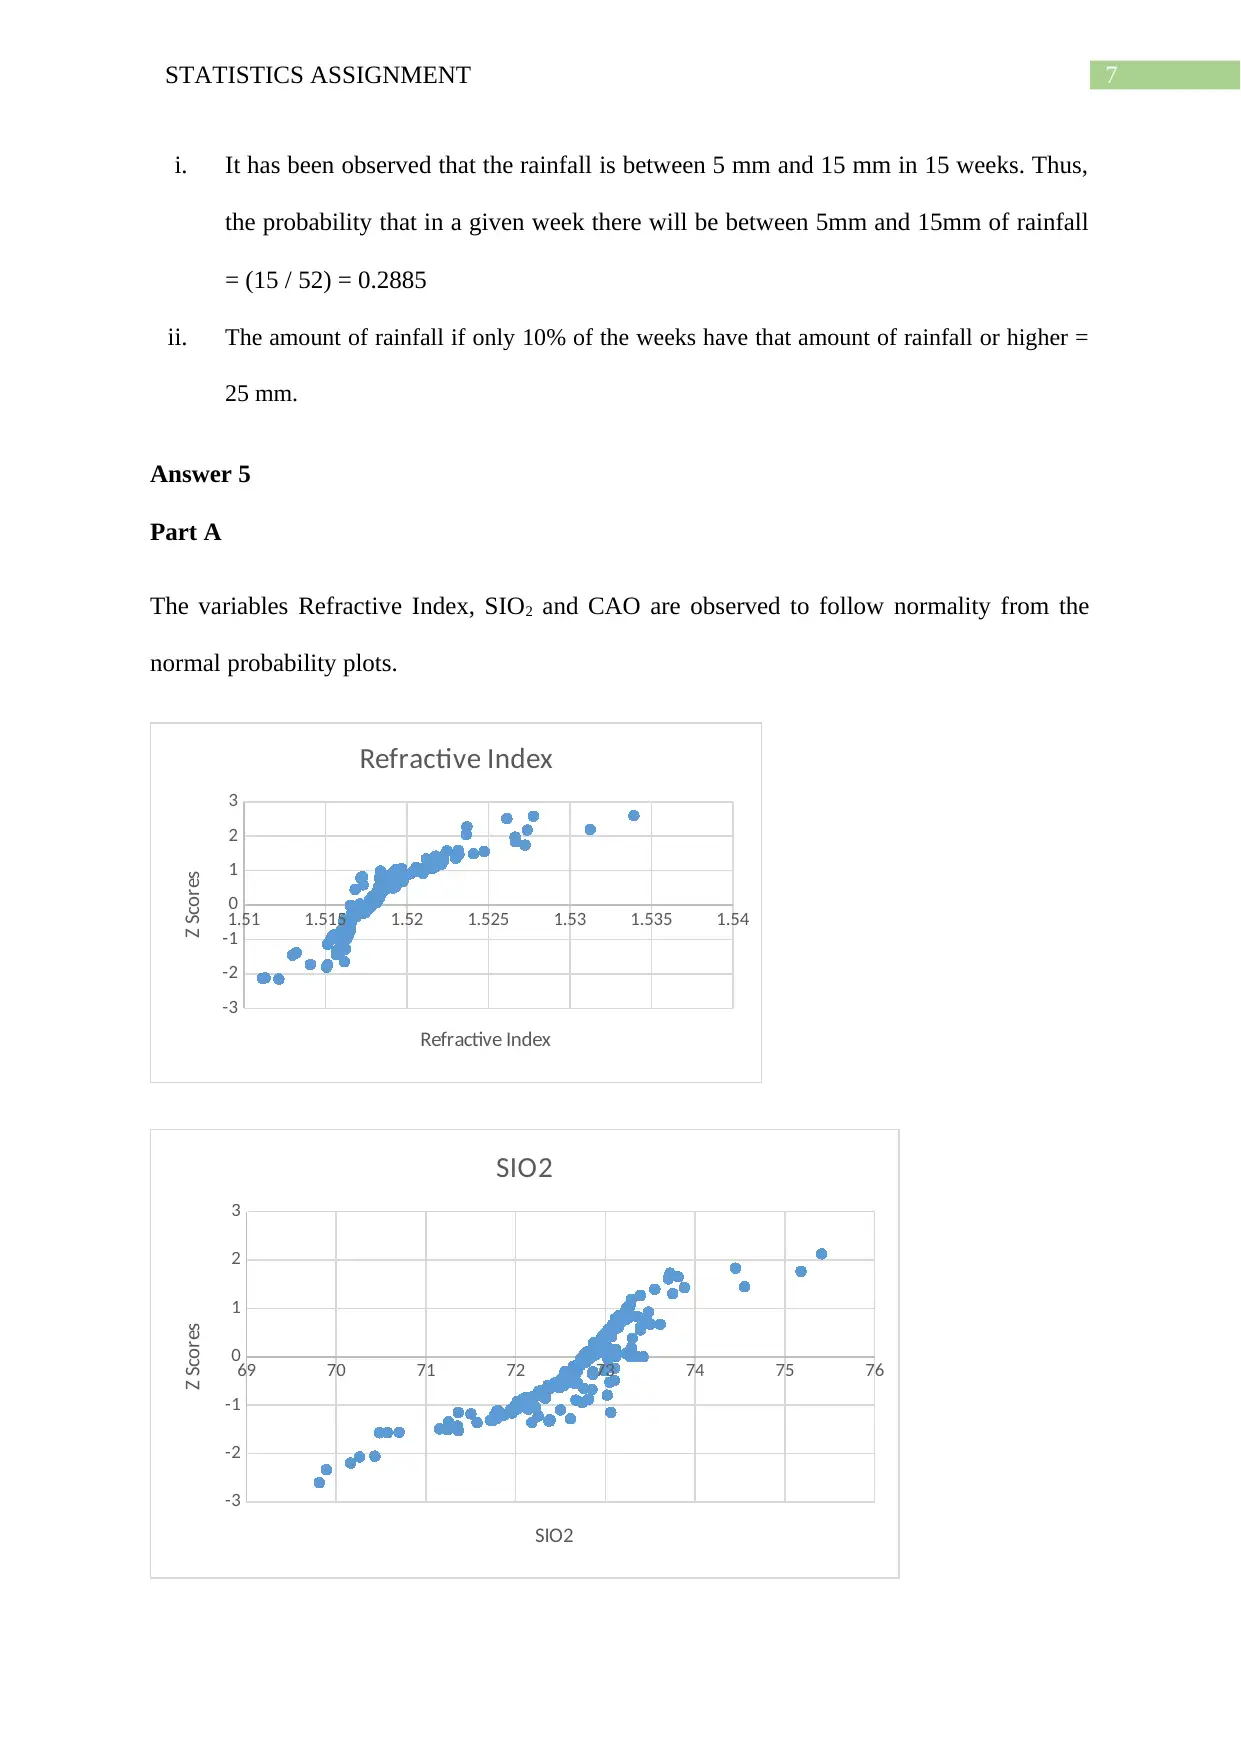
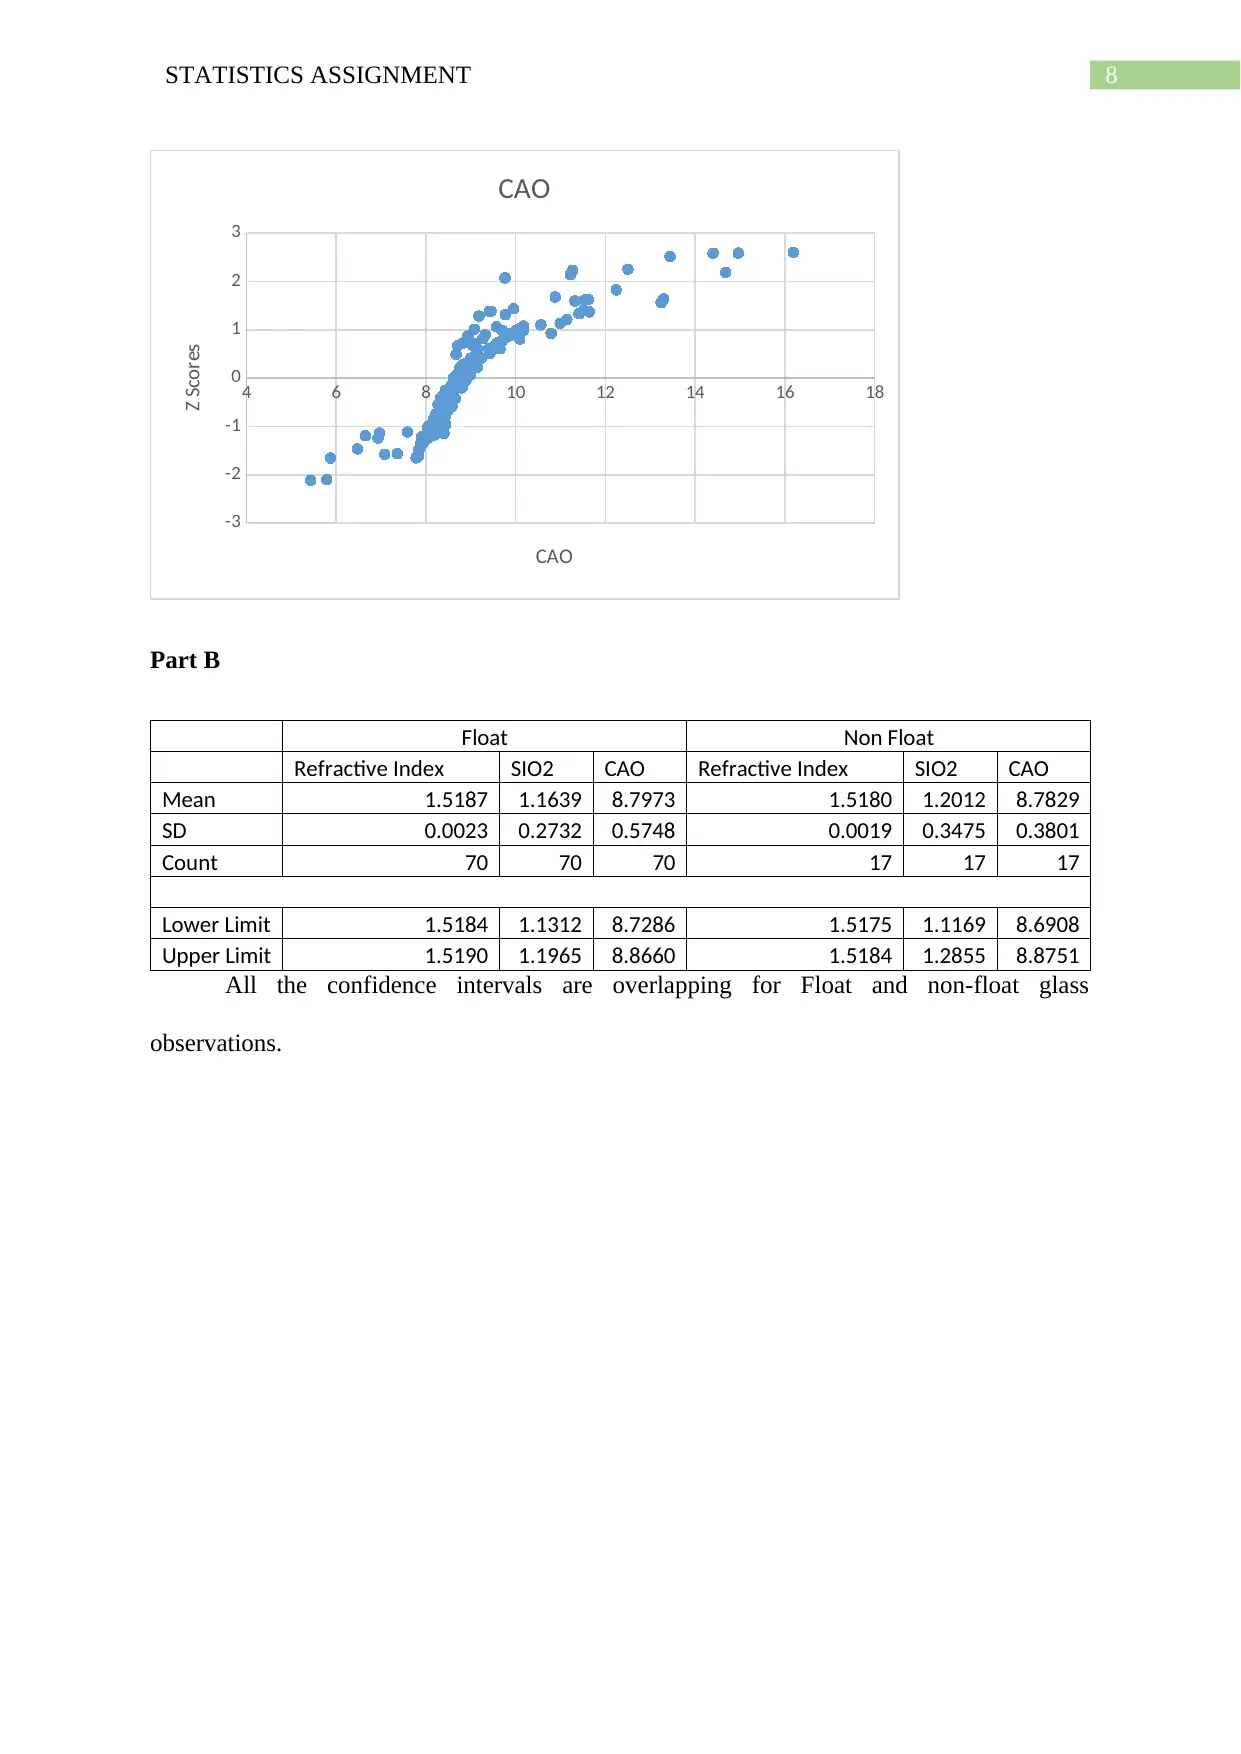
This statistics assignment provides detailed solutions to various problems involving data analysis and probability. It includes calculations and interpretations of market capitalization for companies like Macquarie Group and Perpetual Limited, probability calculations related to causes of death in Australia, and rainfall probabilities. The assignment also covers statistical analysis of glass sample data, including normality tests and confidence interval analysis for refractive index, SIO2, and CAO. The solutions are supported by tables, graphs, and statistical measures like mean, median, standard deviation, and quartiles, offering a comprehensive understanding of the statistical concepts applied. Desklib provides this assignment as a resource for students seeking assistance with their statistics coursework, offering a platform to access solved assignments and past papers.
Document Page
Running Head: STATISTICS ASSIGNMENT
Statistics Assignment
Name of the Student
Name of the University
Student ID
tabler-icon-diamond-filled.svg

Paraphrase This Document

Need a fresh take? Get an instant paraphrase of this document with our AI Paraphraser
Document Page
1STATISTICS ASSIGNMENT
Table of Contents
Answer 1....................................................................................................................................3
Part A.....................................................................................................................................3
Part B......................................................................................................................................3
Part C......................................................................................................................................3
Question 2..................................................................................................................................4
Part A.....................................................................................................................................4
Part B......................................................................................................................................4
Part C......................................................................................................................................4
Part D.....................................................................................................................................5
Answer 3....................................................................................................................................5
Part A.....................................................................................................................................5
Part B......................................................................................................................................5
Part C......................................................................................................................................5
Answer 4....................................................................................................................................6
Part A.....................................................................................................................................6
Part B......................................................................................................................................6
Answer 5....................................................................................................................................7
Part A.....................................................................................................................................7
Part B......................................................................................................................................8
Bibliography...............................................................................................................................9
Document Page
2STATISTICS ASSIGNMENT
Document Page
3STATISTICS ASSIGNMENT
Answer 1
Part A
PPT Leaves
Ste
m MQG Leaves
0.2, 2.5, 3.78, 3.8, 5.4, 7.42, 8.76, 9.18, 9.95 2
4.07, 4.34, 4.93, 5.01, 7.18,
8.70, 9.99
1.01, 1.3, 3.37, 4.34, 4.9, 5.03, 6.04, 7.77, 8.99 3
1.32, 2.93, 4.89, 5.60, 6.49,
7.89, 8.35
0, 1, 1.37, 1.72, 2.62, 4.96, 5, 5, 5.6, 5.91, 6.33, 6.45, 6.59,
6.99, 8.32, 8.6, 8.63 4
0.07, 3.26, 3.37, 7.06, 8.68,
9.05, 9.86
0.25, 2.75, 4.42, 5.29 5 0.74, 3.80, 7.59, 8.00
0 6 1.35, 1.96, 2.00, 3.21, 5.40
7 2.10, 3.77, 7.97, 9.31
8 2.08, 3.81, 5.00, 5.71
9 3.17, 8.00
(Data Source: au.finance.yahoo.com, 2018)
Part B
20 - 30 30 - 40 40 - 50 50 - 60 60 - 70 70 - 80 80 - 90 90 - 100
0
0.02
0.04
0.06
0.08
0.1
0.12
0.14
0.16
0.18
0.2
0
2
4
6
8
10
12
14
16
18
Relative Frequency Histogram and Frequency Polygon
MQG PPT
Opening Share Prices
Relative Frequency of MQG
Frequency of PPT
Part C
tabler-icon-diamond-filled.svg

Paraphrase This Document

Need a fresh take? Get an instant paraphrase of this document with our AI Paraphraser
Document Page
4STATISTICS ASSIGNMENT
Macquarie
Group
Limited
Perpetual
Limited AMCIL WAM
Capital AMP
Limited Challenger
Limited
0
5,000
10,000
15,000
20,000
25,000
30,000
35,000
Bar Graph showing Market Capitalization
Company Name
Market Capitalization
Question 2
Part A
TLS SPK TPM CNU VOC
Mean 13.37 13.33 18.65556 11.76667 21.34
Median 13.75 12.85 15.8 10.95 22.25
First Quartile 11.125 11.825 14.8 7.1 14.025
Third Quartile 15.125 15.45 23.4 16.375 26.525
Part B
TLS SPK TPM CNU VOC
Standard Deviation 2.448605 2.264239 6.603619 5.219068 11.03109
Mean Absolute Deviation 2.056 1.936 5.617284 4.533333 8.56
Maximum 17.1 16.5 27.8 18 39.6
Minimum 10.3 10.3 8.6 6.7 3
Range 6.8 6.2 19.2 11.3 36.6
Part C
Document Page
5STATISTICS ASSIGNMENT
TLS SPK TPM CNU VOC
0
5
10
15
20
25
30
Box and Whisker Plot
Average Price-Earnings Ratio
Part D
It can be seen from the analysis above that the highest price-earnings ratio is observed
for the company TPG Telecom Limited (TPM) and the company has the least standard
deviation of the ratios. This indicates that the price-earnings ratio is the least fluctuated in this
company. Thus, investing in TPM would be a better choice than the other companies as a
higher price-earnings ratio indicates higher chances of earnings in the future.
Answer 3
Part A
Probability that an Australian selected at random will die from neoplasms = (44,674 /
147,678) = 0.3025
Part B
The probability that an Australian selected at random will die from a disease of the
circulatory system and is a female = (22,493 / 147,678) = 0.1523
Part C
Document Page
6STATISTICS ASSIGNMENT
male female
Infectious and parasitic diseases 0.01 0.01
Neoplasms 0.17 0.13
Endocrine 0.02 0.02
Mental 0.02 0.04
Nervous System 0.02 0.03
Circulatory 0.14 0.15
respiratory 0.04 0.04
digestive 0.02 0.02
genitourinary 0.01 0.01
external causes 0.04 0.02
other causes 0.01 0.02
total 0.51 0.49
Based on the given table, it can be seen that death due to neoplasms has the highest
proportion of male deaths compared to female deaths and death due to diseases of the
circulatory system has the highest proportion of female deaths compared to male deaths.
Answer 4
Part A
i. There are 52 weeks in a year. Out of 52 weeks, in 6 weeks there have been no rainfall.
Therefore, the probability that on any given week in a year there would be no rainfall
= (6 / 52) = 0.1154
ii. In 41 weeks, two or more days of rainfall have been observed.
Therefore, the probability that there will be 2 or more days of rainfall in a week =
(41 / 52) = 0.7885
Part B
Mean and Standard deviation of total weekly rainfall
Mean 10.04615
Standard Deviation 12.58774
tabler-icon-diamond-filled.svg

Paraphrase This Document

Need a fresh take? Get an instant paraphrase of this document with our AI Paraphraser
Document Page
7STATISTICS ASSIGNMENT
i. It has been observed that the rainfall is between 5 mm and 15 mm in 15 weeks. Thus,
the probability that in a given week there will be between 5mm and 15mm of rainfall
= (15 / 52) = 0.2885
ii. The amount of rainfall if only 10% of the weeks have that amount of rainfall or higher =
25 mm.
Answer 5
Part A
The variables Refractive Index, SIO2 and CAO are observed to follow normality from the
normal probability plots.
1.51 1.515 1.52 1.525 1.53 1.535 1.54
-3
-2
-1
0
1
2
3
Refractive Index
Refractive Index
Z Scores
69 70 71 72 73 74 75 76
-3
-2
-1
0
1
2
3
SIO2
SIO2
Z Scores
Document Page
8STATISTICS ASSIGNMENT
4 6 8 10 12 14 16 18
-3
-2
-1
0
1
2
3
CAO
CAO
Z Scores
Part B
Float Non Float
Refractive Index SIO2 CAO Refractive Index SIO2 CAO
Mean 1.5187 1.1639 8.7973 1.5180 1.2012 8.7829
SD 0.0023 0.2732 0.5748 0.0019 0.3475 0.3801
Count 70 70 70 17 17 17
Lower Limit 1.5184 1.1312 8.7286 1.5175 1.1169 8.6908
Upper Limit 1.5190 1.1965 8.8660 1.5184 1.2855 8.8751
All the confidence intervals are overlapping for Float and non-float glass
observations.
Document Page
9STATISTICS ASSIGNMENT
Bibliography
3303.0 - Causes of Death, Australia, 2013. (2018). Retrieved from
http://www.abs.gov.au/AUSSTATS/abs@.nsf/DetailsPage/3303.02013?
OpenDocument
Climate Data Online. (2018). Retrieved from http://www.bom.gov.au/climate/data/?ref=ftr
Index of /ml/machine-learning-databases/glass. (2018). Retrieved from
https://archive.ics.uci.edu/ml/machine-learning-databases/glass/
MQG.AX Historical prices | MACQ GROUP FPO Stock - Yahoo Finance. (2018). Retrieved
from https://au.finance.yahoo.com/quote/MQG.AX/history/?guccounter=1
PPT.AX Historical prices | PERPETUAL FPO Stock - Yahoo Finance. (2018). Retrieved
from https://au.finance.yahoo.com/quote/PPT.AX/history/
chevron_up_icon
1 out of 10
circle_padding
hide_on_mobile
zoom_out_icon
[object Object]