Statistics Assignment: Mean, Median, Mode, Hypothesis Testing - Solved
VerifiedAdded on 2023/06/11
|6
|1554
|131
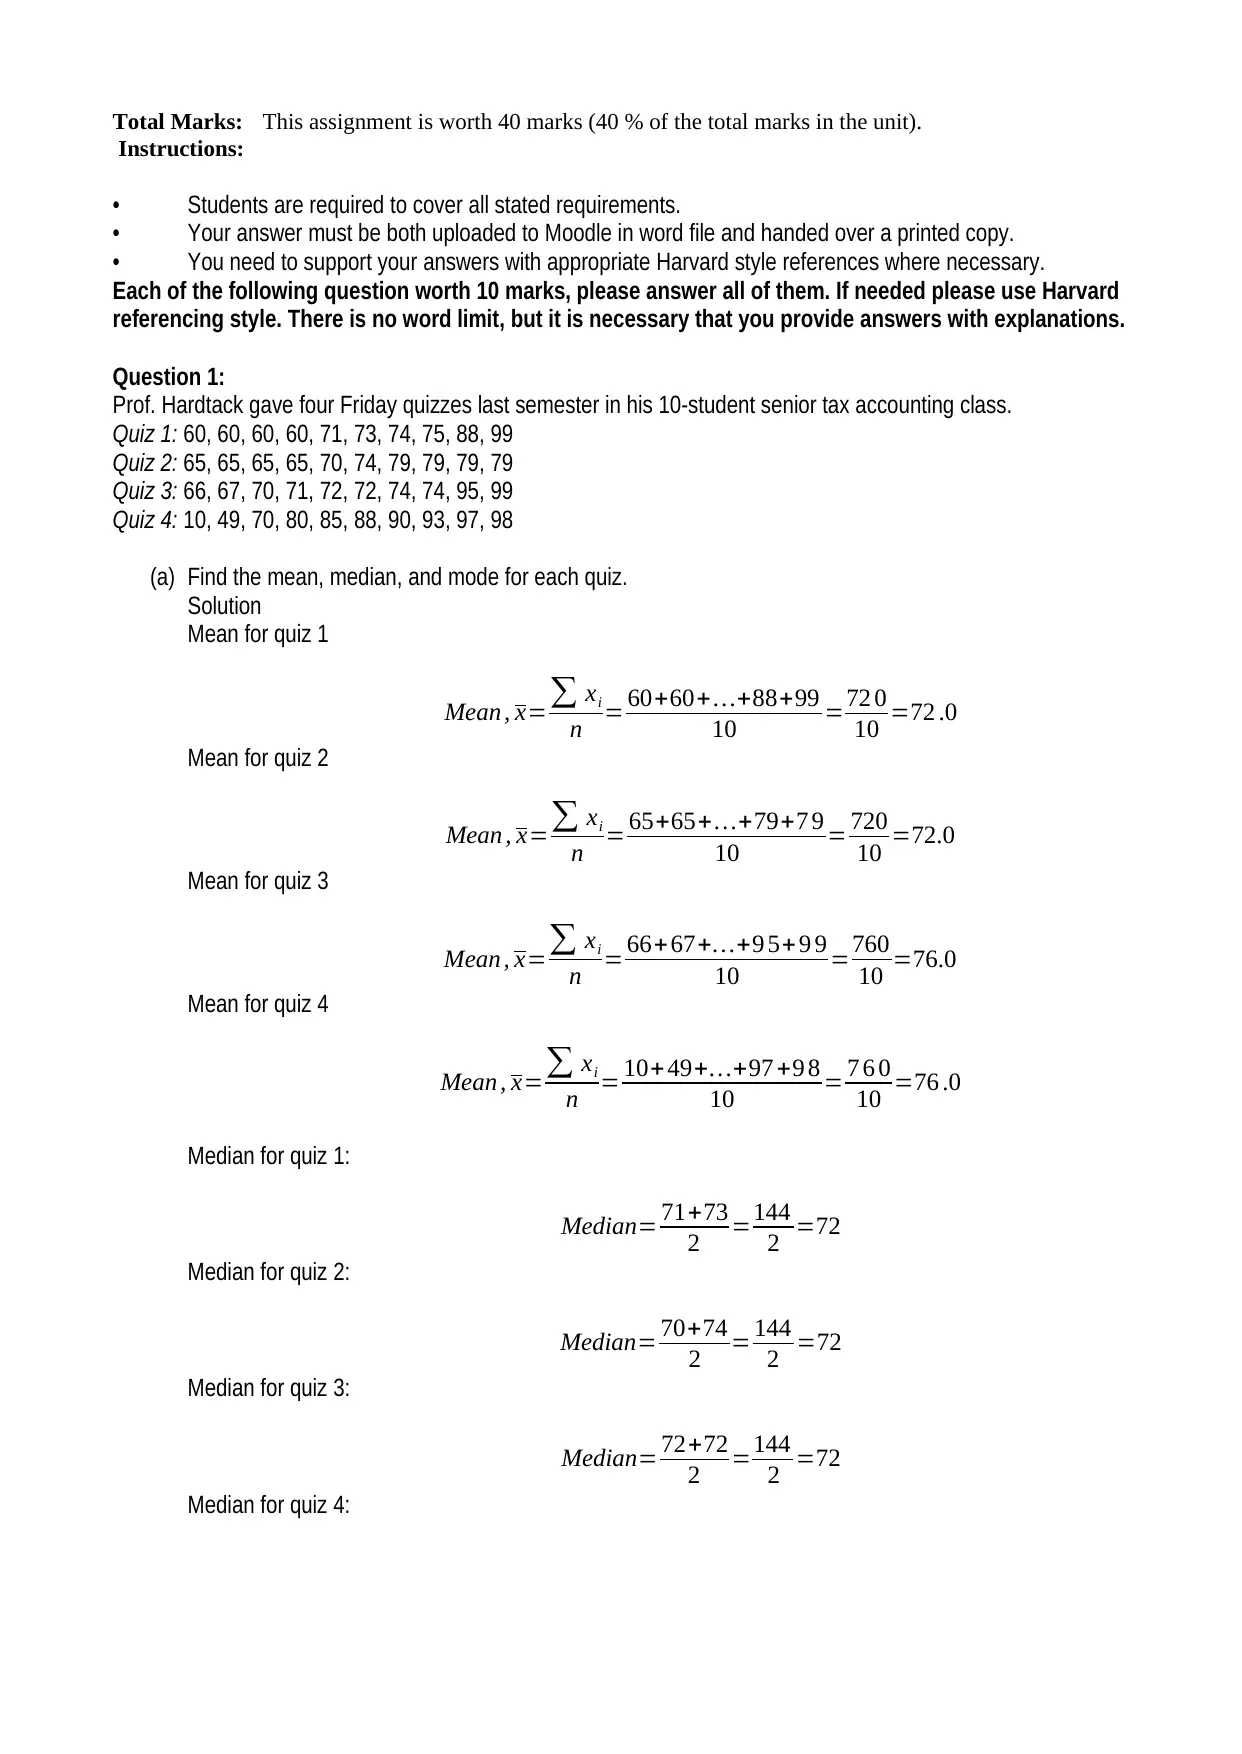
Homework Assignment
AI Summary
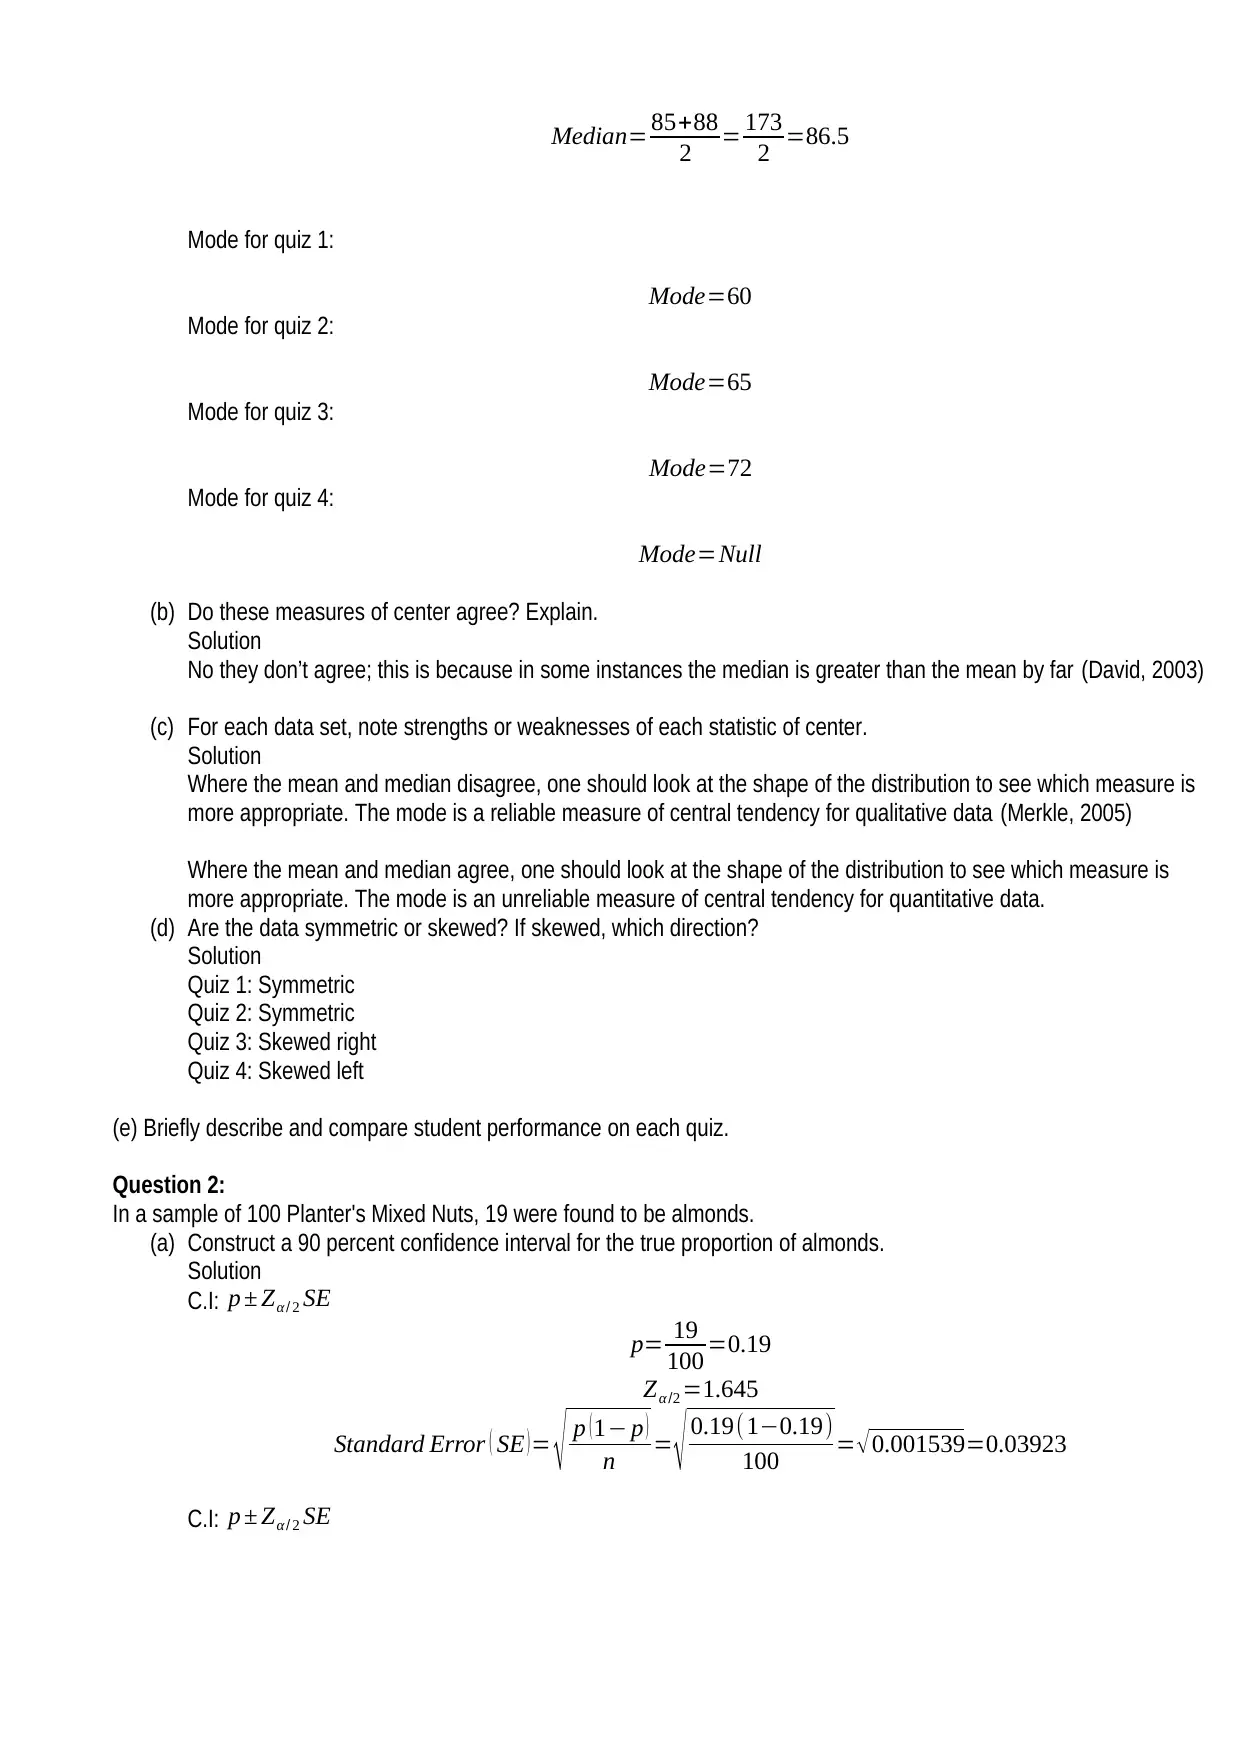
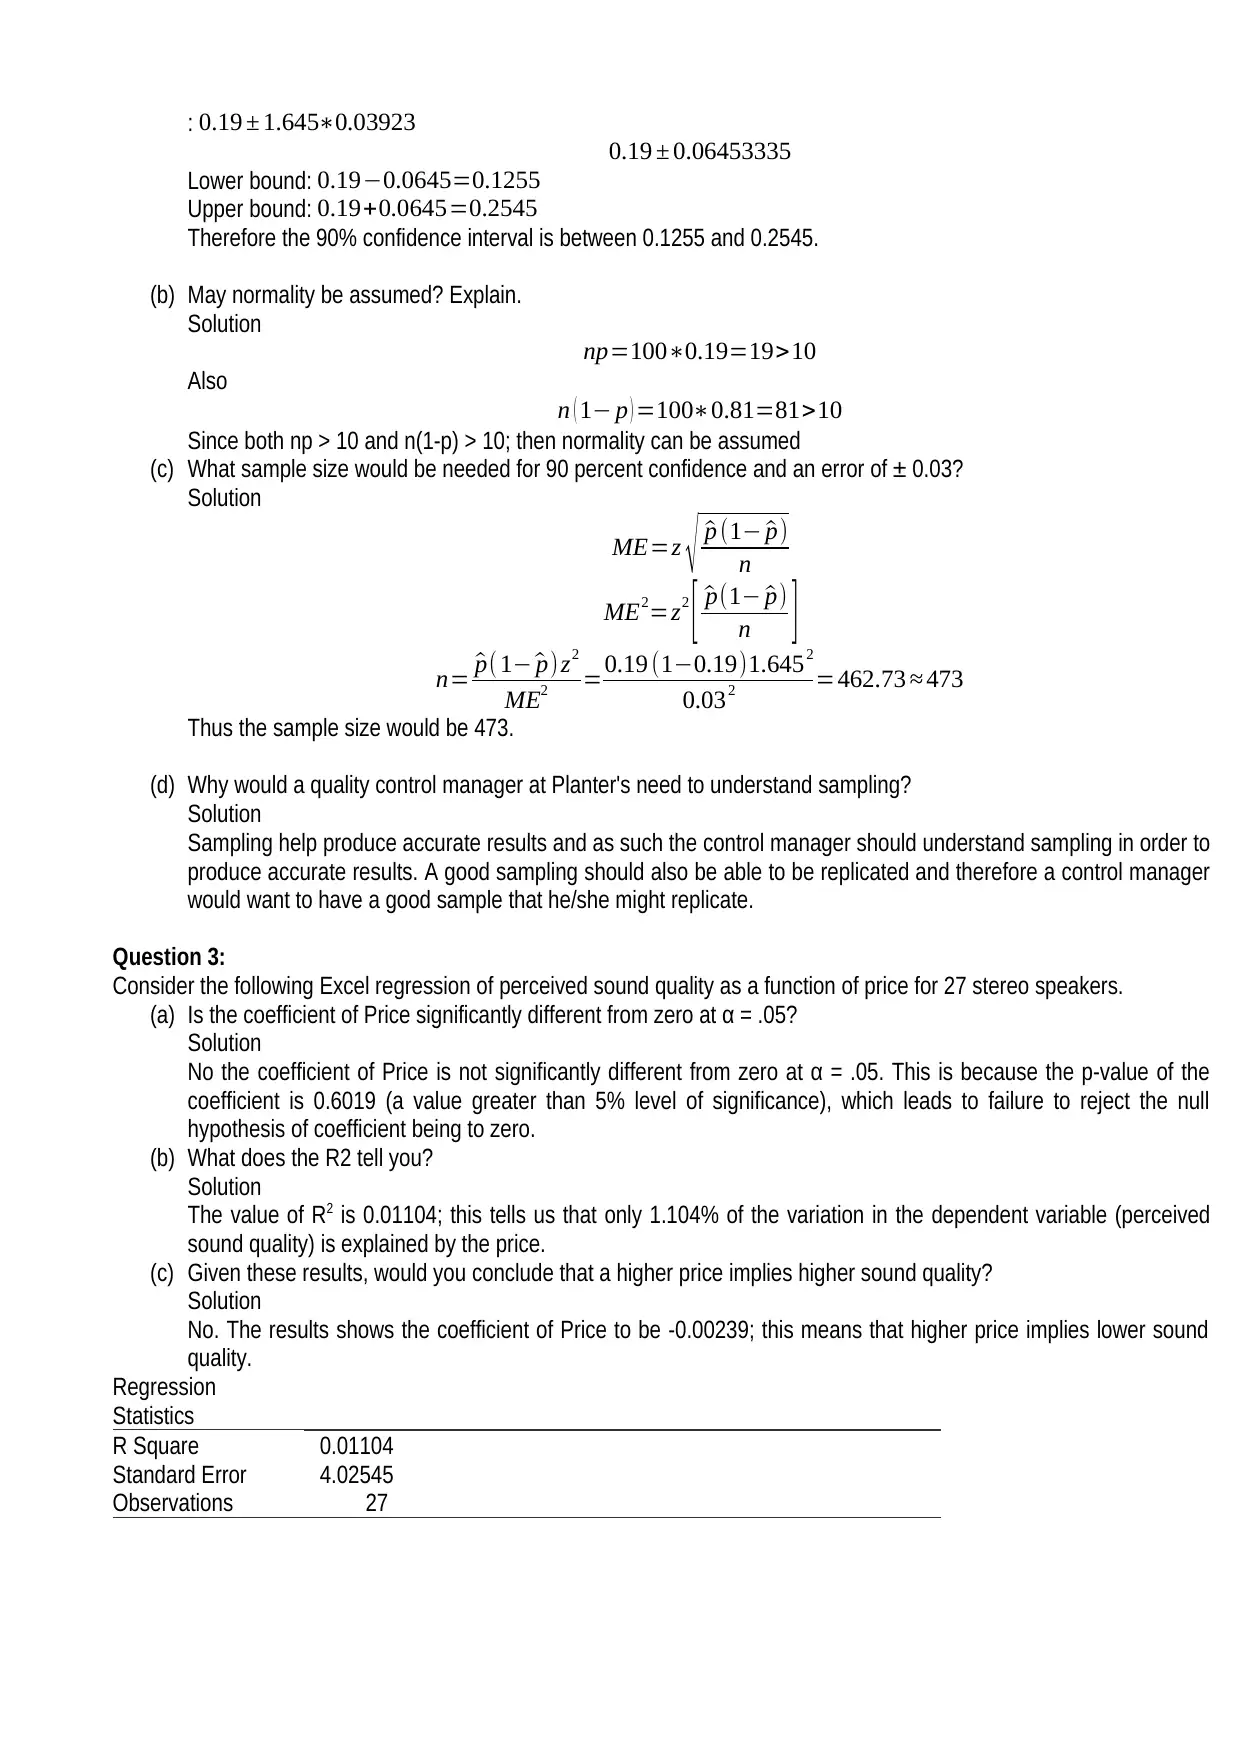
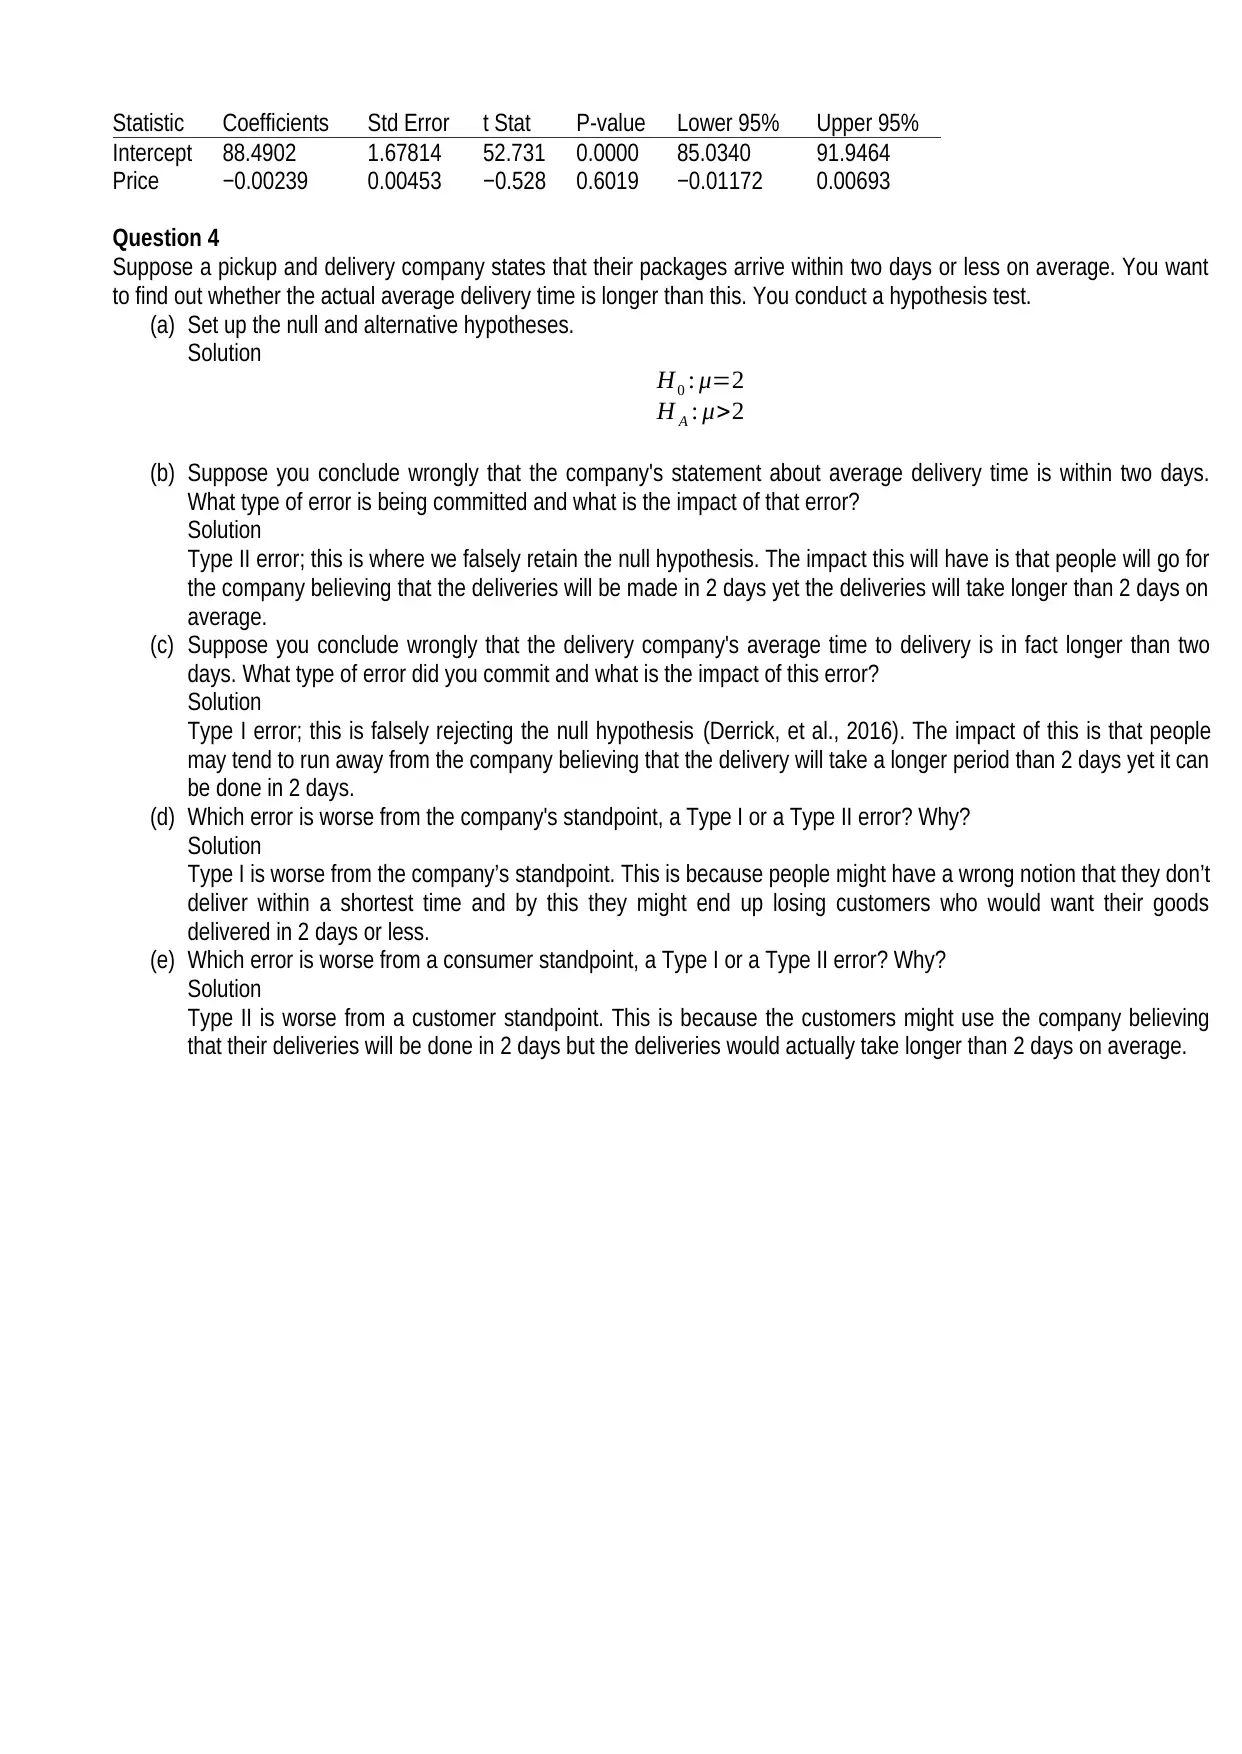
This document presents a detailed solution to a statistics assignment involving calculations of mean, median, and mode for multiple data sets, followed by an analysis of their agreement and appropriateness. It also covers the construction of a confidence interval for a proportion, hypothesis testing, and the identification of Type I and Type II errors. The solution provides explanations for each step, including the interpretation of regression statistics and the implications of different error types in a practical context. The assignment explores concepts like data symmetry, skewness, and the importance of sampling in quality control, offering a comprehensive overview of fundamental statistical principles. Desklib provides this document along with other past papers and solved assignments for students.

1 out of 6
Related Documents


Your All-in-One AI-Powered Toolkit for Academic Success.
+13062052269
info@desklib.com
Available 24*7 on WhatsApp / Email
![[object Object]](/_next/static/media/star-bottom.7253800d.svg)
Copyright © 2020–2026 A2Z Services. All Rights Reserved. Developed and managed by ZUCOL.