Statistics STAT-101 Assignment 2: Probability and Confidence Intervals

Verified

Added on  2023/04/22

|4
|743
|478
Homework Assignment
AI Summary
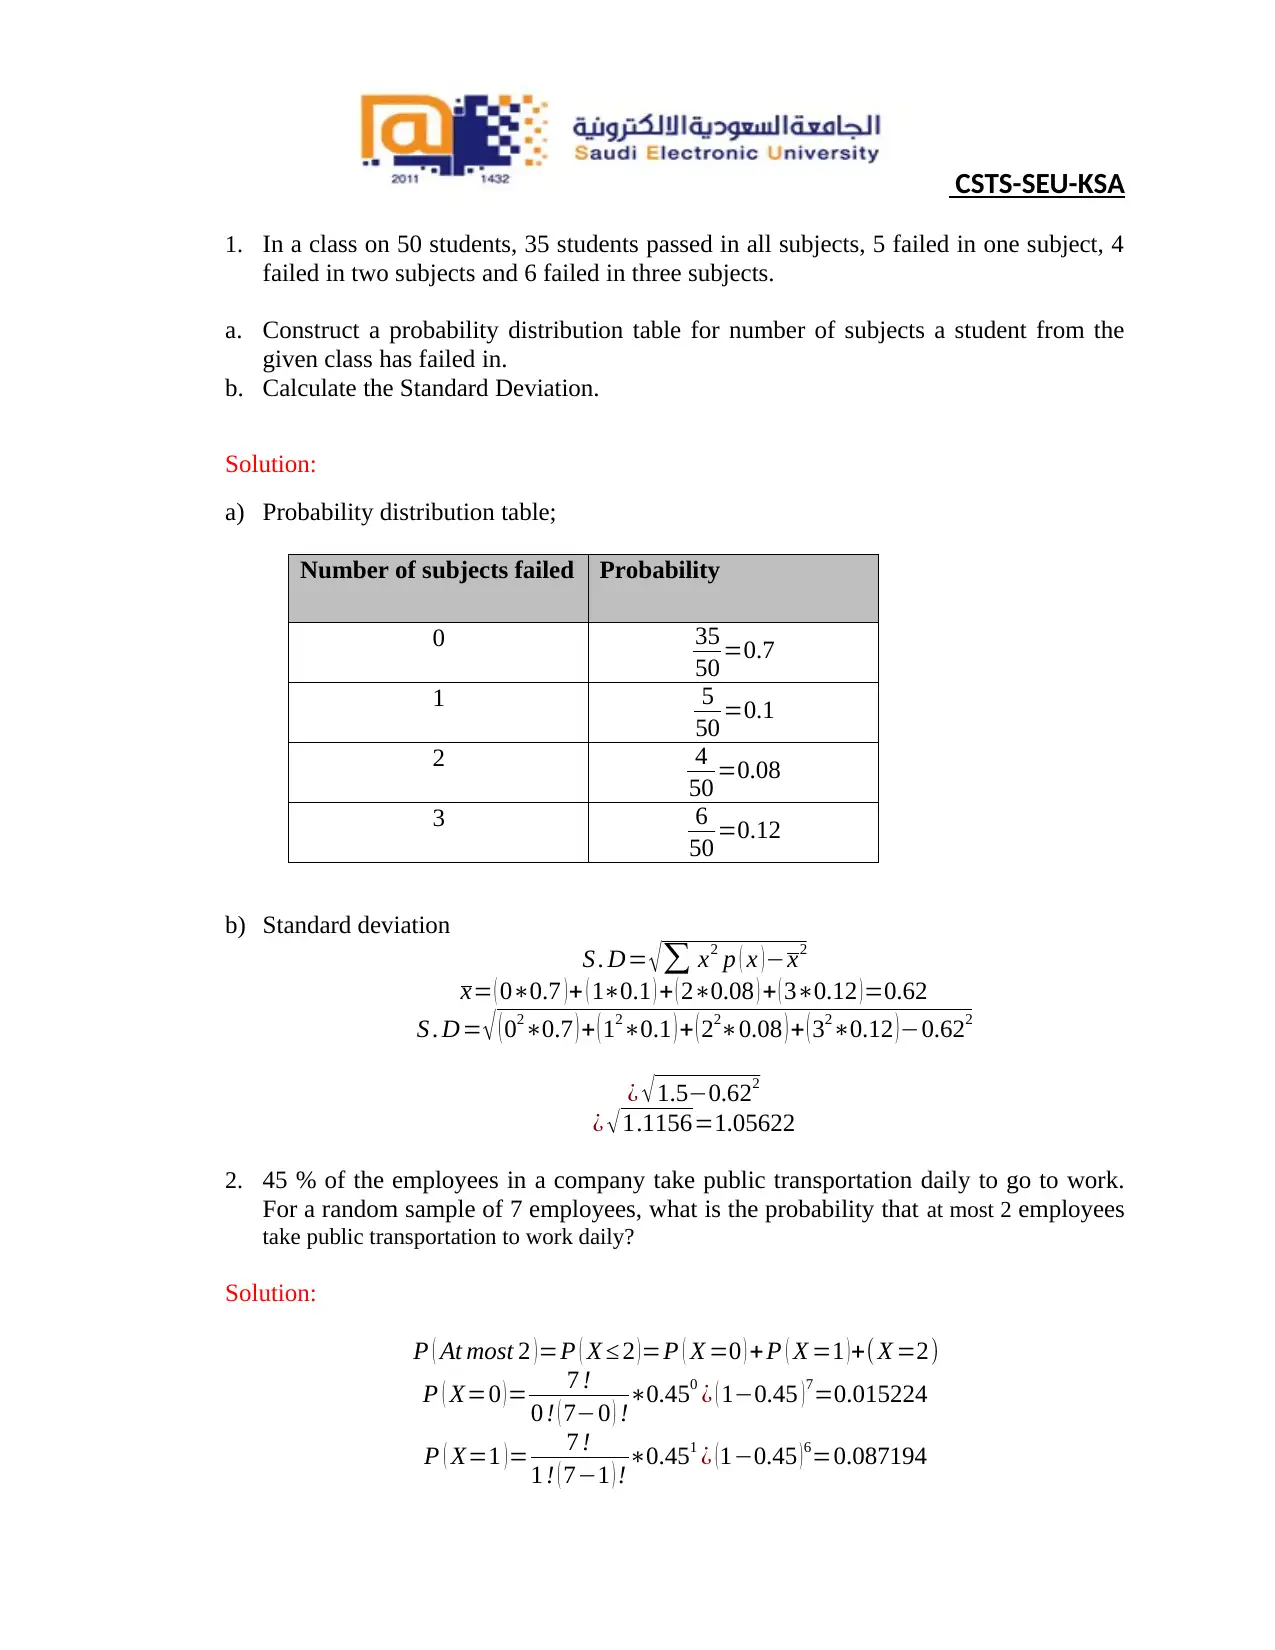
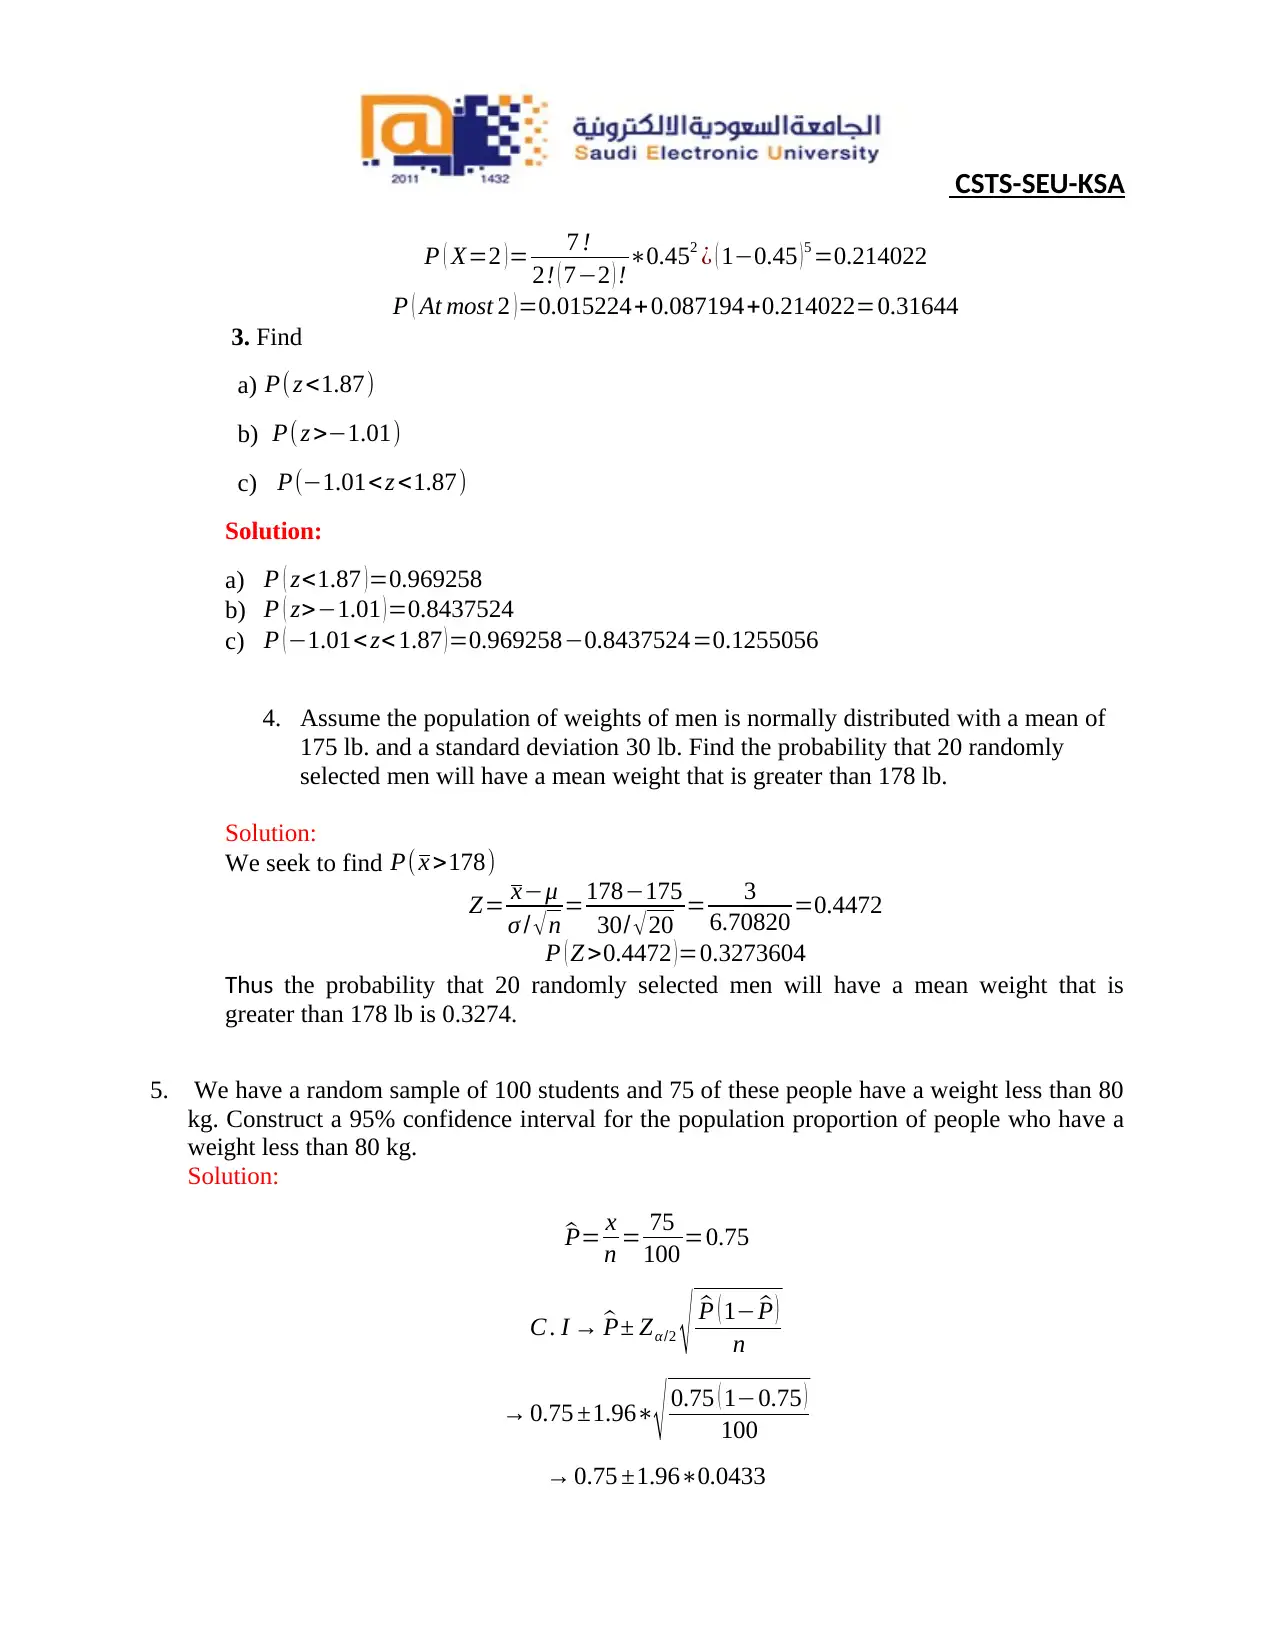
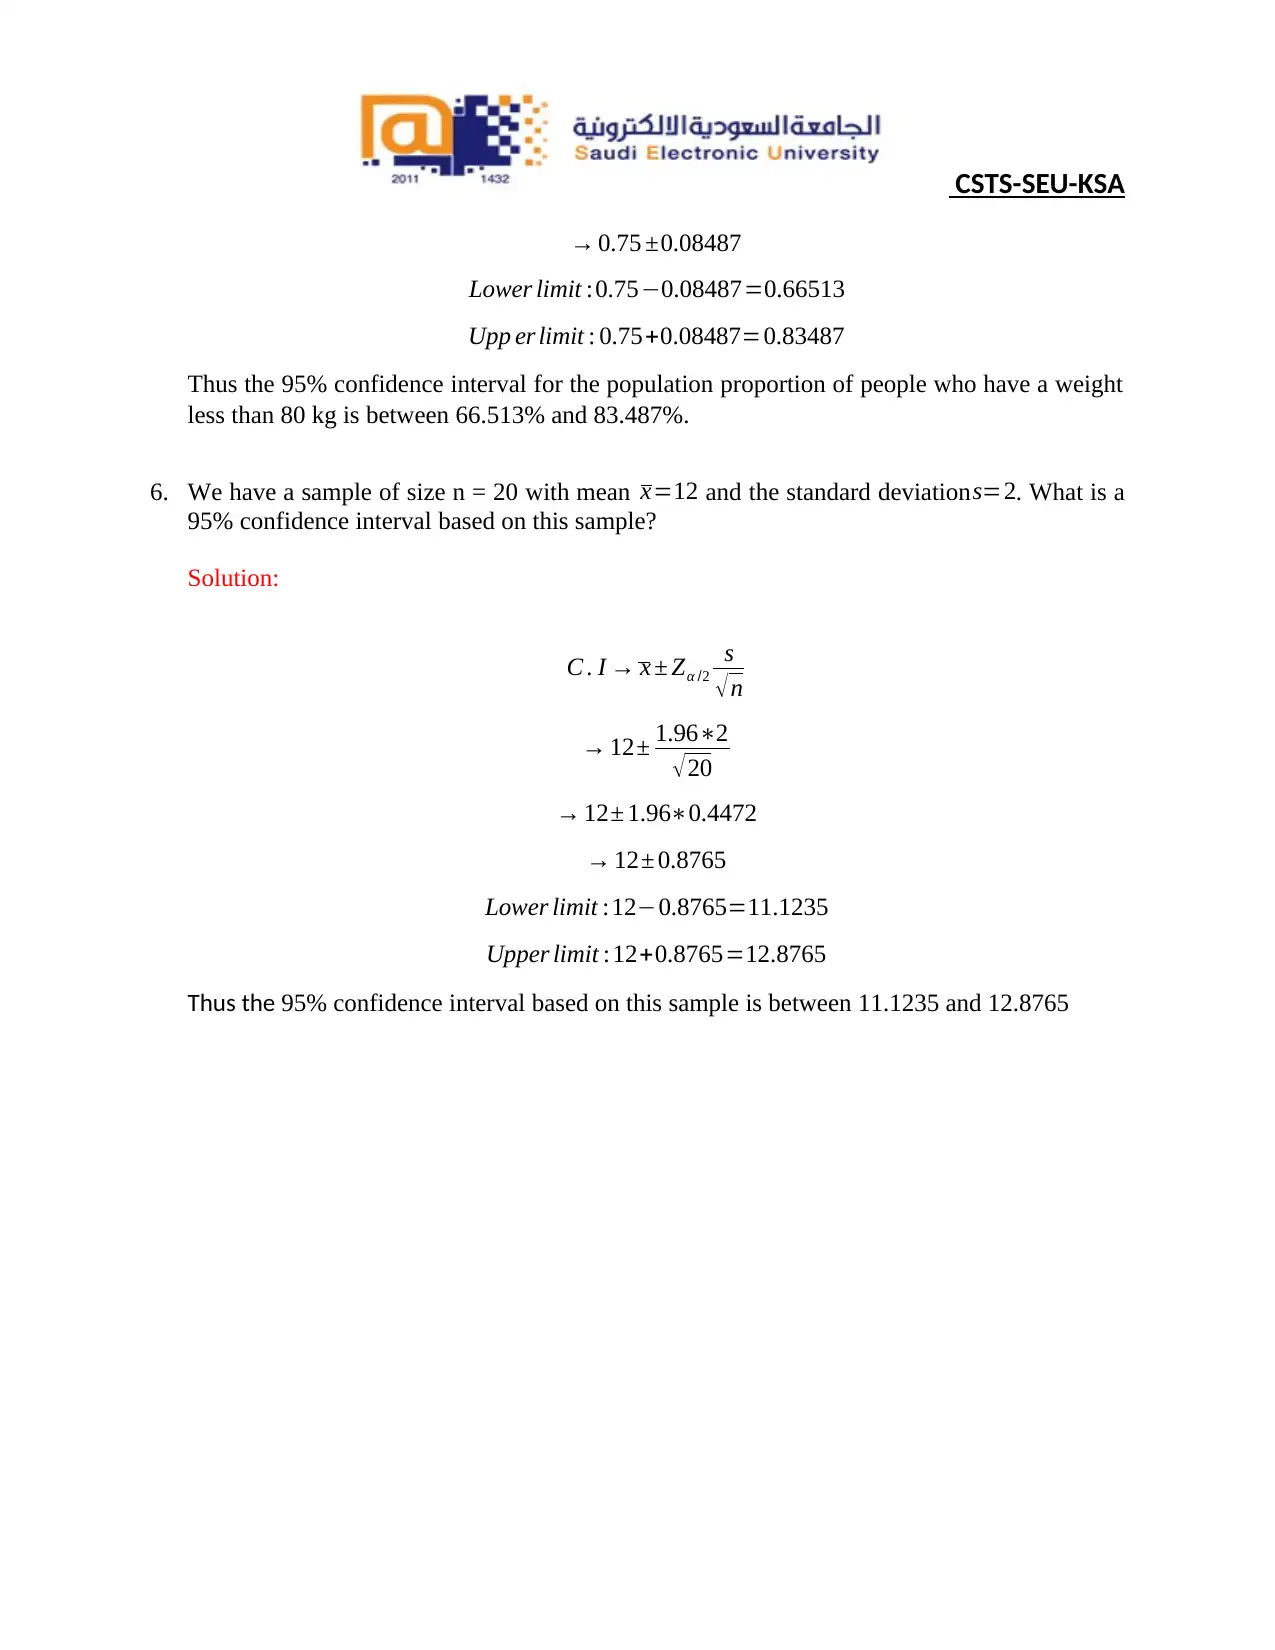
This document presents a comprehensive solution to a Statistics assignment (STAT-101) from CSTS-SEU-KSA, focusing on probability and statistical analysis. The assignment includes detailed solutions for constructing a probability distribution table and calculating the standard deviation based on student performance data. It further addresses binomial probability calculations, determining the probability of employees using public transport. The assignment also covers problems related to the normal distribution, including finding probabilities based on given mean and standard deviation, and calculating confidence intervals for population proportions and sample means. The solutions are presented with clear step-by-step explanations and calculations, making it a valuable resource for students studying statistics.
Document Page
CSTS-SEU-KSA
___________________________________________________________________
Statistics (STAT-101)
Assignment-2 (Weeks: 5-7)
2nd Semester, 1439-1440 (2018-2019)
Due date :23/02/2019 (Time: 11:00 AM)
Student’s Name
Student’s ID
Section/CRN
Location
Marking Scheme
Question Score Obtained Score
Q-1 3
Q-2 3
Q-3 3
Q-4 3
Q-5 3
Q-6 3
Total 18
Note: You are required to fill your full name, ID and CRN.
Solve the following questions 6 ×3 mark =18 mark
tabler-icon-diamond-filled.svg

Paraphrase This Document

Need a fresh take? Get an instant paraphrase of this document with our AI Paraphraser
Document Page
CSTS-SEU-KSA
1. In a class on 50 students, 35 students passed in all subjects, 5 failed in one subject, 4
failed in two subjects and 6 failed in three subjects.
a. Construct a probability distribution table for number of subjects a student from the
given class has failed in.
b. Calculate the Standard Deviation.
Solution:
a) Probability distribution table;
Number of subjects failed Probability
0 35
50 =0.7
1 5
50 =0.1
2 4
50 =0.08
3 6
50 =0.12
b) Standard deviation
S . D= x2 p ( x )x2
x= ( 00.7 )+ ( 10.1 ) + ( 20.08 ) + ( 30.12 )=0.62
S . D= ( 020.7 ) + ( 120.1 ) + ( 220.08 ) + ( 320.12 )0.622
¿ 1.50.622
¿ 1.1156=1.05622
2. 45 % of the employees in a company take public transportation daily to go to work.
For a random sample of 7 employees, what is the probability that at most 2 employees
take public transportation to work daily?
Solution:
P ( At most 2 )=P ( X 2 )=P ( X =0 ) + P ( X =1 )+( X =2)
P ( X=0 ) = 7 !
0 ! ( 70 ) !0.450 ¿ ( 10.45 ) 7=0.015224
P ( X=1 )= 7 !
1 ! ( 71 ) ! 0.451 ¿ (10.45 )6=0.087194
Document Page
CSTS-SEU-KSA
P ( X=2 ) = 7 !
2! ( 72 ) ! 0.452 ¿ ( 10.45 ) 5 =0.214022
P ( At most 2 ) =0.015224+0.087194+0.214022=0.31644
3. Find
a) P( z <1.87)
b) P(z >1.01)
c) P(1.01<z <1.87)
Solution:
a) P ( z<1.87 ) =0.969258
b) P ( z>1.01 )=0.8437524
c) P ( 1.01< z< 1.87 ) =0.9692580.8437524=0.1255056
4. Assume the population of weights of men is normally distributed with a mean of
175 lb. and a standard deviation 30 lb. Find the probability that 20 randomly
selected men will have a mean weight that is greater than 178 lb.
Solution:
We seek to find P(x >178)
Z= xμ
σ / n =178175
30/ 20 = 3
6.70820 =0.4472
P ( Z >0.4472 )=0.3273604
Thus the probability that 20 randomly selected men will have a mean weight that is
greater than 178 lb is 0.3274.
5. We have a random sample of 100 students and 75 of these people have a weight less than 80
kg. Construct a 95% confidence interval for the population proportion of people who have a
weight less than 80 kg.
Solution:
^P= x
n = 75
100 =0.75
C . I ^P± Zα/2 ^P ( 1 ^P )
n
0.75 ±1.96
0.75 ( 10.75 )
100
0.75 ±1.960.0433
Document Page
CSTS-SEU-KSA
0.75 ±0.08487
Lower limit :0.750.08487=0.66513
Upp er limit : 0.75+0.08487=0.83487
Thus the 95% confidence interval for the population proportion of people who have a weight
less than 80 kg is between 66.513% and 83.487%.
6. We have a sample of size n = 20 with mean x=12 and the standard deviations=2. What is a
95% confidence interval based on this sample?
Solution:
C . I x ± Zα /2
s
n
12± 1.962
20
12± 1.960.4472
12± 0.8765
Lower limit :120.8765=11.1235
Upper limit :12+0.8765=12.8765
Thus the 95% confidence interval based on this sample is between 11.1235 and 12.8765
chevron_up_icon
1 out of 4
circle_padding
hide_on_mobile
zoom_out_icon
[object Object]