Statistics Assignment: Analyzing Statistical Concepts and Data

Verified

Added on  2022/12/28

|7
|656
|67
Homework Assignment
AI Summary
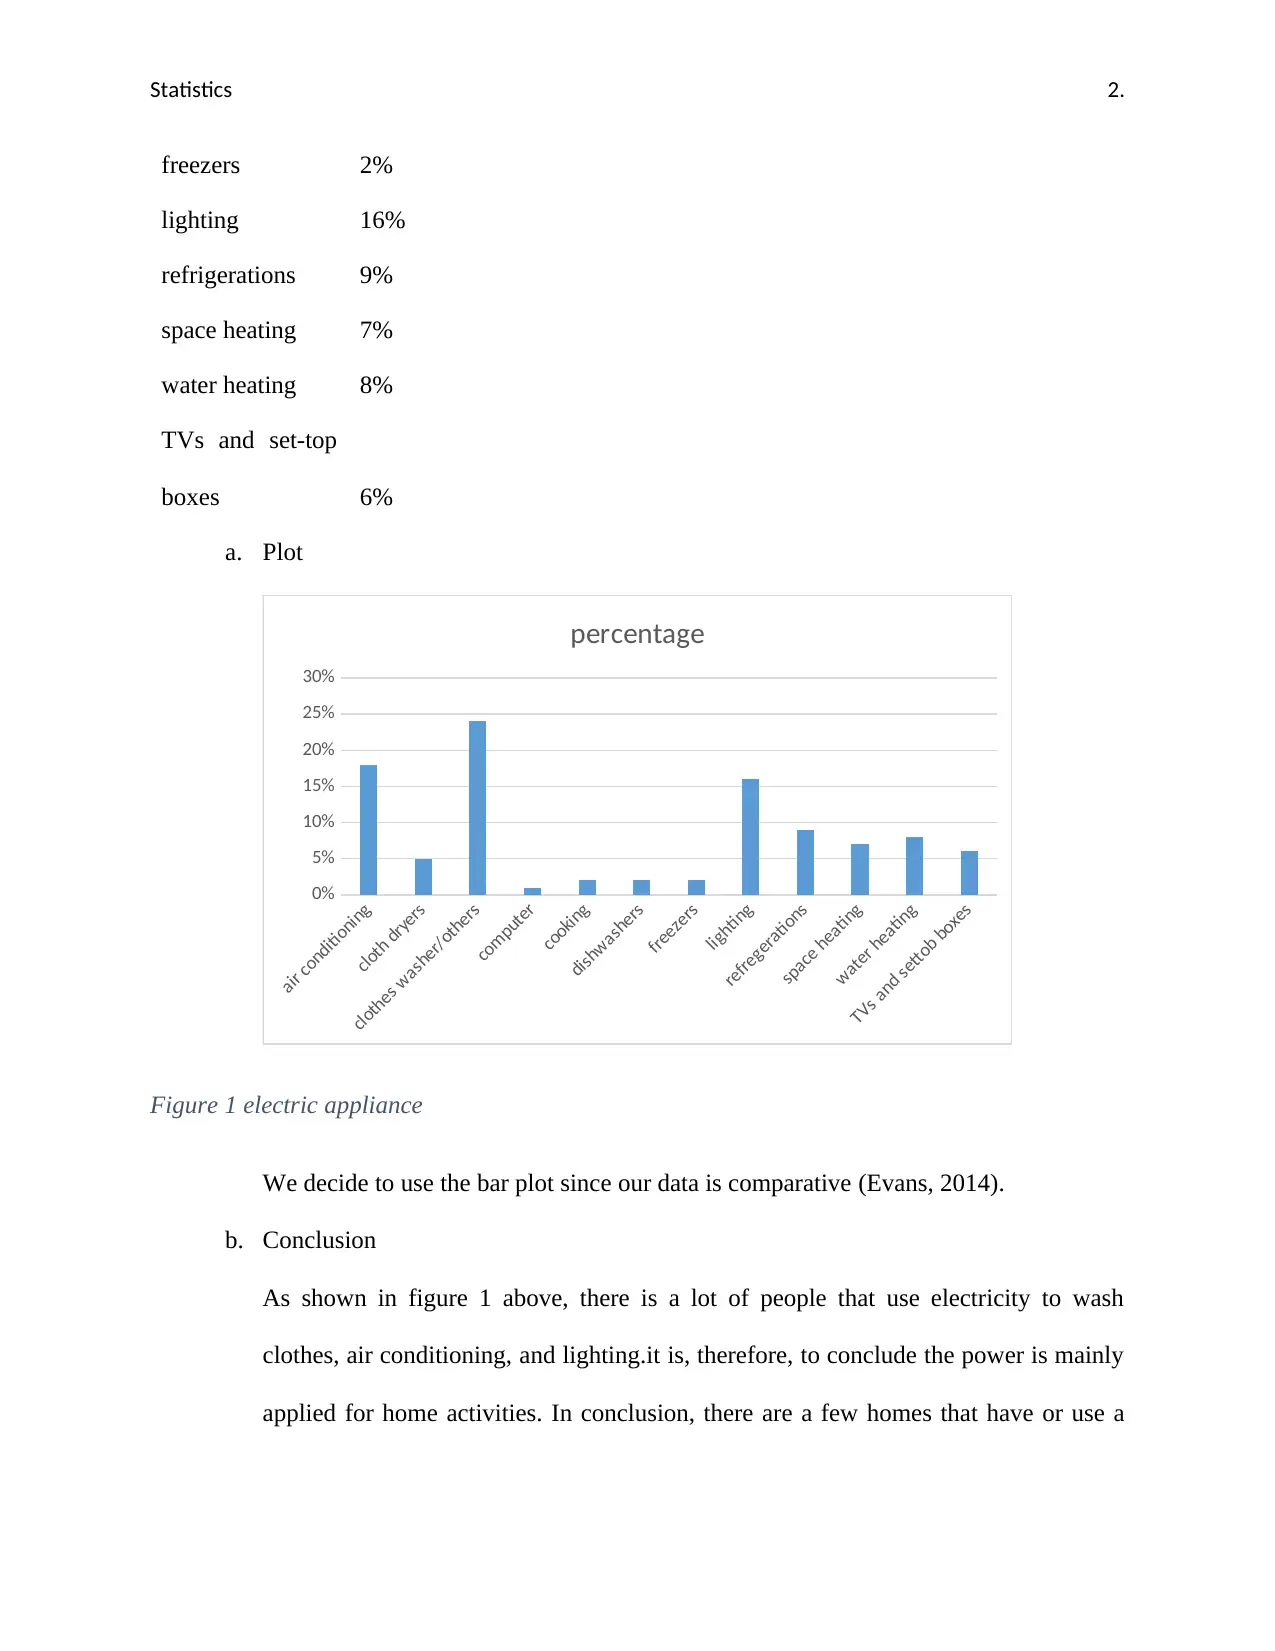
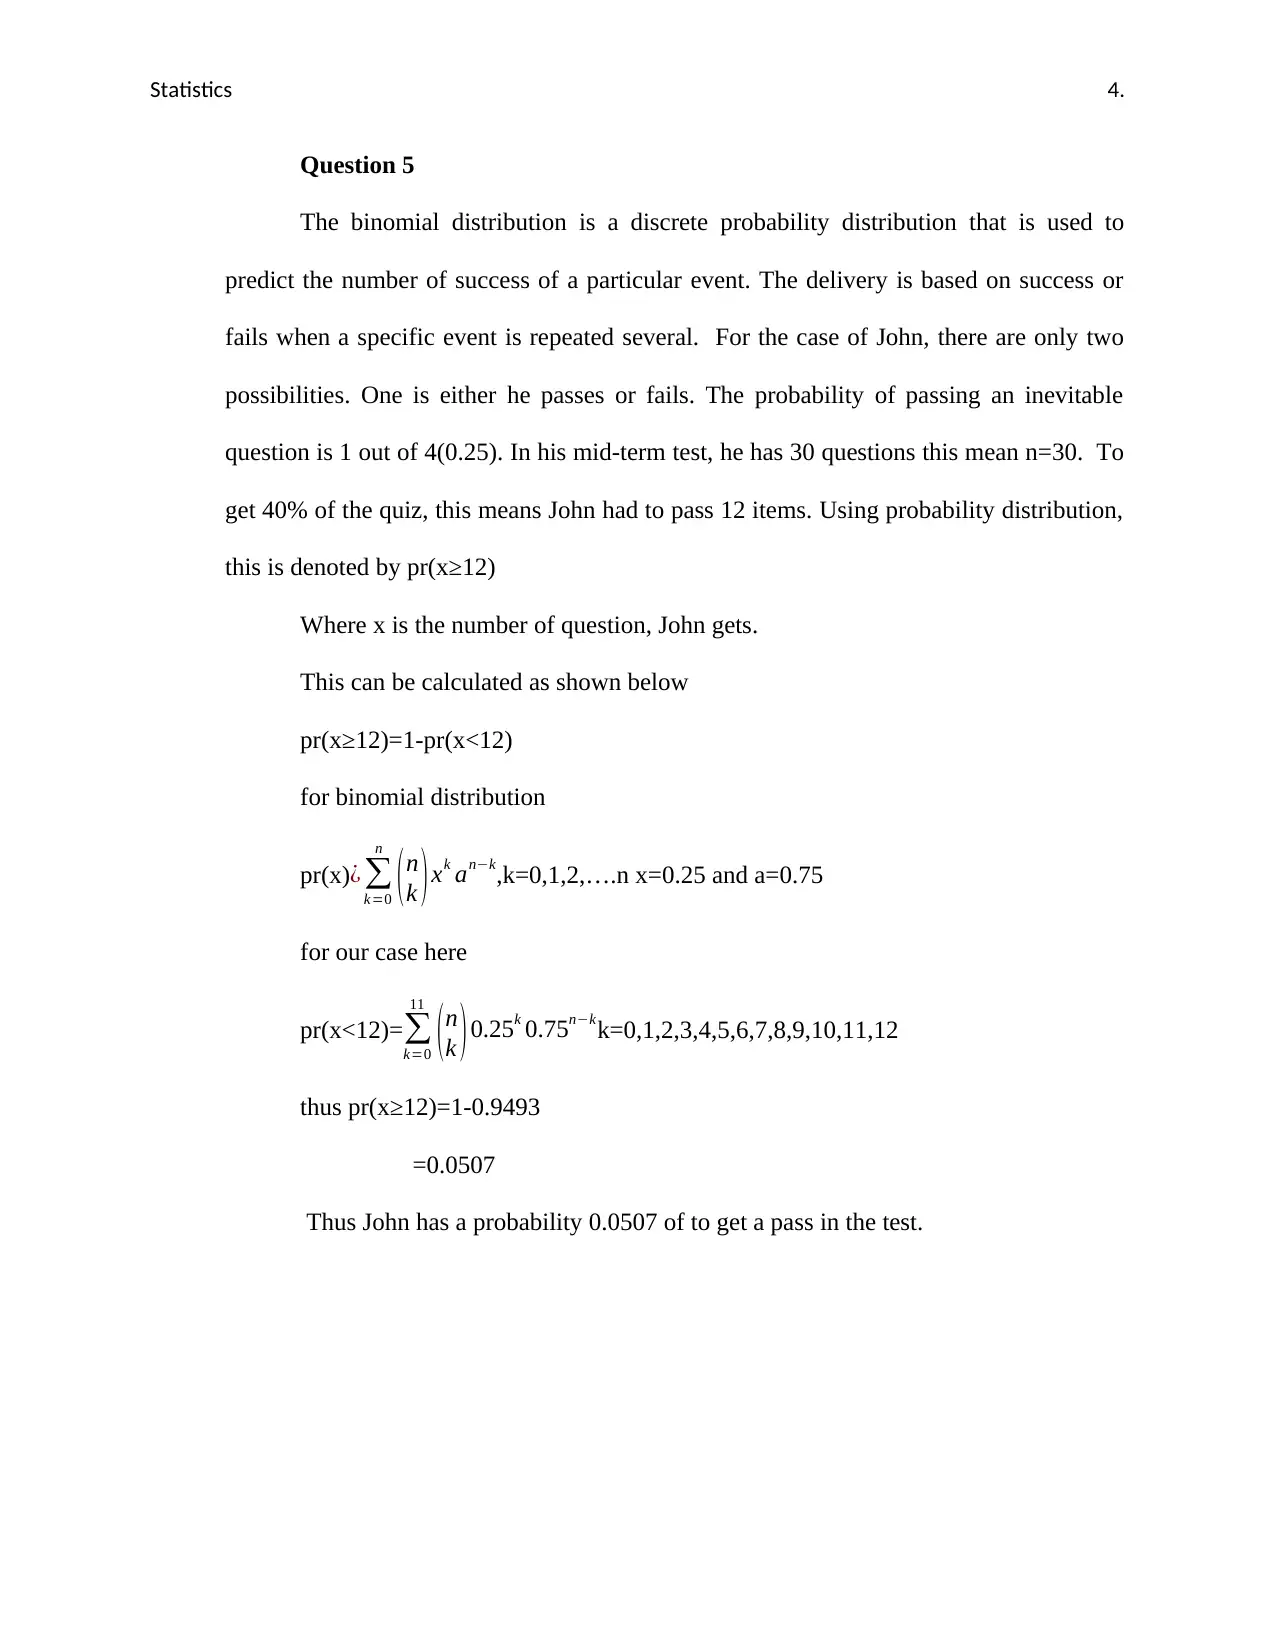
This statistics assignment addresses key concepts in statistical analysis and probability. The solution includes examples of coverage, non-response, and sample errors. It analyzes appliance electricity usage with a bar plot, drawing conclusions on home power consumption. The assignment also calculates mean, mode, median, and standard deviation. Furthermore, it explores the role of probability in business, including sales prediction and risk management, with a focus on probability distributions and their applications. The binomial distribution is applied to calculate the probability of a student passing a test, demonstrating practical applications of statistical methods.
Document Page
Running head: statistics
Name:
Subject:
Institution affiliation:
Date
tabler-icon-diamond-filled.svg

Paraphrase This Document

Need a fresh take? Get an instant paraphrase of this document with our AI Paraphraser
Document Page
Statistics 1.
Question 1.
a. Example of coverage error
Coverage bias
Case of the coverage error could occur if some employees are sampled twice.
b. Example of non-response error
Model is the difference between n=30 and N=500
Poorly constructed survey.
c. Example of sample error
Sample frame error
d. Case of measurement error
-Percentage error
Question2
type of appliance
percentag
e
air conditioning 18%
cloth dryers 5%
clothes
washer/others 24%
computer 1%
cooking 2%
dishwashers 2%
Document Page
Statistics 2.
freezers 2%
lighting 16%
refrigerations 9%
space heating 7%
water heating 8%
TVs and set-top
boxes 6%
a. Plot
air conditioning
cloth dryers
clothes washer/others
computer
cooking
dishwashers
freezers
lighting
refregerations
space heating
water heating
TVs and settob boxes
0%
5%
10%
15%
20%
25%
30%
percentage
Figure 1 electric appliance
We decide to use the bar plot since our data is comparative (Evans, 2014).
b. Conclusion
As shown in figure 1 above, there is a lot of people that use electricity to wash
clothes, air conditioning, and lighting.it is, therefore, to conclude the power is mainly
applied for home activities. In conclusion, there are a few homes that have or use a
Document Page
Statistics 3.
computer. It also evident that few homes do use electricity for cooking. Thus power
in the United States is meant for heavy home duties.
Question3
Y=0
Z=6
Using calculator
Mean=22.11
Mode=22
Media=22
Standard deviation=10.62676
Question4
Probability is the measure of likelihood. It measures how likely an individual
event will occur (Staff, 2019). In business, the expectation is used to identify all the
conceivable outcomes and odd that are random (Hanks, 2018). The credible issues range
from sales prediction to risk management. Probabilities distribution are applied in
anticipating future sales income. All companies rely on their current sales to predict
revenues. Thus it helps the company to predict the amount of purchase in a given period.
Probabilities help the business to predict positive outcomes in so doing it can avoid any
probable risk. Probability is used to analyze various business scenarios. This often
involves analysis of the worst-cases, best-cases, and most likely case. This change is a
vital model in business as it shows the possibilities of the outcome.
tabler-icon-diamond-filled.svg

Paraphrase This Document

Need a fresh take? Get an instant paraphrase of this document with our AI Paraphraser
Document Page
Statistics 4.
Question 5
The binomial distribution is a discrete probability distribution that is used to
predict the number of success of a particular event. The delivery is based on success or
fails when a specific event is repeated several. For the case of John, there are only two
possibilities. One is either he passes or fails. The probability of passing an inevitable
question is 1 out of 4(0.25). In his mid-term test, he has 30 questions this mean n=30. To
get 40% of the quiz, this means John had to pass 12 items. Using probability distribution,
this is denoted by pr(x≥12)
Where x is the number of question, John gets.
This can be calculated as shown below
pr(x≥12)=1-pr(x<12)
for binomial distribution
pr(x)¿
k=0
n
( n
k ) xk ank,k=0,1,2,….n x=0.25 and a=0.75
for our case here
pr(x<12)=
k=0
11
(n
k )0.25k 0.75nkk=0,1,2,3,4,5,6,7,8,9,10,11,12
thus pr(x≥12)=1-0.9493
=0.0507
Thus John has a probability 0.0507 of to get a pass in the test.
Document Page
Statistics 5.
References
Evans, W., (2014). Bar 1-Visibility Graphs and their relation to other Nearly Planar Graphs.
Journal of Graph Algorithms and Applications, 721-739.
Hanks, G. (2018, May 4). The Role of Probability Distribution in Business Management.
Retrieved from yourbusiness.azcentral.com: https://yourbusiness.azcentral.com/role-
probability-distribution-business-management-29131.html
Document Page
Statistics 6.
Staff, y. (2019, June 3). How to Calculate Probability. Retrieved from www.wikihow.com:
https://www.wikihow.com/Calculate-Probability
chevron_up_icon
1 out of 7
circle_padding
hide_on_mobile
zoom_out_icon
[object Object]