Statistics and Probability: Assignment on Data Analysis

Verified

Added on  2023/06/05

|8
|1512
|419
Homework Assignment
AI Summary
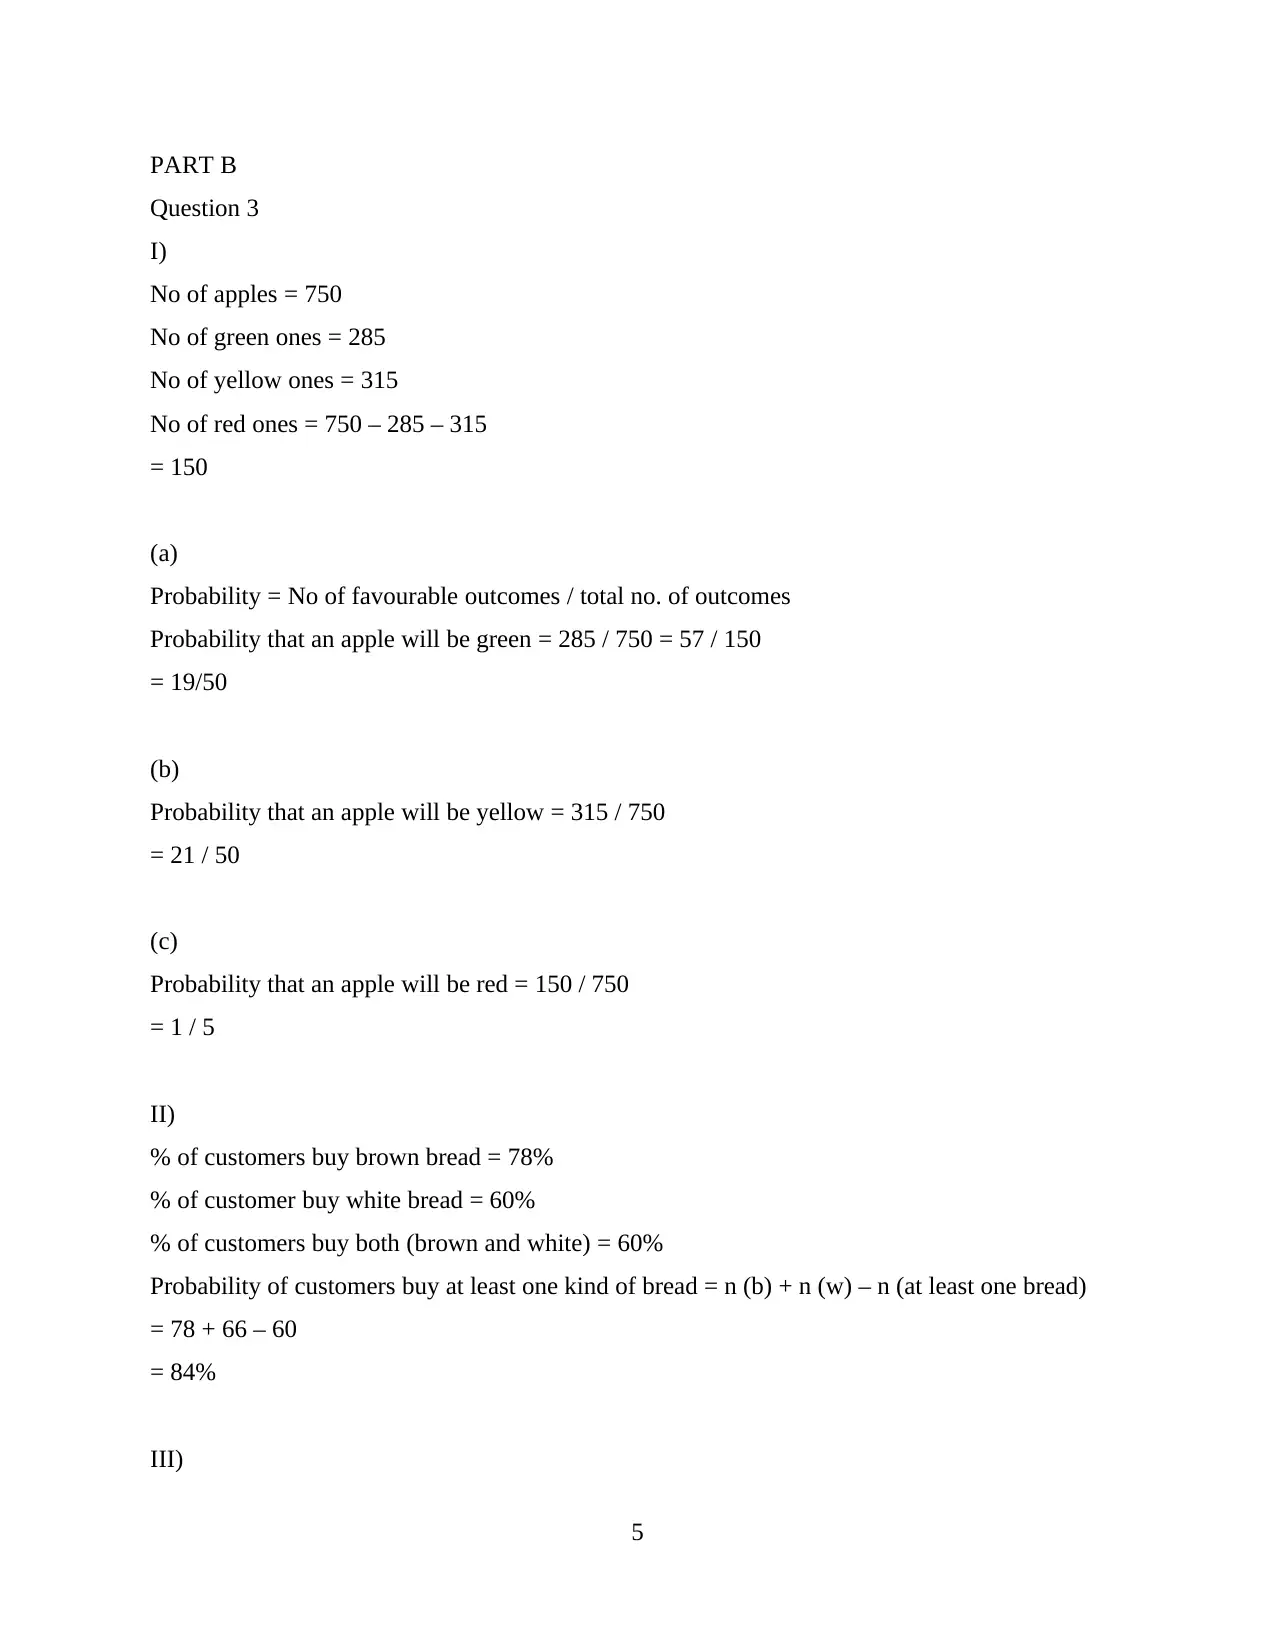
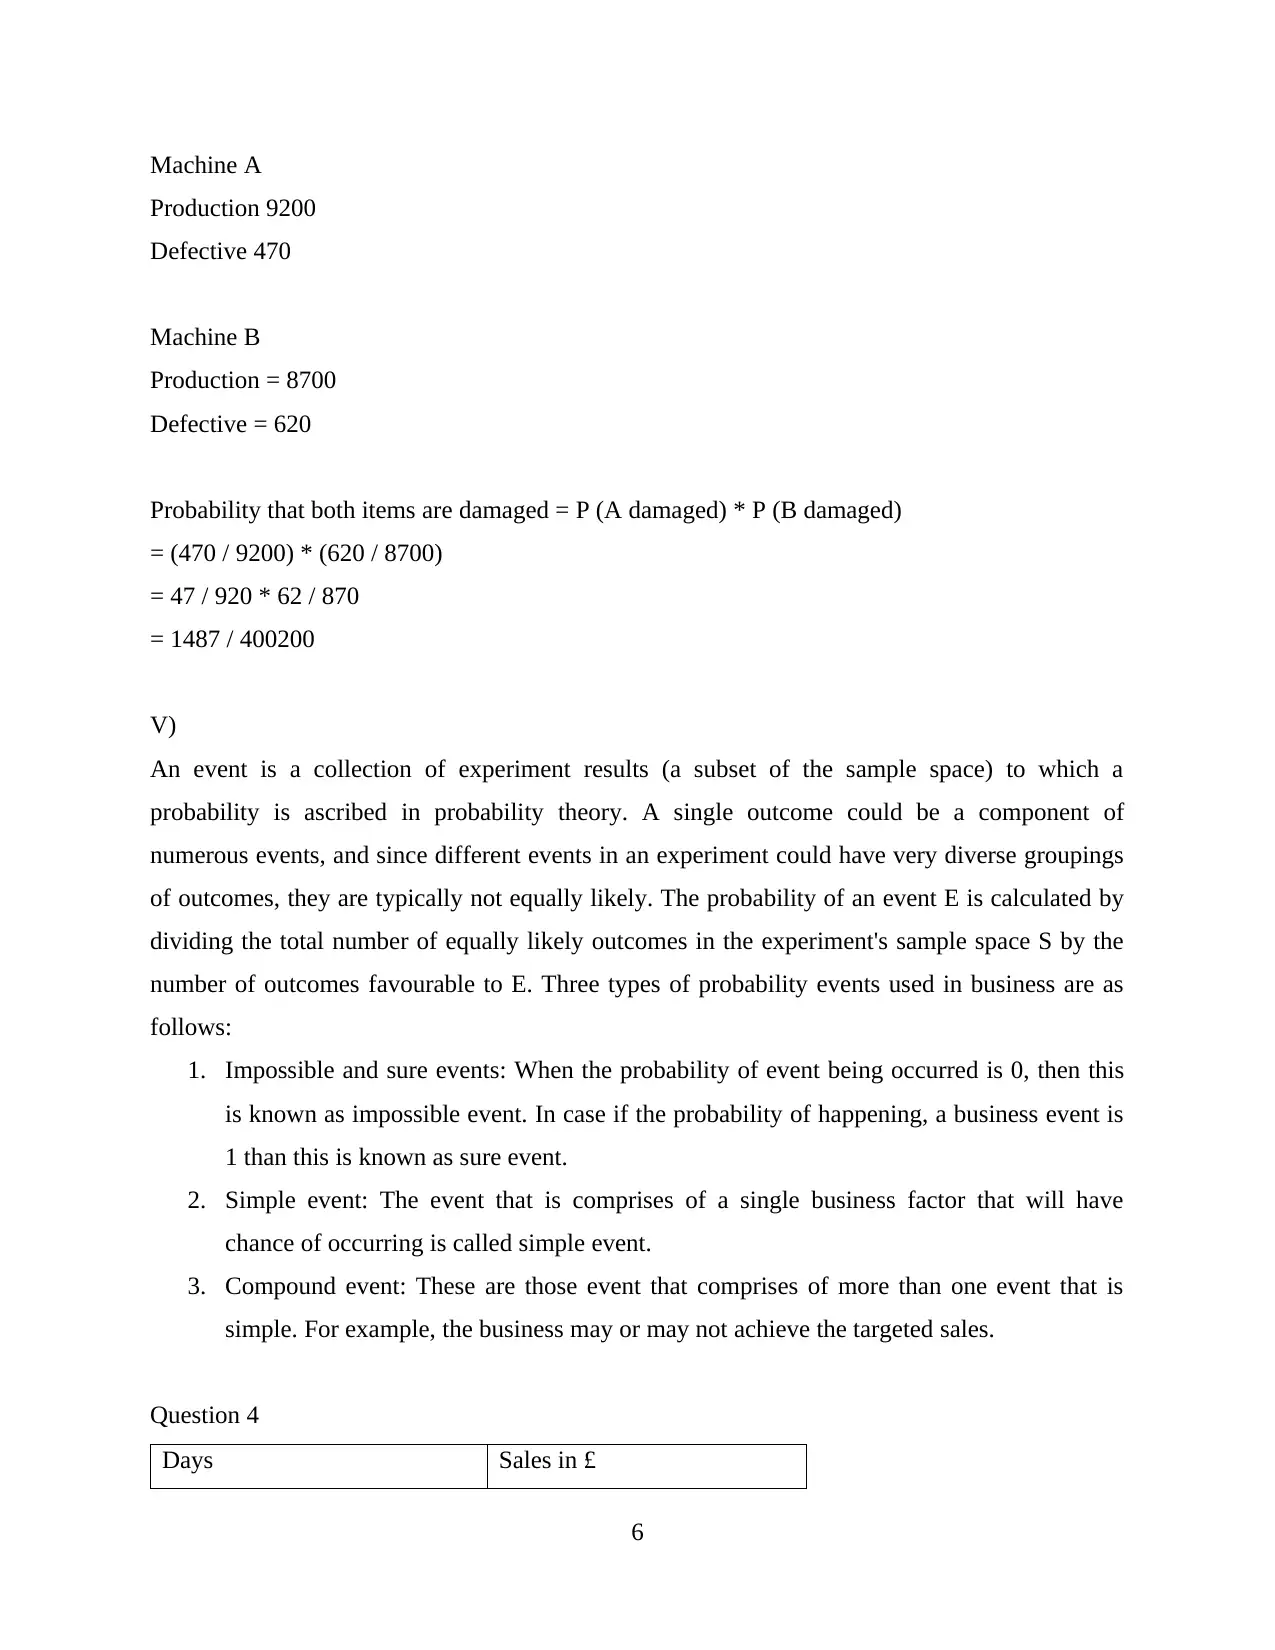
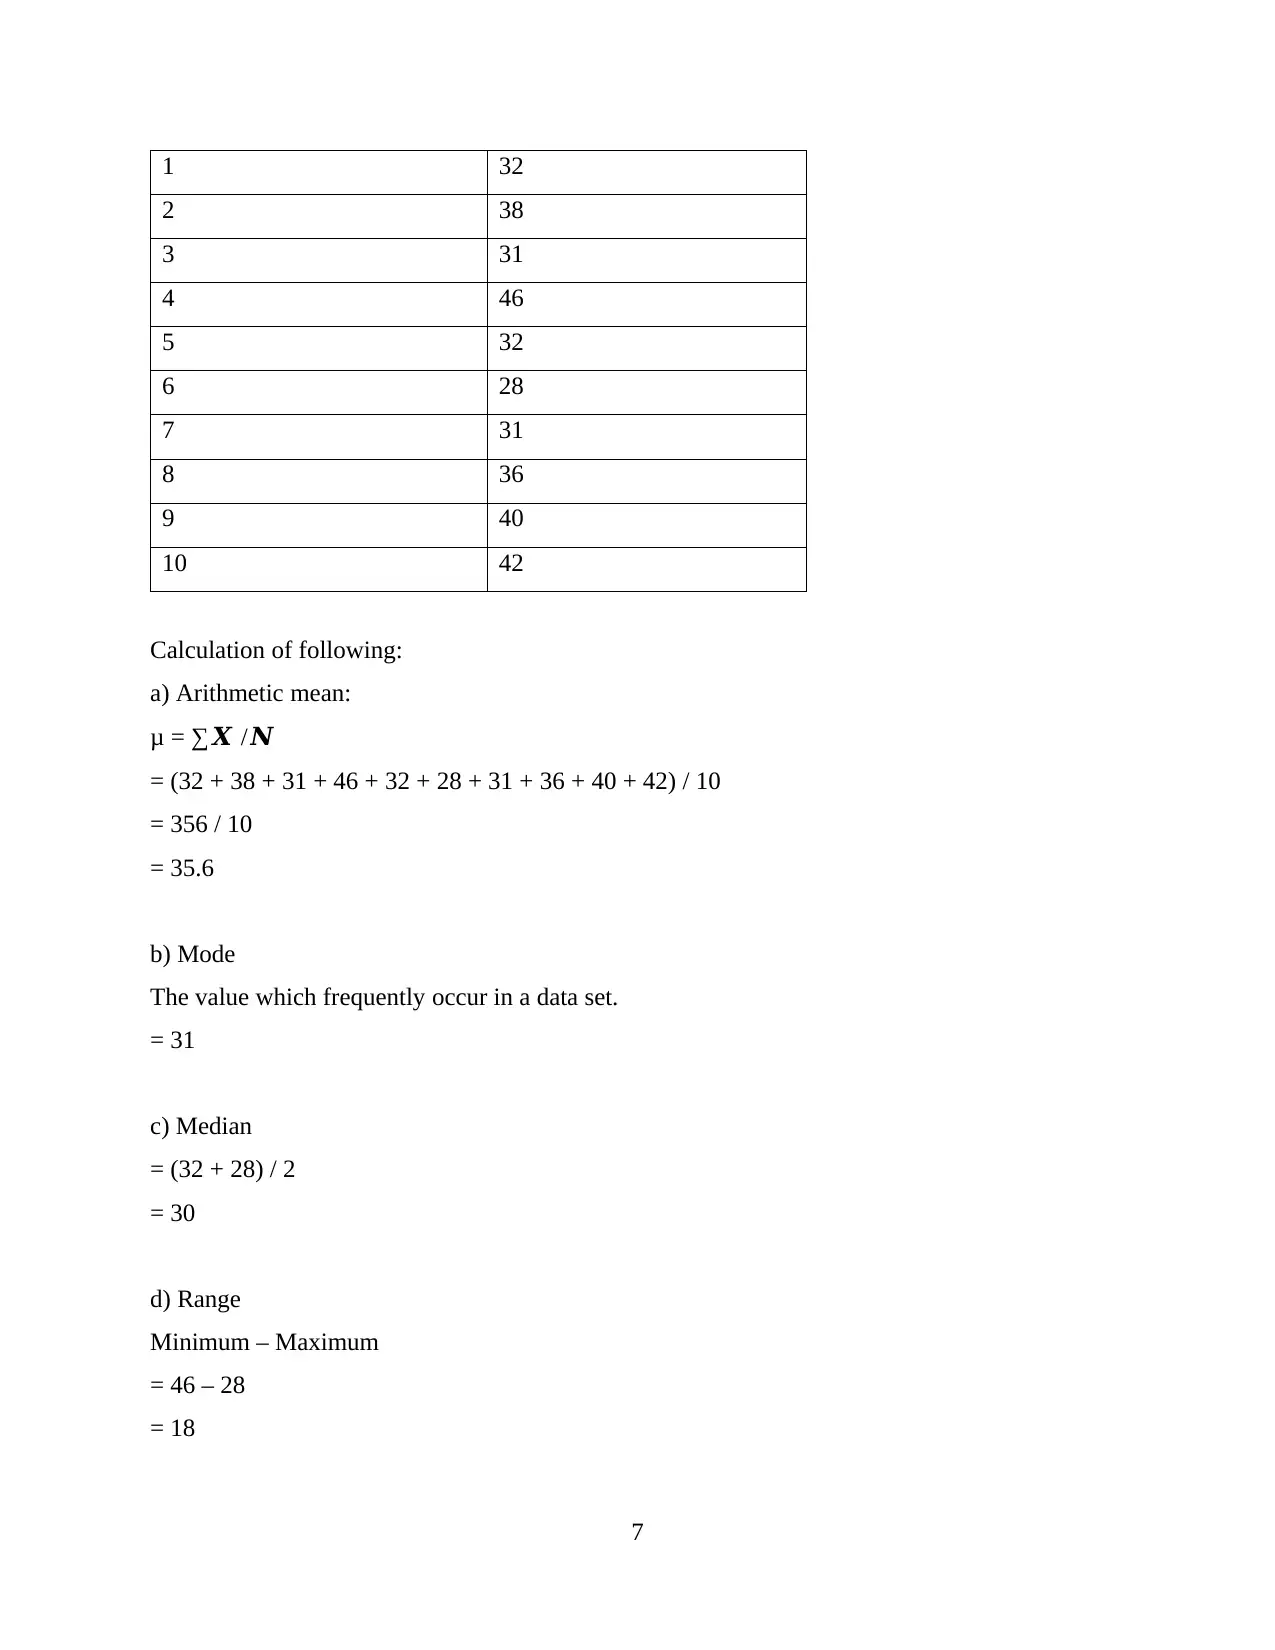
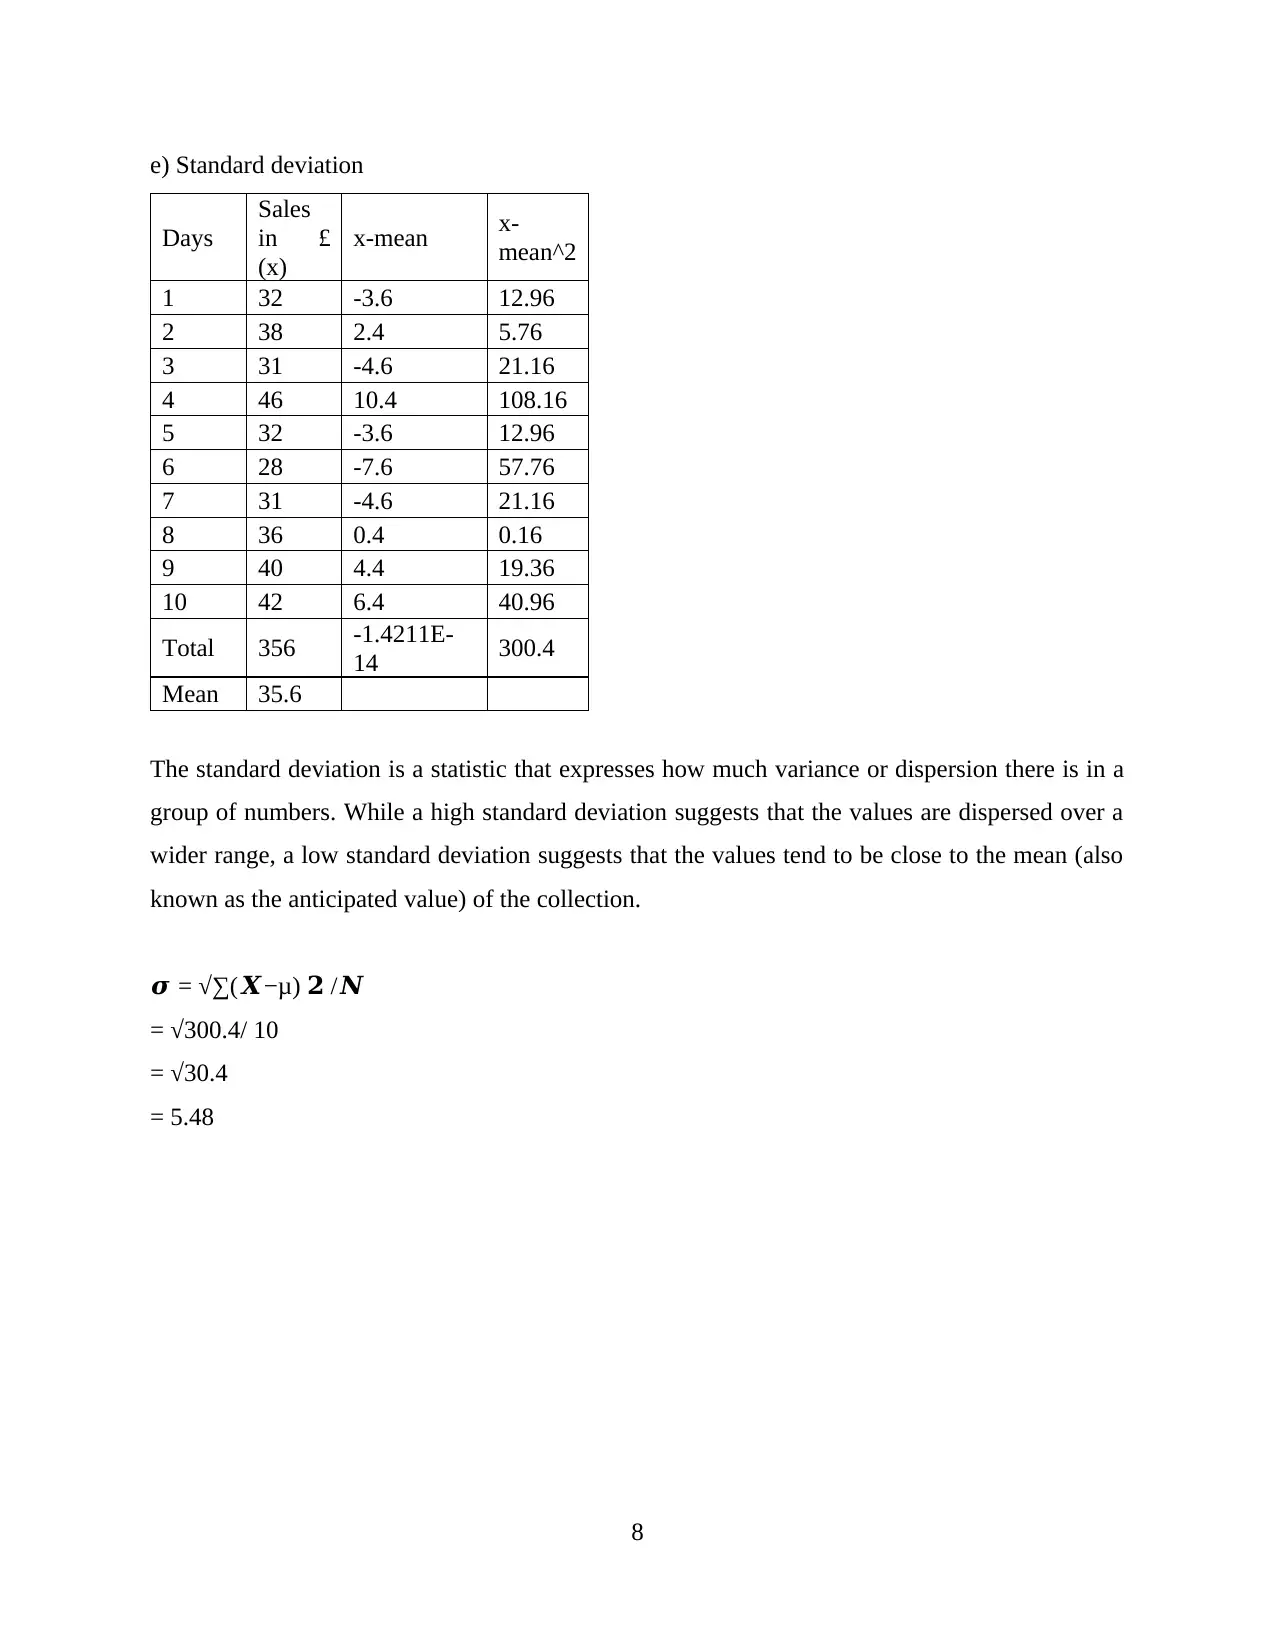
This document presents a comprehensive solution to a statistics and probability assignment. Part A covers a range of calculations including arithmetic operations, fractions, and mixed number operations. It also includes calculations involving percentages, and the application of probability models in business scenarios, such as customer service and product design. Part B focuses on probability calculations related to different scenarios, including calculating the probability of events like apple colors, and customer purchasing behavior. The solution includes worked examples of calculating probabilities, and explores different types of probability events. The assignment also involves calculating arithmetic mean, mode, median, range and standard deviation from a given dataset. The assignment provides a detailed overview of the concepts and their application in real-world scenarios, making it a valuable resource for students studying statistics and probability.
Document Page
PART A
Question 1
I)
a)
574 / (52 + 42) (3 * 2 * 3)
= 574 / (25 + 16) (6 + 3)
= 574 / (41) (9)
= 574 / 369
= 1.55
b)
(4335 / 172) (42 / 8)
= (43335 / 289) (16 / 8)
= (15) (2)
= 30
c)
960 / 8 (1 + 2 * 2) - 202
= 960 / 8(1+4) – 400
= 960 / 8 (5) – 400
= 960 / 40 – 400
= 24 – 400
= -376
d)
43 * [(2*5*2 + 22) / (5 + 33)]
= 64 * [(20 + 4) / (5 + 27)]
= 64 * [24 / 32]
= 64 * 0.75
= 48
1
tabler-icon-diamond-filled.svg

Secure Best Marks with AI Grader

Need help grading? Try our AI Grader for instant feedback on your assignments.
Document Page
e)
[216 / (10 + 2)] / 32 + 9 – 2 + [(82 * 2) 2]
= [216 / 12] / 9 + 9 – 2 + [(64 * 2) 2]
= 18 / 9 + 9 – 2 + 256
2 + 9 – 2 + 256
= 11 + 254
265
II)
a)
(-44) * (-4)
= 176 (-) * (-) = (+)
b)
26 + (-16)
= 26 – 16
= 10
c)
(-64) / 8 – (-9)
= - 8 + 9
= 1
III)
a)
2/5 + 3/7
= (2*7) + (5*3) / 5*7
= 14 + 15 / 35
= 29 / 35
= 0.828
2
Document Page
b)
5/6 – 2/5
= (5*5) – (6*2) / 6*5
= 25 – 12 / 30
= 13/ 30
= 0.43
c)
5 1 /4 + 2 2 /5
= (4 * 5 + 1 / 4) + (5 * 2 + 2 / 5)
= 21/4 + 12/5
= 21*5 + 12*4 / 5*4
= (105 + 48) / 20
= 153 / 20
= 7.65
IV)
(a) Calculation of blue shirts
= 72500 * 26.8%
= 19430
(b) Calculation of number of students not based in UK
No of students based in UK
= Total students * 21.6%
= 32000 * 21.6%
= 6912
No of students based in UK = 32000 – 6912
= 25088
V)
(a) Calculation of investment contributed by each investor:
3
Document Page
Total investment = £188100
A’s investment = £188100 /18 * 6 = £62700
B’s investment = £188100 / 18 * 5 = £52250
C’s investment = £188100 / 18 * 3 = £31350
D’s investment = £188100 / 18 * 4 = £41800
(b) Calculation of individual investment made by x and z as well as total amount of investment
Total amount of investment = (Y’s investment amount / 5) * 10
= (£25000 / 5) * 10
= £50000
X’s invested amount = (£50000 / 10) * 2 = £10000
Z’s invested amount = (£50000 / 10) * 3 = £15000
V)
Many companies use probability and uncertainty concepts to inform their business
decisions. Businesses can tremendously benefit from using probability models to improve their
policies and come to sound conclusions. These probabilistic techniques, despite their complexity,
can boost a company's profitability and success. Customer service can be delivered physically,
like at a bank window, or virtually, such through an Internet system. Probability models can aid a
business in developing customer service policies in either scenario. The models from queuing
theory are crucial for these policies. Through the use of these models, businesses can assess the
effectiveness of their present customer service procedures and make adjustments to improve
them.
The design and organisation of several components in a system is a component of product
design, particularly the design of intricate items like computing systems. In order to help
designers, model their goods in terms of the likelihood that they will malfunction or fail,
reliability theory offers a probabilistic model. This paradigm enables more effective design and
enables companies to create warranties and return policies to their fullest potential.
4
tabler-icon-diamond-filled.svg

Secure Best Marks with AI Grader

Need help grading? Try our AI Grader for instant feedback on your assignments.
Document Page
PART B
Question 3
I)
No of apples = 750
No of green ones = 285
No of yellow ones = 315
No of red ones = 750 – 285 – 315
= 150
(a)
Probability = No of favourable outcomes / total no. of outcomes
Probability that an apple will be green = 285 / 750 = 57 / 150
= 19/50
(b)
Probability that an apple will be yellow = 315 / 750
= 21 / 50
(c)
Probability that an apple will be red = 150 / 750
= 1 / 5
II)
% of customers buy brown bread = 78%
% of customer buy white bread = 60%
% of customers buy both (brown and white) = 60%
Probability of customers buy at least one kind of bread = n (b) + n (w) – n (at least one bread)
= 78 + 66 – 60
= 84%
III)
5
Document Page
Machine A
Production 9200
Defective 470
Machine B
Production = 8700
Defective = 620
Probability that both items are damaged = P (A damaged) * P (B damaged)
= (470 / 9200) * (620 / 8700)
= 47 / 920 * 62 / 870
= 1487 / 400200
V)
An event is a collection of experiment results (a subset of the sample space) to which a
probability is ascribed in probability theory. A single outcome could be a component of
numerous events, and since different events in an experiment could have very diverse groupings
of outcomes, they are typically not equally likely. The probability of an event E is calculated by
dividing the total number of equally likely outcomes in the experiment's sample space S by the
number of outcomes favourable to E. Three types of probability events used in business are as
follows:
1. Impossible and sure events: When the probability of event being occurred is 0, then this
is known as impossible event. In case if the probability of happening, a business event is
1 than this is known as sure event.
2. Simple event: The event that is comprises of a single business factor that will have
chance of occurring is called simple event.
3. Compound event: These are those event that comprises of more than one event that is
simple. For example, the business may or may not achieve the targeted sales.
Question 4
Days Sales in £
6
Document Page
1 32
2 38
3 31
4 46
5 32
6 28
7 31
8 36
9 40
10 42
Calculation of following:
a) Arithmetic mean:
μ = ∑𝑿 /𝑵
= (32 + 38 + 31 + 46 + 32 + 28 + 31 + 36 + 40 + 42) / 10
= 356 / 10
= 35.6
b) Mode
The value which frequently occur in a data set.
= 31
c) Median
= (32 + 28) / 2
= 30
d) Range
Minimum – Maximum
= 46 – 28
= 18
7
tabler-icon-diamond-filled.svg

Paraphrase This Document

Need a fresh take? Get an instant paraphrase of this document with our AI Paraphraser
Document Page
e) Standard deviation
Days
Sales
in £
(x)
x-mean x-
mean^2
1 32 -3.6 12.96
2 38 2.4 5.76
3 31 -4.6 21.16
4 46 10.4 108.16
5 32 -3.6 12.96
6 28 -7.6 57.76
7 31 -4.6 21.16
8 36 0.4 0.16
9 40 4.4 19.36
10 42 6.4 40.96
Total 356 -1.4211E-
14 300.4
Mean 35.6
The standard deviation is a statistic that expresses how much variance or dispersion there is in a
group of numbers. While a high standard deviation suggests that the values are dispersed over a
wider range, a low standard deviation suggests that the values tend to be close to the mean (also
known as the anticipated value) of the collection.
𝝈 = √∑(𝑿−μ) 𝟐 /𝑵
= √300.4/ 10
= √30.4
= 5.48
8
chevron_up_icon
1 out of 8
circle_padding
hide_on_mobile
zoom_out_icon
logo.png

Your All-in-One AI-Powered Toolkit for Academic Success.

Available 24*7 on WhatsApp / Email

[object Object]