Probability & Stats: Hypothesis Testing and Distributions

Verified

Added on  2023/04/25

|8
|1004
|492
Homework Assignment
AI Summary
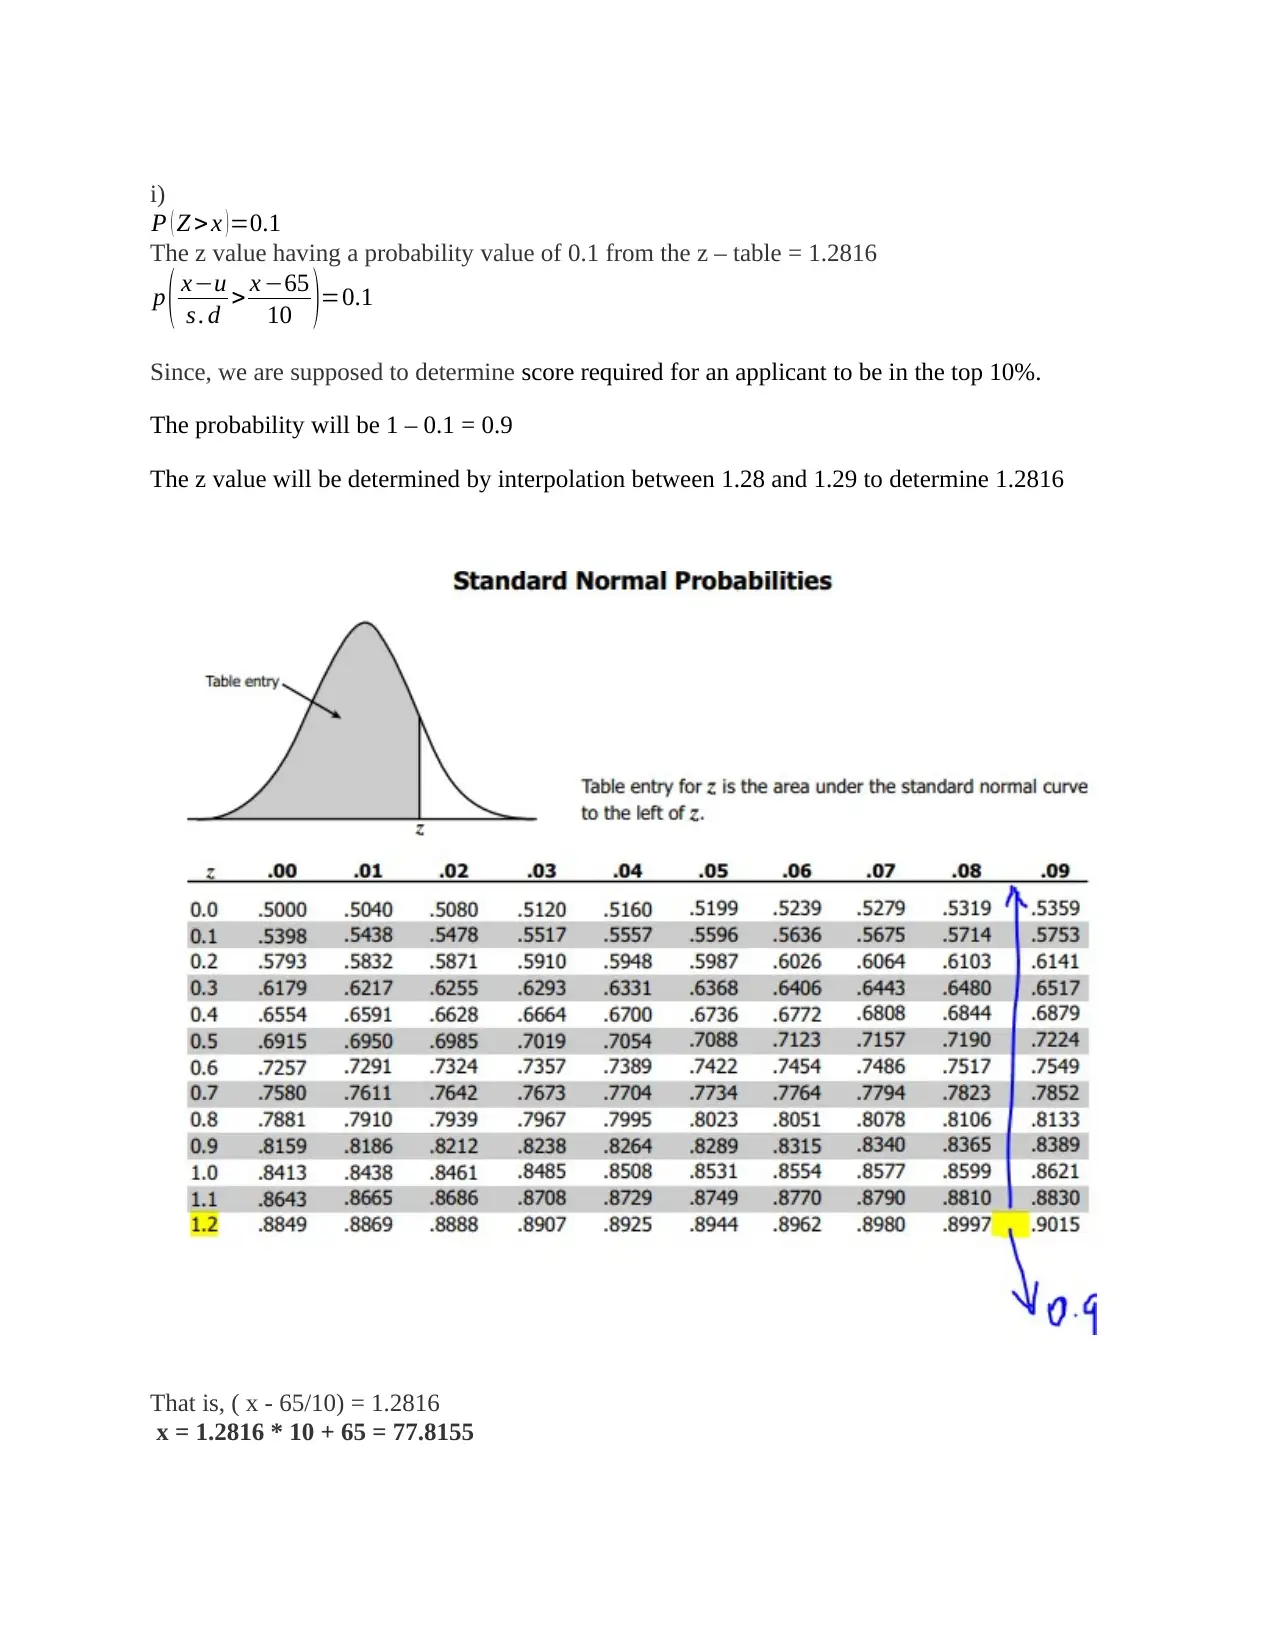
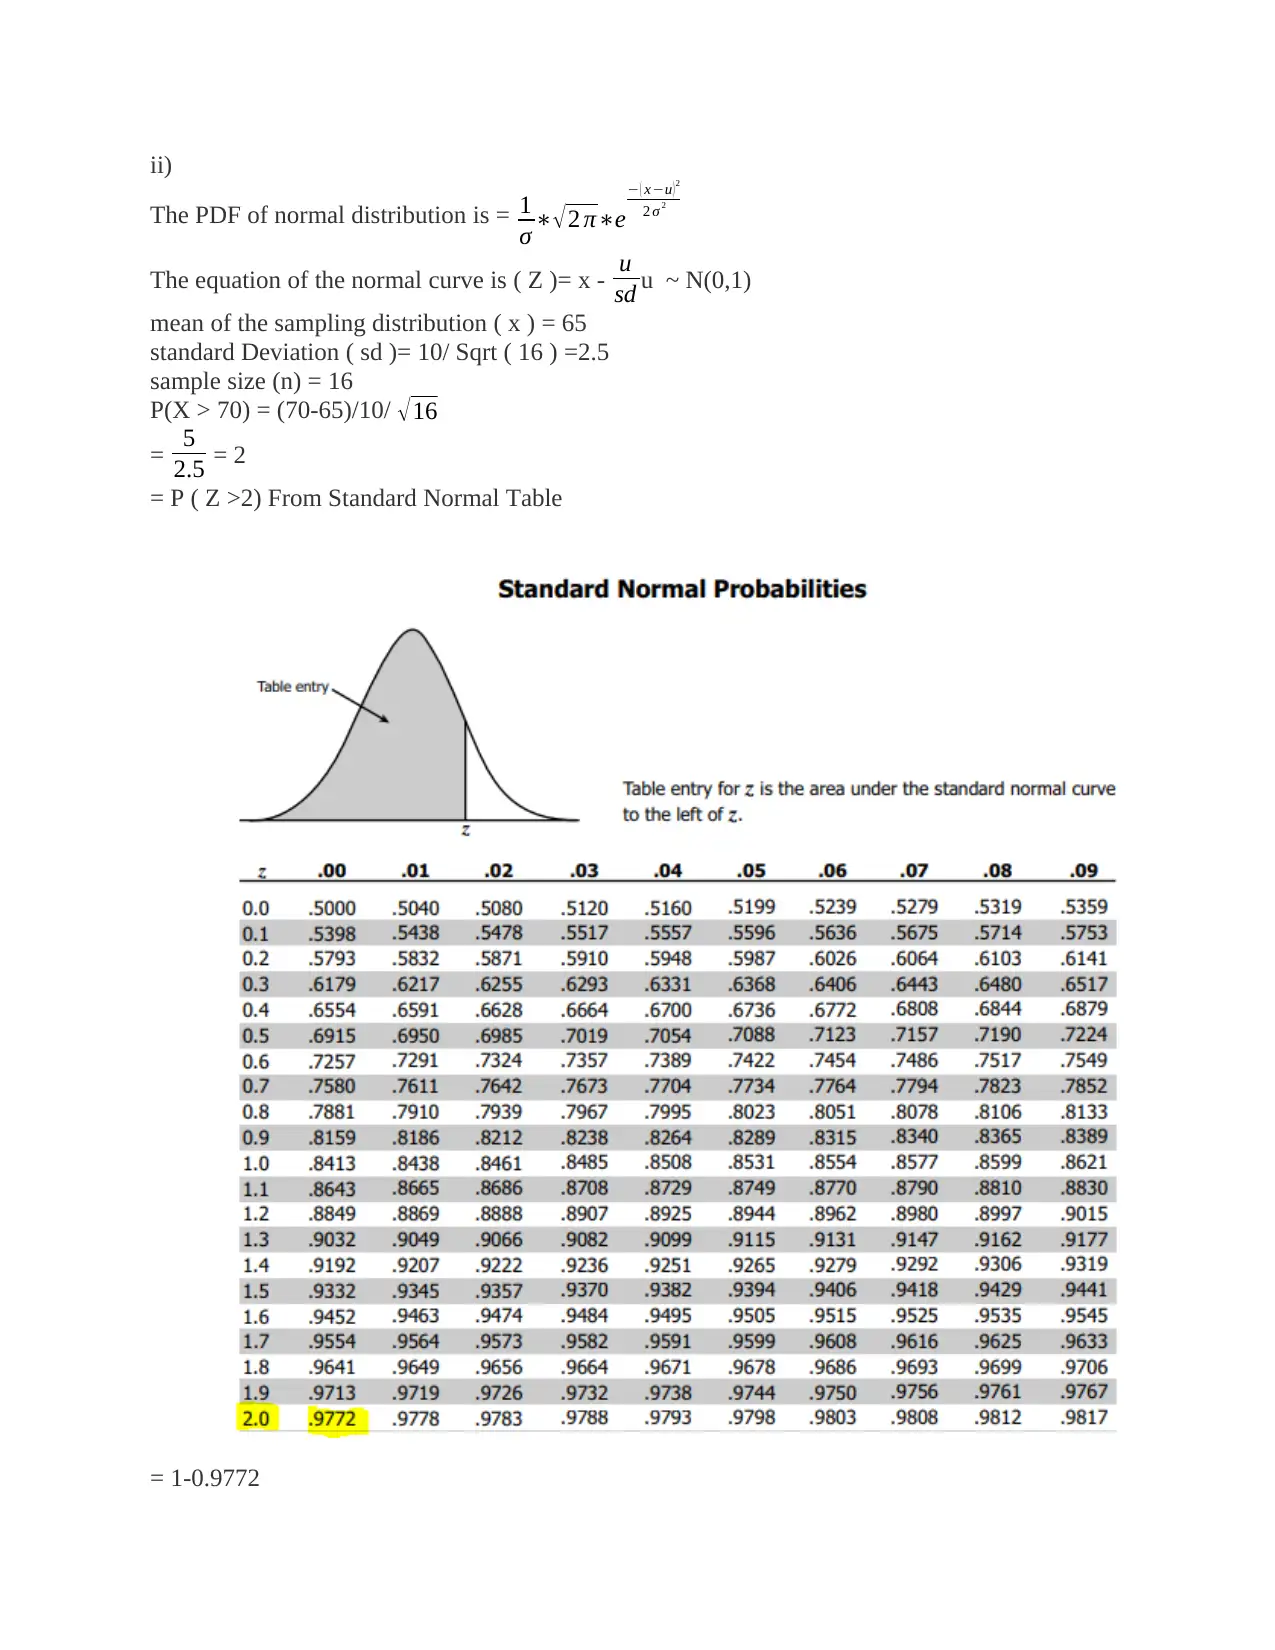
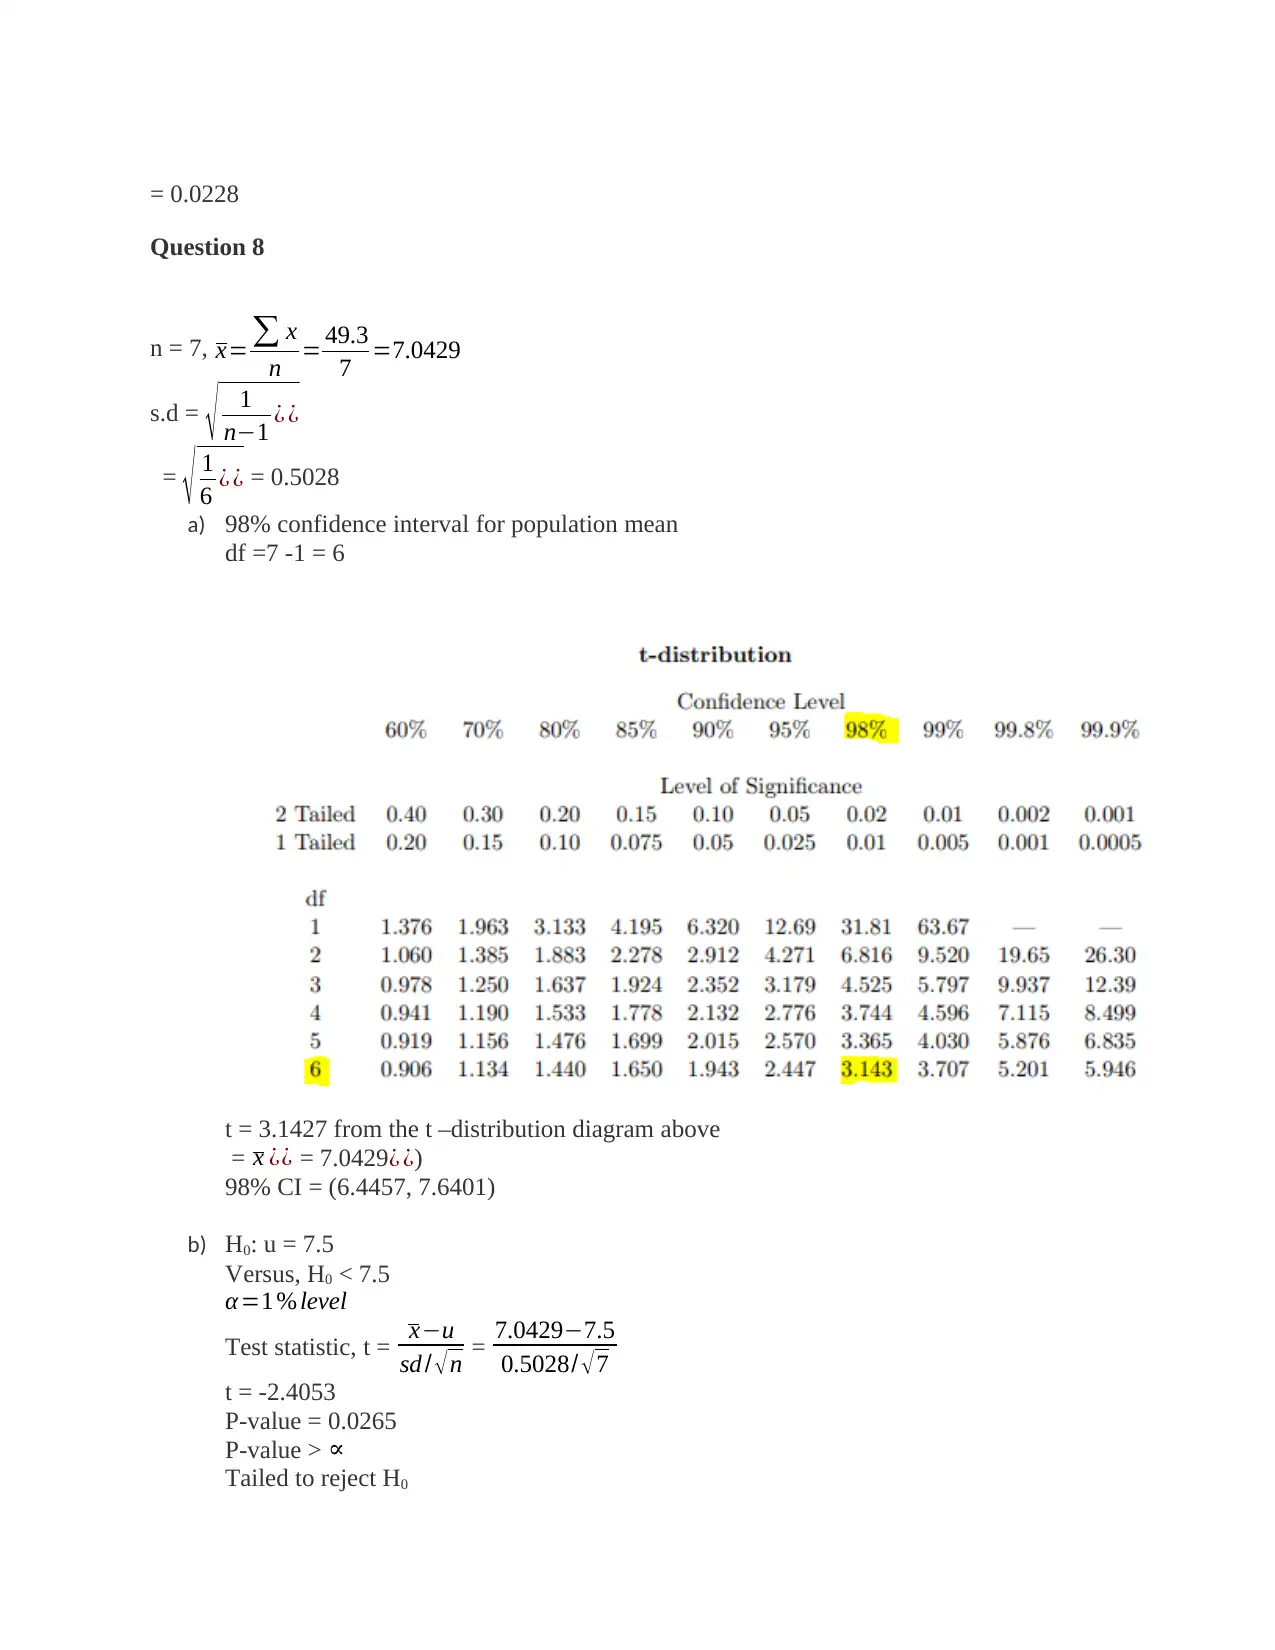
This assignment provides detailed solutions to a range of probability and statistics problems. It includes calculations for confidence intervals, hypothesis testing, and normal distribution applications. Specifically, it addresses questions related to mobile phone user charges, biased coin tosses, binomial random variables, and determining appropriate sample sizes. The solutions demonstrate the application of statistical formulas and z-table values to calculate probabilities, standard deviations, and critical values for hypothesis tests. The document also covers the use of normal approximation and the Central Limit Theorem (CLT) to solve problems related to sample means and distributions. Desklib offers a variety of solved assignments and study resources for students.
Document Page
Question 4
n = 277
x = 69
^p= x
n = 69
277 =0.2491
79.6% confidence interval for portion of adult female shopper who request a rain check in such
situation
= ^p ¿ ¿α/2 * ^p(1 ^p)
n )
Zα/2 value of 79.6% confidence level is determined as follows;
The confidence level would be subtracted from 1 and the result divided by two in order to find
the value of alpha level which will be representing the one tail area.
(1 – 0.796)/2 = 0.102
Subtract the result from one, the area is then looked at the middle of the z – table in order to
determine the value of the z score.
1 – 0.102 = 0.898
Checking it at z – table as shown
Z – score = 1.27) as highlighted on the z- table diagram below)
tabler-icon-diamond-filled.svg

Paraphrase This Document

Need a fresh take? Get an instant paraphrase of this document with our AI Paraphraser
Document Page
= ^p ¿ ¿α/2 * ^p(1 ^p)
n )
= 0.2491 ( 1.27 0.2491(10.2491)
277 ) ¿+ ¿¿ ¿
= 0.2491 0.33002 ¿+¿ ¿ ¿
79.6% CI = (0.2821, 0.2161)
b)
^p= 69
277 =0.2491
q = 1 - ^p = 1 – 0.2491 = 0.7509
Margin error = 0.1/2 = 0.05
For 95% confidence, the value of z will be equivalent to 1.96
Document Page
Size of sample required will be equivalent to
n = pq* ( z score
E )
2
= 0.2491 * 0.7509* ( 1.96
0.05 )2
n = 287.427
n 287 (rounded off to next whole number)
Question 7
P(number 2 or less) = 2 / 6 = 1 / 3
Mean = np = 500 * 1/3 = 166.6667
Standard deviation = (np(1 p))
= ( 5001
3 2/3)
= 10.5409
Using normal approximation.,
P( X x) = P( Z < x+0.5 - mean / SD)
So,
P(X 150) = P( Z ¿150.5 - 166.6667 / 10.5409))
= P (Z -1.5337)
From the z-table shown on the diagram below, the probability will be equivalent to;
Document Page
P(X 150¿= 0.0630
b)
The PDF of normal distribution is = 1
σ 2 πe
( xu )2
2 σ 2
The equation of the normal curve is ( Z )= x - u
sd u ~ N(0,1)
The mean ( u ) = 65
standard Deviation ( sd )= 10
tabler-icon-diamond-filled.svg

Paraphrase This Document

Need a fresh take? Get an instant paraphrase of this document with our AI Paraphraser
Document Page
i)
P ( Z > x )=0.1
The z value having a probability value of 0.1 from the z – table = 1.2816
p ( xu
s . d > x 65
10 )=0.1
Since, we are supposed to determine score required for an applicant to be in the top 10%.
The probability will be 1 – 0.1 = 0.9
The z value will be determined by interpolation between 1.28 and 1.29 to determine 1.2816
That is, ( x - 65/10) = 1.2816
x = 1.2816 * 10 + 65 = 77.8155
Document Page
ii)
The PDF of normal distribution is = 1
σ 2 πe
( xu )2
2 σ 2
The equation of the normal curve is ( Z )= x - u
sd u ~ N(0,1)
mean of the sampling distribution ( x ) = 65
standard Deviation ( sd )= 10/ Sqrt ( 16 ) =2.5
sample size (n) = 16
P(X > 70) = (70-65)/10/ 16
= 5
2.5 = 2
= P ( Z >2) From Standard Normal Table
= 1-0.9772
Document Page
= 0.0228
Question 8
n = 7, x= x
n = 49.3
7 =7.0429
s.d = 1
n1 ¿ ¿
= 1
6 ¿ ¿ = 0.5028
a) 98% confidence interval for population mean
df =7 -1 = 6
t = 3.1427 from the t –distribution diagram above
= x ¿¿ = 7.0429¿ ¿)
98% CI = (6.4457, 7.6401)
b) H0: u = 7.5
Versus, H0 < 7.5
α =1 % level
Test statistic, t = xu
sd / n = 7.04297.5
0.5028/ 7
t = -2.4053
P-value = 0.0265
P-value >
Tailed to reject H0
tabler-icon-diamond-filled.svg

Paraphrase This Document

Need a fresh take? Get an instant paraphrase of this document with our AI Paraphraser
Document Page
There is no evidence to support the claim that population less than 7.5
Question 8
a) P ( 0.5< x <2 )x 3
= P [ ( 0.5< x< 2 ) ( x 3 ) ]
p ( x 3)
= P [0.5< x< 2]
P( x 3)
=

0.5
1
x
2 dx+
1
2
4x
6 dx

0
1
x
2 dx +
1
3
4x
6 dx
= 1
4 ( 10.25 )+ 1
6 ¿ ¿
=
0.1875+2.5
6
1
4 + 4
6
= 0.6591
b) As Xi’s are iid random variables
E(T) = E¿i)
= 81 * E ¿i) = 5
381=135
Var(T) = Var¿i)
= 812 * Var*Xi) = 812 * Var(x)
= 812*Var(Xi) = 812 * Var(x)
= 812 * 13/18
= 4738.56
As n = sample size = 81 > 70
So we use CLT
P(125 < T < 140) = P( 125135
4738.5 < T 135
4738.5 < 140135
4738.5 )
T 135
4738.5 =Z
¿ ф ( 0.073 )ф(0.145) N (0 , 1)
= 0.5291 – 0.4424
= 0.0867
chevron_up_icon
1 out of 8
circle_padding
hide_on_mobile
zoom_out_icon
[object Object]