Vectors and Matrices: Statistics and Probability Homework Assignment

Verified

Added on  2021/02/19

|23
|3727
|94
Homework Assignment
AI Summary
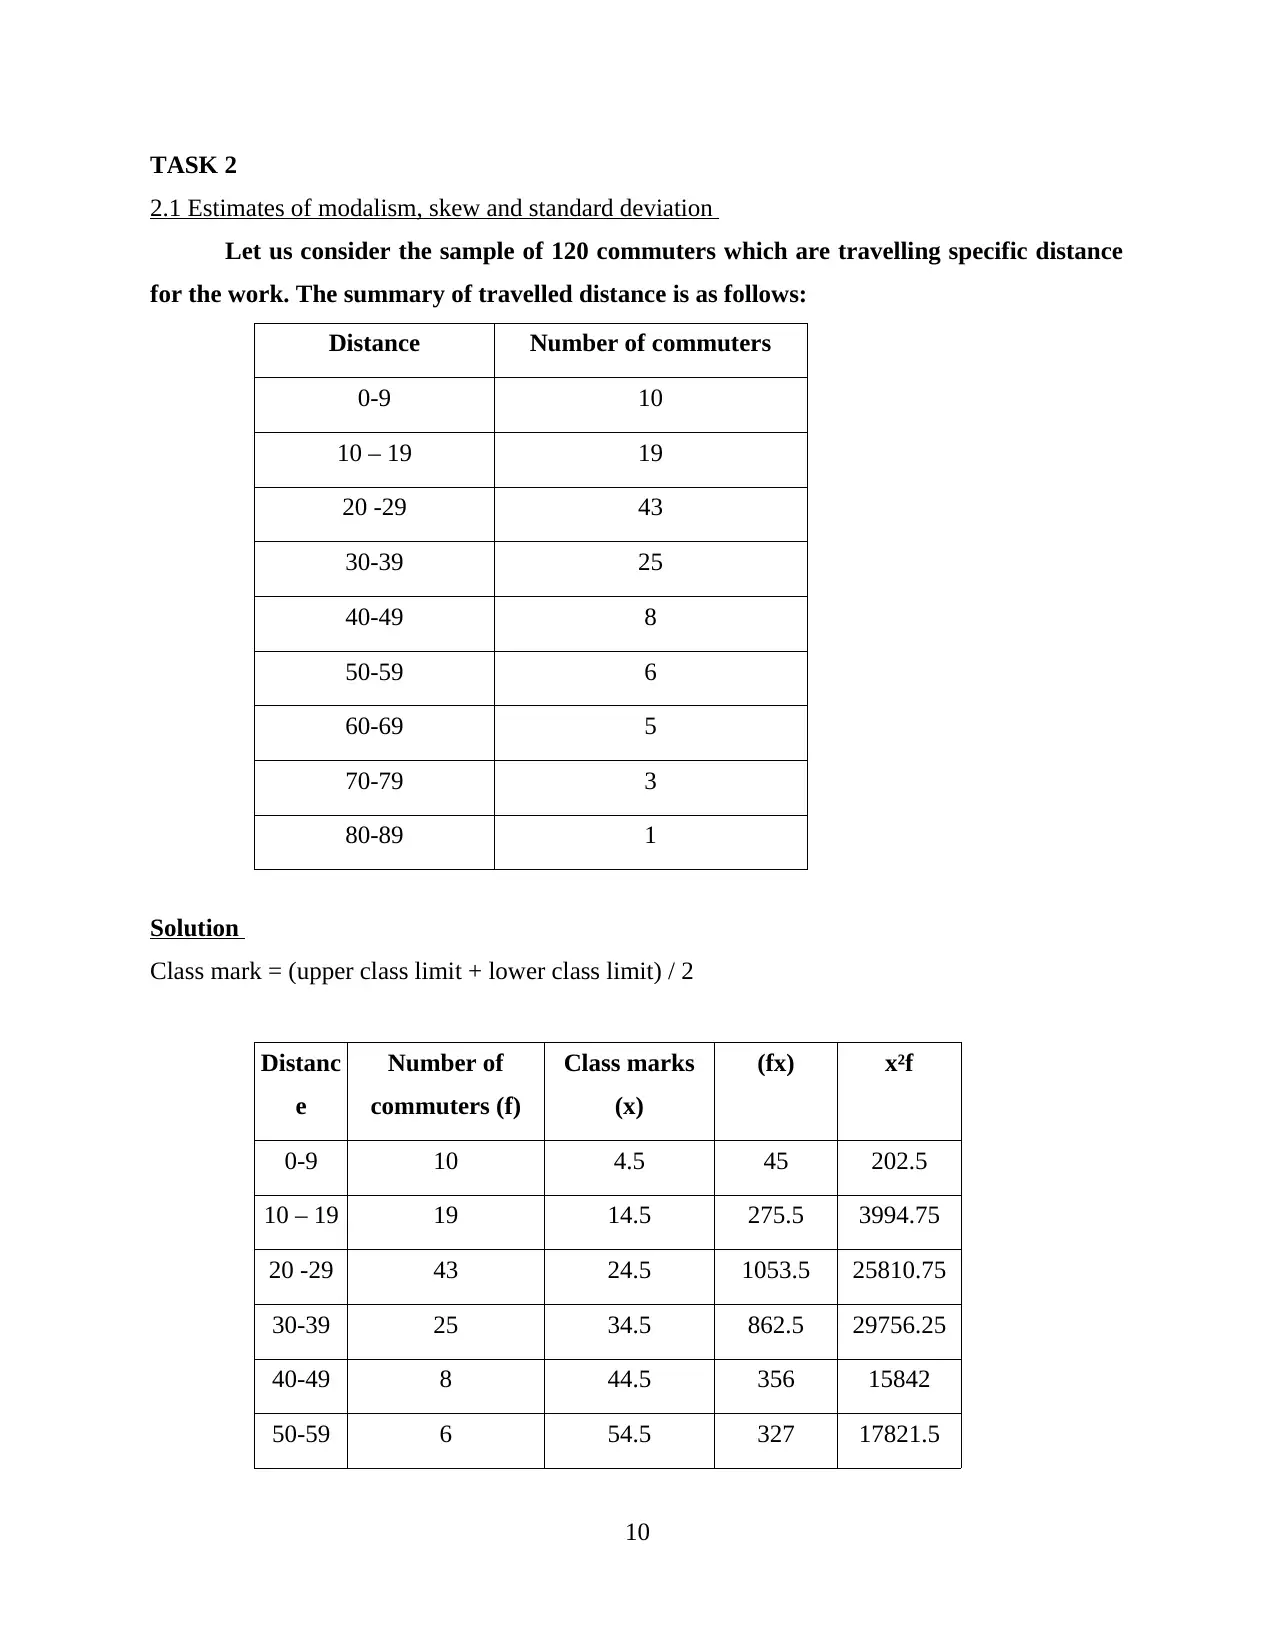
This document presents a comprehensive solution to a statistics assignment centered on vectors and matrices. The assignment covers a range of probability concepts, including mutually exclusive and conditional probabilities, relative frequencies, and combined probabilities. It explores binomial, Poisson, and Gaussian distributions, providing solutions to problems involving nCr, nPr, and n!. Furthermore, the assignment delves into statistical analysis, including estimates of modalism, skew, and standard deviation, along with confidence intervals, standard error, and the implications of the central limit theorem (CLT). The solution includes detailed calculations and interpretations of statistical results, offering a thorough understanding of the subject matter. The assignment also includes a frequency table and its analysis using class marks, fx, and x²f, to calculate statistical measures.
Document Page
Vectors and Matrices
tabler-icon-diamond-filled.svg

Paraphrase This Document

Need a fresh take? Get an instant paraphrase of this document with our AI Paraphraser
Document Page
TABLE OF CONTENT
TASK 1............................................................................................................................................1
1.1 Probabilities of familiar events .............................................................................................1
1.2 Relative frequencies as probability measure ........................................................................4
1.3 Combined probabilities .........................................................................................................6
1. 4 Binomial, Poisson and Gaussian distribution ......................................................................7
1.5 Simple problem solutions using nCr, nPr and n! ..................................................................9
TASK 2............................................................................................................................................9
2.1 Estimates of modalism, skew and standard deviation ..........................................................9
...................................................................................................................................................10
2.2 Confidence intervals and standard error..............................................................................11
2.3 Implications of central limit theorem (CLT).......................................................................12
2.4 Probability of statistics and interpretations of the results ...................................................12
Document Page
TASK 1
1.1 Probabilities of familiar events
Mutually exclusive:
These are defined as the events which cannot occur simultaneously. For instance the
event A is defined as occurrence of head and event B is known as occurrence of tail while
tossing a coin. When event A occurs then, it is not possible that event B will occur. Such types of
events in which A∩B = 0 then A and B are called mutually exclusive events.
Conditional probability:
The probability of an event A is called conditional probability when the occurrence of a
depends upon the knowledge of other event B which has already occurred. The conditional
probability of A is represented by P (A, B) and is given by:
P (A|B) = P (A and B) / P (A)
Dependent and independent:
The two events are known as dependent events when the outcomes of first event affect
the occurrence or probability of other event. For example if two events A and B are dependent
then their probability can be derived by using formula of conditional probability.
Similarly, the events whose occurrence does not depend upon the occurrence of another
event are known as independent events. When two events A and B are independent then they
satisfy the following relation:
P (A and B) = P (A). P (B)
1.
Two fair spinners with faces numbered 1-4
Probability of spinner indicating sum of 5 = ?
Solution
Possible outcomes of both the spinners= (1, 1) (1, 2) (1, 3) (1, 4)
(2, 1) (2, 2) (2, 3) (2, 4)
(3, 1) (3, 2) (3, 3) (3, 4)
(4, 1) (4, 2) (4, 3) (4, 4)
Total number of outcomes = 16
Favourable number of outcomes with sum equals to 5 and number 3 on at least one spinner = 2
1
Document Page
[(3, 2) (2, 3)]
Required probability = 2/16 = 1/8
2.)
P(C) = 0.2
P (D) = 0.6
P (C| D) = 0.3
Solution
From the formula of conditional probability we have:
P (C| D) = P (C ∩ D) / P(C)
On putting values from above we get:
P (C ∩ D) = 0.3 * 0.2 = 0.06
P (D| C) = P (C ∩ D) / P(D) = 0.06 / 0.6 = 0.1
P (C U D) = P (C) + P (D) - P (C ∩ D)
P (C U D) = 0.2 + 0.6 – 0.06 = 0.74
Now using the formula: P (C' ∩ D') = 1 - P (C U D)
P (C' ∩ D') = 1 – 0.74 = 0.26
Using the formula: P (C' ∩ D) = P (D) - (C ∩ D)
= 0.6 – 0.06 = 0.54
P (D| C) = 0.1
P (C' ∩ D') = 0.26
P (C' ∩ D) = 0.54
3.)
Total number of cards = 52
Probability of card to be an ace, given that it is diamond = ?
Solution
Let A be the event that card is an ace and B is that event that card is diamond
Required probability = P (A|B)
2
tabler-icon-diamond-filled.svg

Paraphrase This Document

Need a fresh take? Get an instant paraphrase of this document with our AI Paraphraser
Document Page
P (B) = 13/52 = 0.25
P (A and B) = p (A ∩ B) = 1/52 = 0.019
P (A|B) = p (A ∩ B) / P (B) = 0.076
Calculate probabilities
1.)
A and B are mutually exclusive events.
P (A) = 0.2
P (B) = 0.4
Solution
a.) P (A U B)
For the mutually exclusive events: P (A U B) = P (A) + P (B)
P (A U B) = 0.2 +0.4 = 0.6
b.) P (A ∩ B')
P (A B') = P (A) - (A B)
For mutually exclusive events (A B)= 0 so
P (A ∩ B') = P (A) – 0 = 0.2
c.) P (A' ∩ B')
P (A' ∩ B') = 1 - P (A U B) = 1 – 0.6 = 0.4
2.)
A and B are independent events
P (A) = ¼ = 0.25
P (B) = 1/5 = 0.2
Solution
a.) P (A ∩ B)
For independent events P (A ∩ B) = P (A). P (B)
P (A ∩ B)= 0.25 * 0.2 = 0.05
b.) P (A ∩ B')
P (A ∩ B') = P (A) - P (A ∩ B) = 0.25 – 0.05 = 0.2
3
Document Page
P (A ∩ B') = 0.2
c.) P (A' ∩ B')
P (A U B) = P (A) + P (B) - P (A ∩ B)
= 0.25 + 0.2 – 0.05 = 0.4
P (A' ∩ B') = 1 - P (A U B) = 1- 0.4
P (A' ∩ B') = 0.6
3.)
Number of red beads = 3
Number of blue beads = 5
Total beads in bag = 8
Solution
a.) Probability that both beads are blue
Required probability = (5/8) * (5/8) = 25/64 = 0.39
P (Both beads are blue) = 0.39
b.) Probability that second bead is blue
Required probability = P (both are blue) + P (First is red and second is blue)
= 0.39 + [(3/8) * (5/8)] = 0.62
P (second bead is blue) = 0.62
1.2 Relative frequencies as probability measure
No. of meals a day Frequency
1 6
2 23
3 56
4 14
a.) Relative frequency of choosing a person eating 3 meals a day
4
Document Page
Solution:
Frequency of people having 3 meals per day = 56
Relative frequency = 56/100 = 0.56
b.)
Total number of participants = 75
Relative frequency (f) = favourable number of outcomes (p) / Total outcomes (t)
f = p/t
From the above we have f = 0.56 = Relative frequency of people having 3 meals in a day
t = 75
p = f*t
p = 75*0.56 = 42
Out of 75, around 42 people are expected to have 3 meals
2.)
The result of 20 throws of biased dice:
3 4 2 3 1 5 6 2 4 3
4 3 1 1 6 2 5 6 5 3
Solution
a.) Relative frequency of each score
Score Frequency Relative frequency
1 3 3/20= 0.15
2 3 3/20= 0.15
3 5 5/20= 0.25
4 3 3/20= 0.15
5 3 3/20= 0.15
5
tabler-icon-diamond-filled.svg

Paraphrase This Document

Need a fresh take? Get an instant paraphrase of this document with our AI Paraphraser
Document Page
6 3 3/20= 0.15
b.)
Number of throws = 60
Relative frequency of getting a score of 3 = 0.25 (From the above table)
Expected number of times when score 3 can occur = 60 * 0.25 = 15
c.)
Probability of getting 3 when a fair dice is thrown = 1/6
Expected number of times 3 can be scored when dice is thrown 60 times = (1/6) * 60 = 10
Thus, it can be concluded that for the same number of trials fair dice is expected to give 3 only
10 times while the unfair dice is expected to give same score 15 times.
1.3 Combined probabilities
1.)
Spinner has Red = 3
Blue = 2
Green = 2
Total = 7
Solution
a.)
P (Red and blue) = (3/7) * (2/7)
P (Red and blue) = 0.12
b.)
P (at least 1 blue)= (2/7) * (1/7)
P (at least 1 blue)= 0.04
2.)
Total number of marbles = 12
6
Document Page
Red = 2 Blue = 4 Green = 6
Solution
a.) P (same colour twice) = P (Both red) + P (Both blue) +P (Both green)
P (Both red) = (2/12) * (2/12) = 0.02
P (Both blue)= (4/12) * (4/12) = 0.11
P (Both green)= (6/12) * (6/12) = 0.25
P (same colour twice) = 0.02 + 0.11 +0.25 = 0.38
b.) P (Not blue) = Probability of getting red or green in both iterations
P of getting red = 2/12
P of getting green = 6/12
P of not getting blue in the first iteration = (2/12) + (6/12) = 0.66
P of not getting blue in the second iteration = (2/12) + (6/12) = 0.66
Total probability of not getting blue = P (Not blue) = 0.66 * 0.66 = 0.43
1. 4 Binomial, Poisson and Gaussian distribution
1.)
Total customers = 10
Let A be the event that customer will ask for water with meal and x is number of customers
P (A) = 3/5 = 0.6
Solution
a.)
Probability that exactly 6 customers demand water with meal = P (x = 6)
Using the formula of binomial distribution we have:
P (x) = nCr * (p^x) * (q^(n-x)) where q = 1-p
x = 6 p = 0.6 q= 0.4 n = 10
P (x=6) = 10C6 * (0.6^6) * (0.4^4)
= 210* 0.046 * 0.025 = 0.24
Required P (x=6) = 0.24
b.)
7
Document Page
P ( x<9) = ?
P (x<9) = 1- [P (x = 10) + P (x = 9)]
P (x = 10) = 10C10 * (0.6^10) * (1) = 0.006
P (x = 9) = 10C9 * (0.6^9) * (0.4^1) = 0.04
P (x<9) = 1 – [0.006 + 0.04]
P (x<9) = 0.954
2.)
Let x be the number of sales made and n is the number of calls
p = 0.15 q = 0.85
a.)
Using binomial distribution
P (x=0, n=10) = 10C0 * (0.15)^0 * (0.85)^10 = 0.196
P (no sales made in 10 calls) = 0.196
b.) P (x>3, n= 20)
P (x>3) = 1 – p (x<3)
P (x<3) = p (x =0) + p (x =1) + p (x =2)
= [20C0 * (0.15)^0 * (0.85)^20] + [20C1 * (0.15)^1 * (0.85)^19] + [20C2 * (0.15)^2 *
(0.85)^18]
P (x<3) = 0.64
P (x>3) = 1 – 0.64 = 0.35
P (more than 3 sales made in 20 calls) = 0.35
3.)
Let x is the number of patients arriving at hospital in 90 minute period.
The rate of arrival of patients in 90 min = (6/60) * 90 = 9
a.) P (x = 7)
P (x=7) ={ [ (9)^7 ] * e^(-9) } / 7!
P (x=7) = 0.11
8
tabler-icon-diamond-filled.svg

Paraphrase This Document

Need a fresh take? Get an instant paraphrase of this document with our AI Paraphraser
Document Page
b.)
P (x >= 10) = 1 – P (x<= 9)
P (x<= 9) = 0.58
P (x >= 10) = 1 – 0.58 = 0.42
4.)
Let x denotes the number of power cuts
The rate of power cuts = 3 per year
n = 3
a.)
P (x= 7) = { [ (3)^7 ] * e^(-3) } / 7!
P (x= 7) = 0.0216
b.)
P (x>= 4) = 1 - P (x<= 3)
P (x<= 3) = 0.64
P (x>= 4) = 1 – 0.64
P (x>= 4) = 0.35
1.5 Simple problem solutions using nCr, nPr and n!
1.)
10! = 10*9*8*7*6*5*4*3*2*1 = 3628800
10! = 3628800
2.)
Permutation for n = 5 and r = 3
Permutation = n! / (n-r)! = 5! / (5-3)! = 60
3.)
Combination for n = 5 and r = 3
Combination = n! /[ r! *(n-r)!] = 5! /[ 3! *(5-3)!] = 10
9
Document Page
TASK 2
2.1 Estimates of modalism, skew and standard deviation
Let us consider the sample of 120 commuters which are travelling specific distance
for the work. The summary of travelled distance is as follows:
Distance Number of commuters
0-9 10
10 – 19 19
20 -29 43
30-39 25
40-49 8
50-59 6
60-69 5
70-79 3
80-89 1
Solution
Class mark = (upper class limit + lower class limit) / 2
Distanc
e
Number of
commuters (f)
Class marks
(x)
(fx) x²f
0-9 10 4.5 45 202.5
10 – 19 19 14.5 275.5 3994.75
20 -29 43 24.5 1053.5 25810.75
30-39 25 34.5 862.5 29756.25
40-49 8 44.5 356 15842
50-59 6 54.5 327 17821.5
10
chevron_up_icon
1 out of 23
circle_padding
hide_on_mobile
zoom_out_icon
[object Object]