Statistics Project: GPA, Study Hours, and Gender Analysis at Miramar

Verified

Added on  2023/05/29

|6
|1034
|359
Project
AI Summary
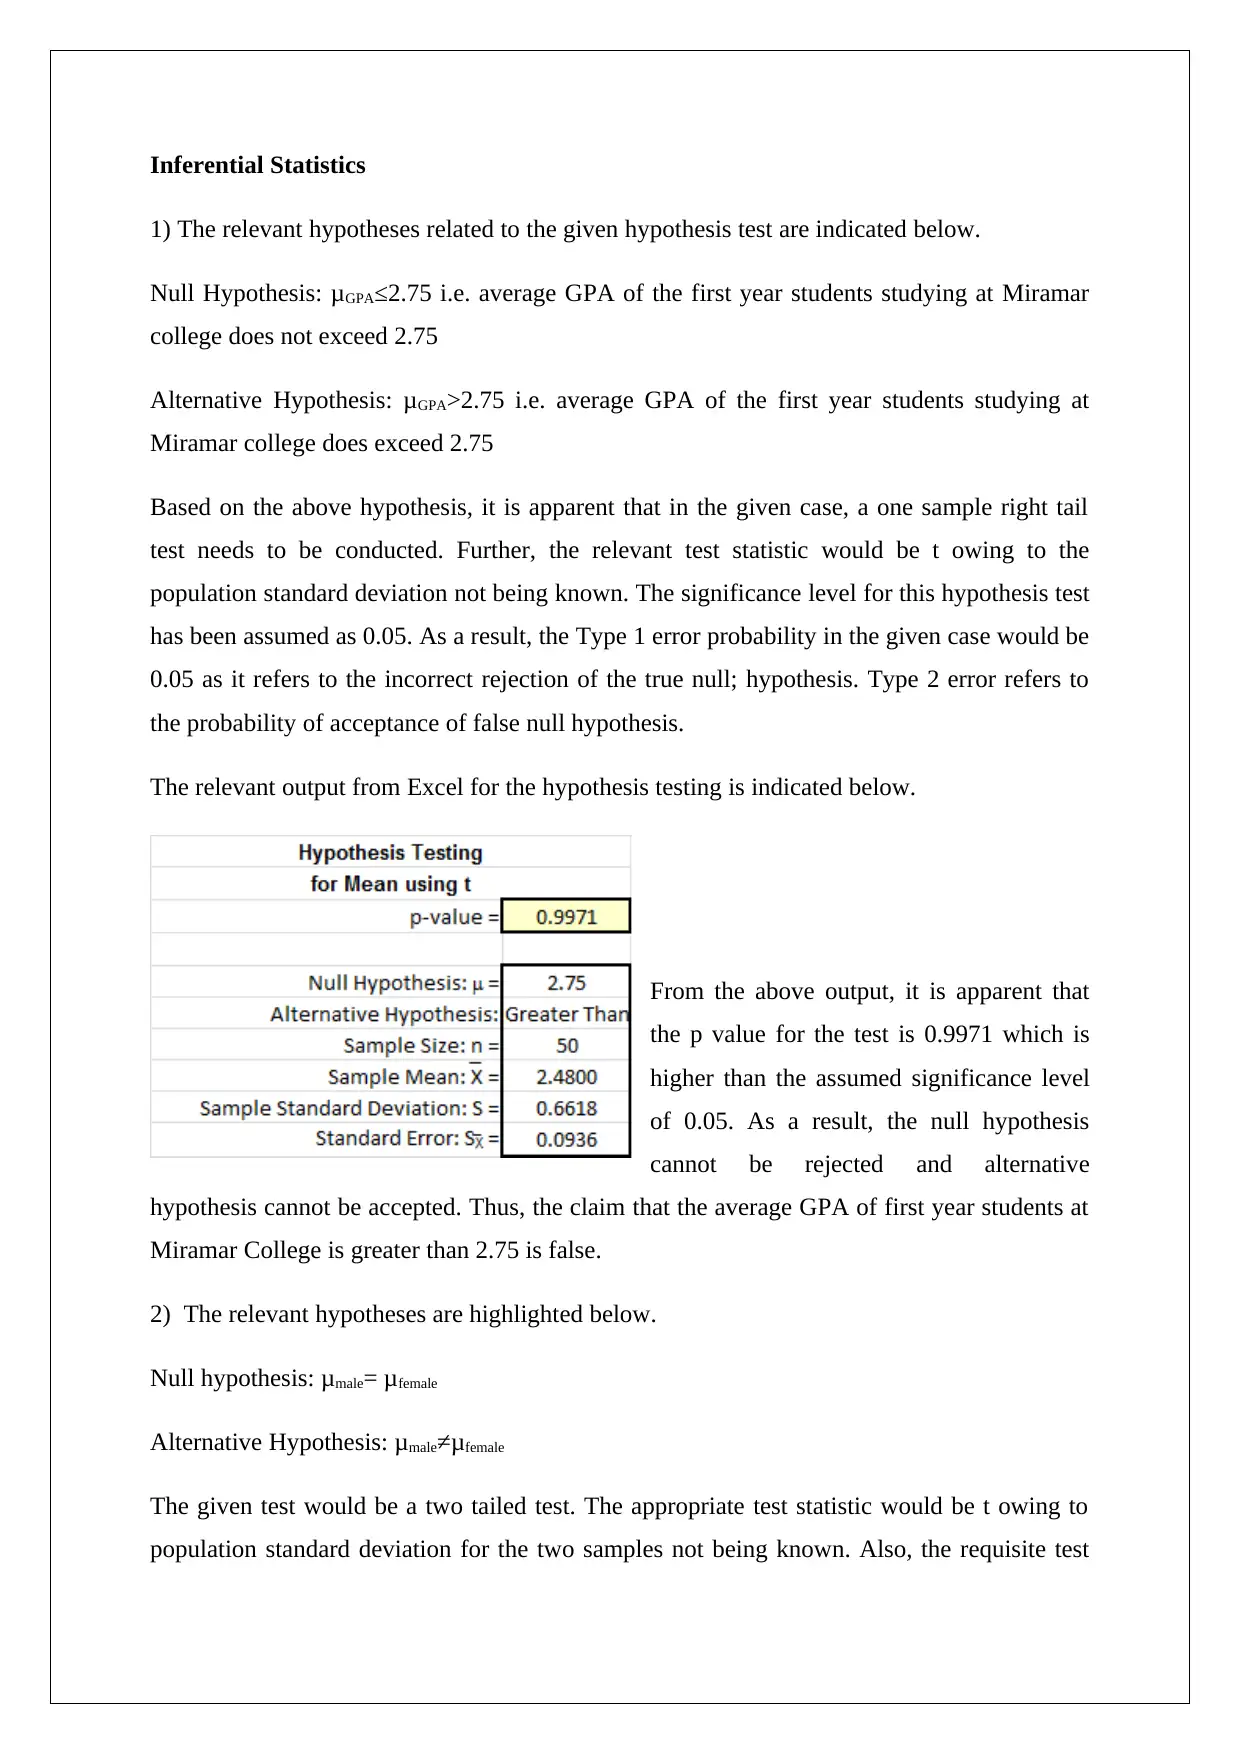
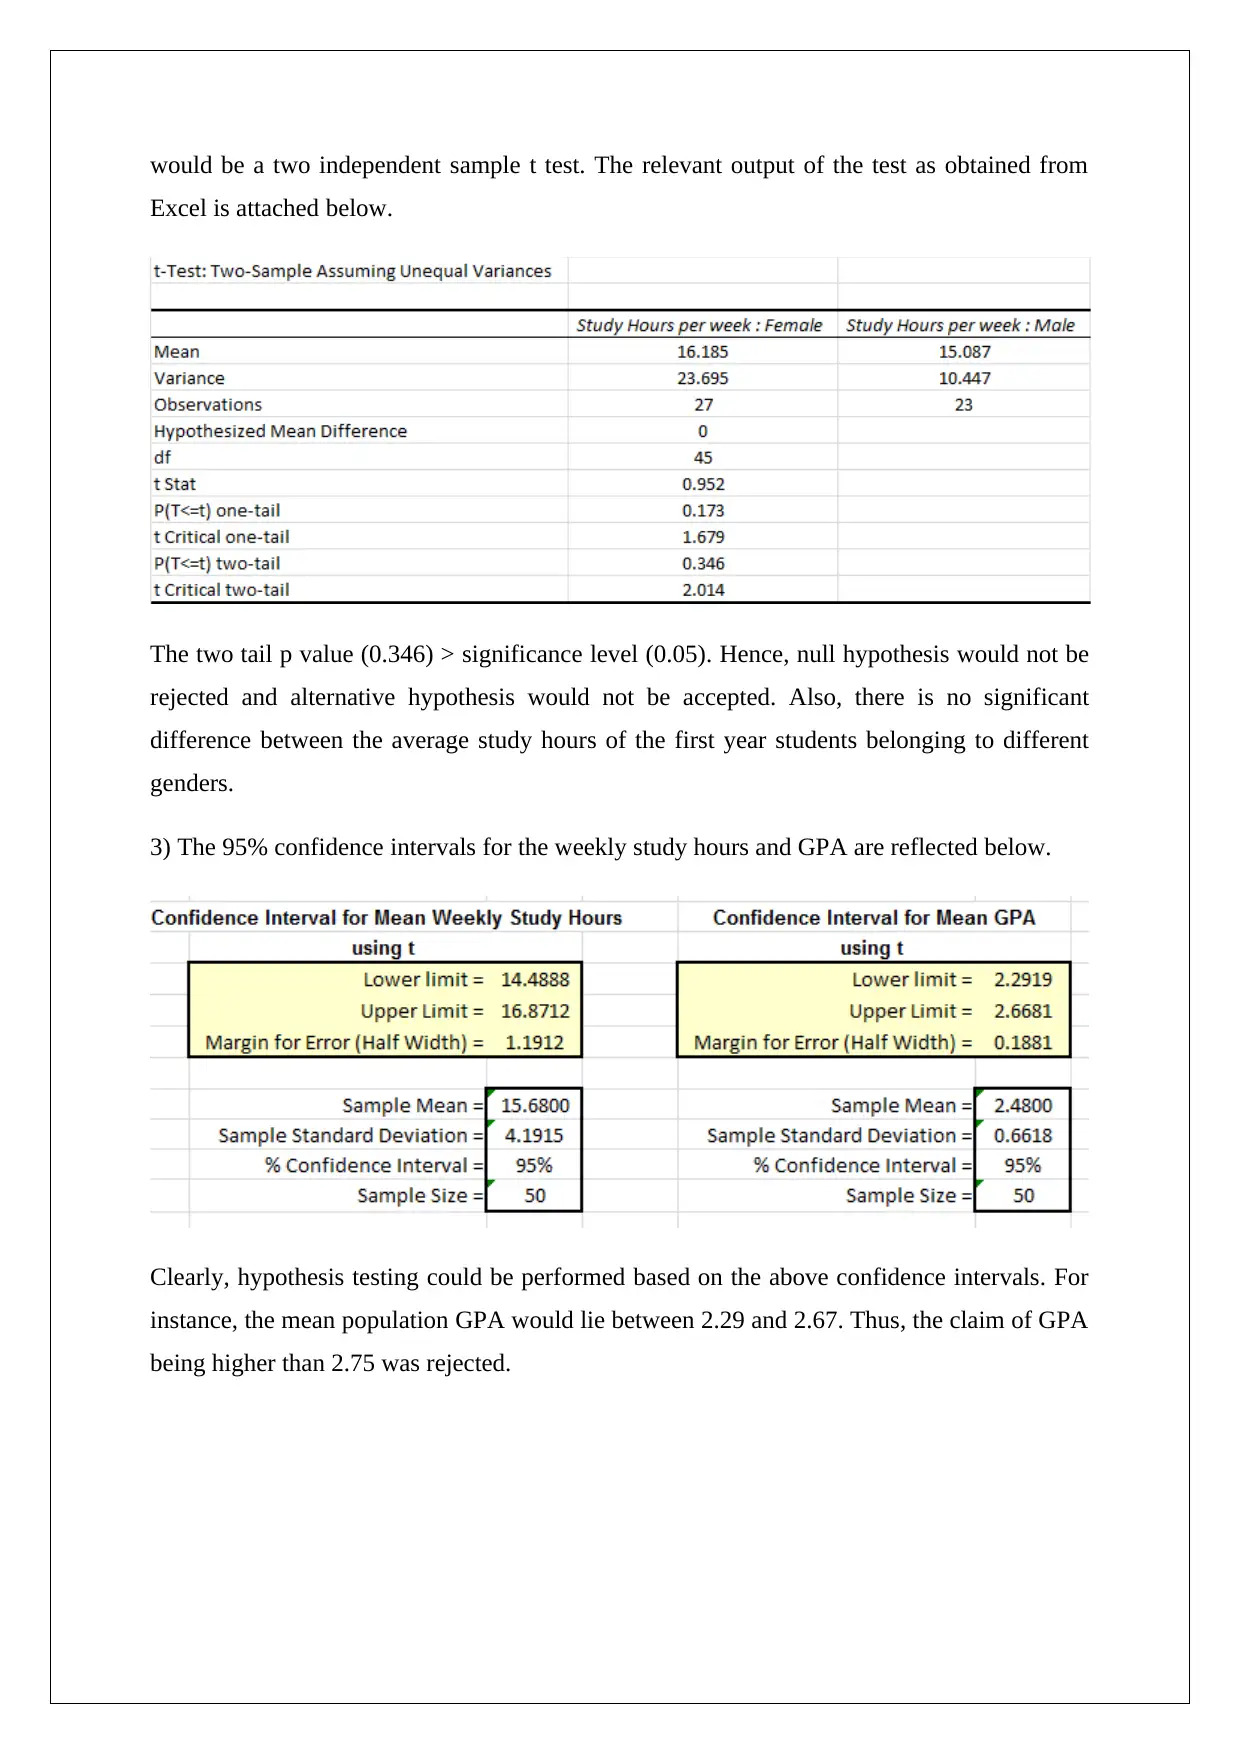
This statistics project report analyzes data collected from a survey of first-year students at Miramar College, focusing on weekly study hours, gender, and GPA. The study employs descriptive statistics to summarize the sample data, including measures of central tendency and dispersion, and inferential statistics to test two hypotheses: whether the average GPA exceeds 2.75 and whether there is a significant difference in average study hours between male and female students. The analysis includes t-tests and confidence intervals, with findings indicating that the average GPA is not significantly greater than 2.75, and there is no significant difference in study hours between genders. The report concludes with a discussion of the implications of these findings based on the sample data collected.
tabler-icon-diamond-filled.svg

Contribute Materials

Your contribution can guide someone’s learning journey. Share your documents today.
Document Page
STATISTICS
STUDENT ID:
[Pick the date]
tabler-icon-diamond-filled.svg

Secure Best Marks with AI Grader

Need help grading? Try our AI Grader for instant feedback on your assignments.
Document Page
Introduction & Sample Selection
The objective of the given report is to highlight the usage of statistical tools and techniques
(both descriptive and inferential) in the real life. The key requirement to ensure the same is
the data for which a survey was done amongst the first year students of the Miramar college.
The focus of the survey was essentially on these key variables namely the weekly study
hours, gender and GPA. The total sample size for this study is 50. The underlying sampling
technique that has been deployed is simple random technique whereby randomly first year
students were selected to participate in the survey and relevant data has been obtained from
the same. In the sample selection process, care was taken to ensure that both the genders have
fair representation so as to avoid selection of too skewed a sample.
Hypothesis
Based on the sample collected, the following two hypotheses have been selected which would
be tested.
1) The average GPA of the first year students at Miramar College tends to exceed 2.75.
2) There is significant difference in the average study hours of first year students of the two
genders (male and female) at Miramar college.
Descriptive Tools
The objective of the descriptive statistical tools is to draw a summary of the sample data
without focusing on deriving population parameters and underlying characteristics of
population. With regards to the numerical data, the key summary statistics would include a
description of the central tendency along with the dispersion of the data. Also, the underlying
distribution of data plays a crucial role. The summary statistics of the GPA and weekly study
hours for the sample data are indicated below.
Document Page
Based on the above descriptive statistics, it is apparent that average weekly study hours for
the sample of first year students have come out as 15.68 hours. Further, the underlying
dispersion in the data is moderate with the minimum study hours being 6 hours and the
maximum study hours being 25 hours. The non-zero value of skew highlights that the given
sample distribution is non-normal and has a slight negative skew.
Based on the above descriptive statistics, it is apparent that average GPA for the sample of
first year students has come out as 2.48. However, the median and mode GPA values
coincide at 2.6. Further, the underlying dispersion in the data is moderate with the minimum
GPA being 1.2 and the maximum GPA being The non-zero value of skew highlights that the
given sample distribution is non-normal and has a slight negative skew.
The requisite histogram for the two variables is highlighted below.
Document Page
While there is a slight negative skew present, but based on the almost symmetric and uni-
modal graph, it can be concluded that the study hours data is approximately normally
distributed.
While there is a
slight negative
skew present,
but based on the
almost
symmetric and
uni-modal
graph, it can be
concluded that
the GPA data is approximately normally distributed.
For the categorical variable Gender, a pie chart has been drawn so as to summarise the
distribution of the two genders in the sample selected for the given survey.
Based on the above, it is apparent that for the given sample, there are 27 females while 23
males have been included in the sample.
tabler-icon-diamond-filled.svg

Secure Best Marks with AI Grader

Need help grading? Try our AI Grader for instant feedback on your assignments.
Document Page
Inferential Statistics
1) The relevant hypotheses related to the given hypothesis test are indicated below.
Null Hypothesis: μGPA≤2.75 i.e. average GPA of the first year students studying at Miramar
college does not exceed 2.75
Alternative Hypothesis: μGPA>2.75 i.e. average GPA of the first year students studying at
Miramar college does exceed 2.75
Based on the above hypothesis, it is apparent that in the given case, a one sample right tail
test needs to be conducted. Further, the relevant test statistic would be t owing to the
population standard deviation not being known. The significance level for this hypothesis test
has been assumed as 0.05. As a result, the Type 1 error probability in the given case would be
0.05 as it refers to the incorrect rejection of the true null; hypothesis. Type 2 error refers to
the probability of acceptance of false null hypothesis.
The relevant output from Excel for the hypothesis testing is indicated below.
From the above output, it is apparent that
the p value for the test is 0.9971 which is
higher than the assumed significance level
of 0.05. As a result, the null hypothesis
cannot be rejected and alternative
hypothesis cannot be accepted. Thus, the claim that the average GPA of first year students at
Miramar College is greater than 2.75 is false.
2) The relevant hypotheses are highlighted below.
Null hypothesis: μmale= μfemale
Alternative Hypothesis: μmale≠μfemale
The given test would be a two tailed test. The appropriate test statistic would be t owing to
population standard deviation for the two samples not being known. Also, the requisite test
Document Page
would be a two independent sample t test. The relevant output of the test as obtained from
Excel is attached below.
The two tail p value (0.346) > significance level (0.05). Hence, null hypothesis would not be
rejected and alternative hypothesis would not be accepted. Also, there is no significant
difference between the average study hours of the first year students belonging to different
genders.
3) The 95% confidence intervals for the weekly study hours and GPA are reflected below.
Clearly, hypothesis testing could be performed based on the above confidence intervals. For
instance, the mean population GPA would lie between 2.29 and 2.67. Thus, the claim of GPA
being higher than 2.75 was rejected.
chevron_up_icon
1 out of 6
circle_padding
hide_on_mobile
zoom_out_icon
logo.png

Your All-in-One AI-Powered Toolkit for Academic Success.

Available 24*7 on WhatsApp / Email

[object Object]