Analysis of Student Demographics and Performance: Statistics Project
VerifiedAdded on 2023/05/29
|7
|982
|415
Report
AI Summary
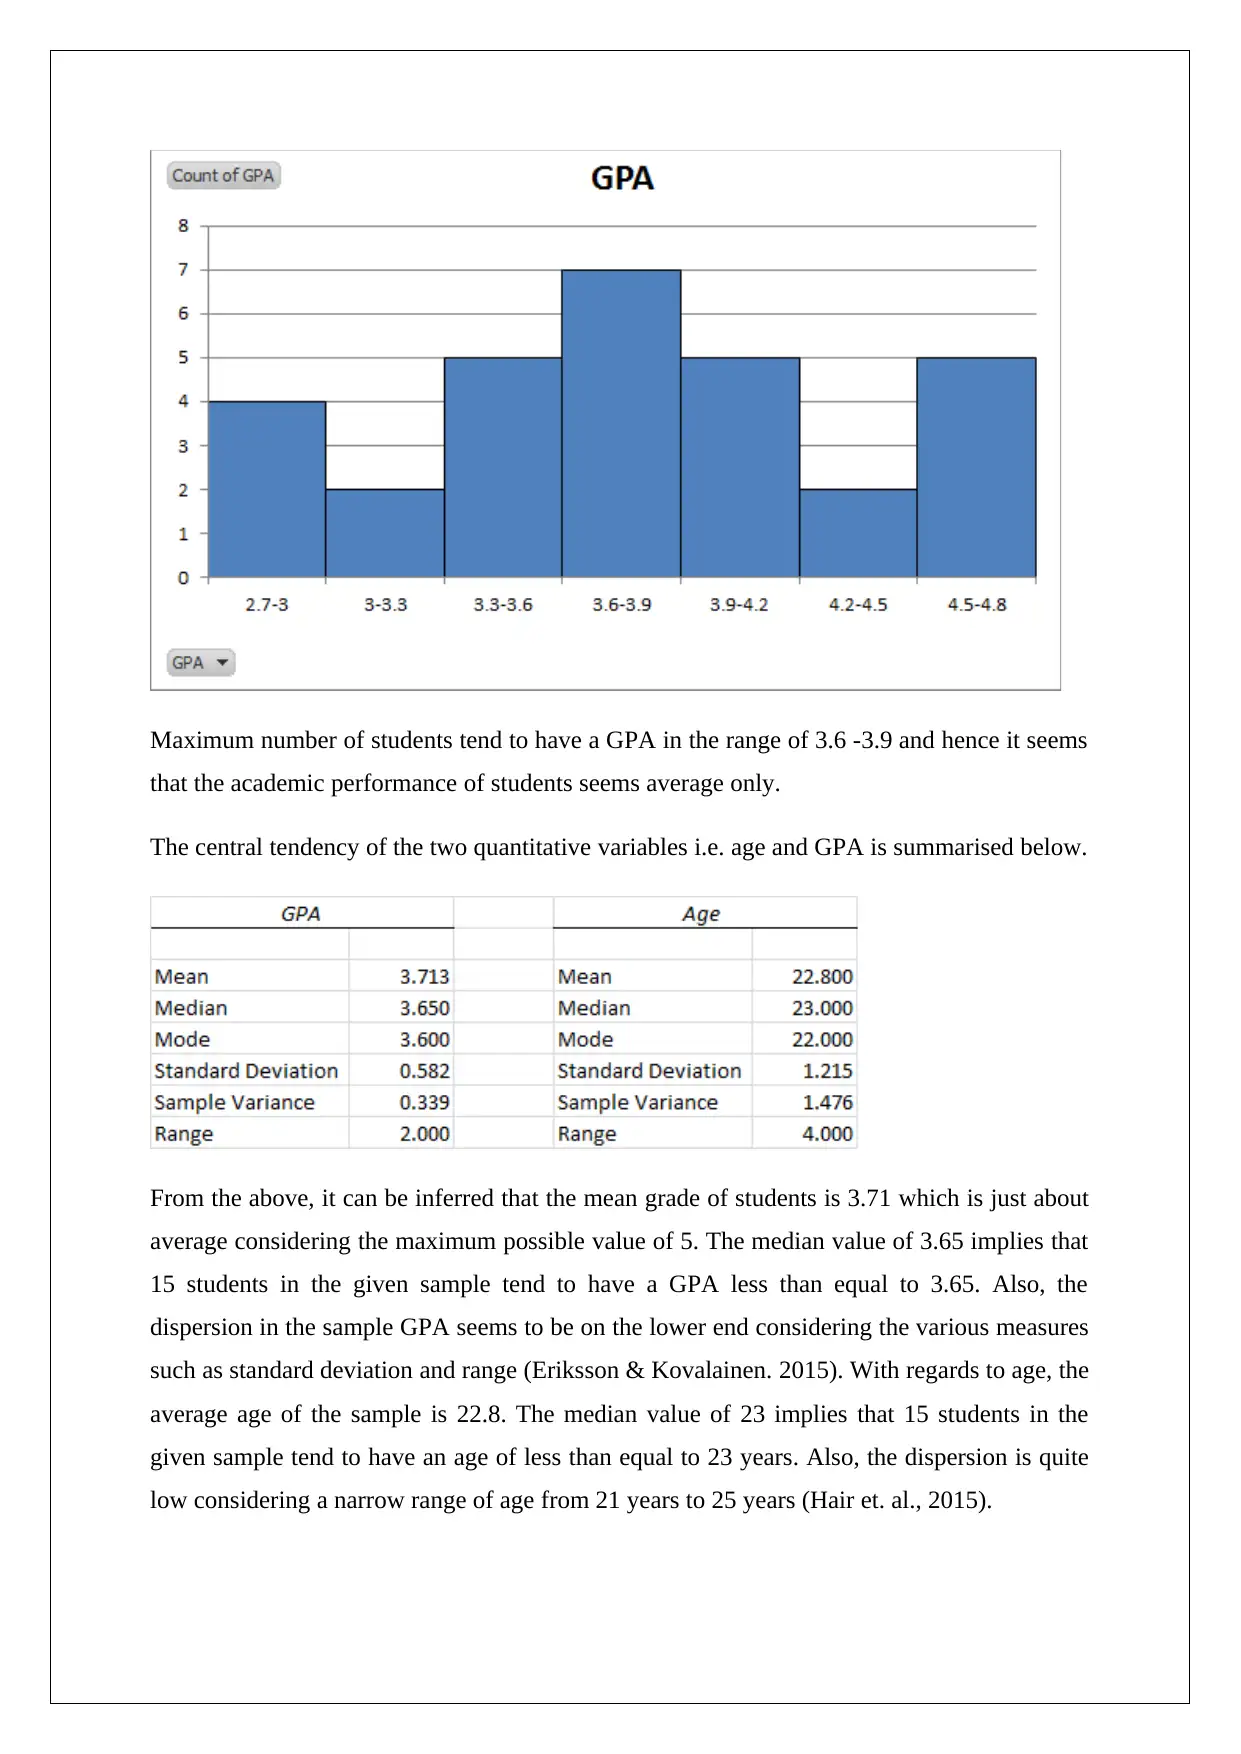
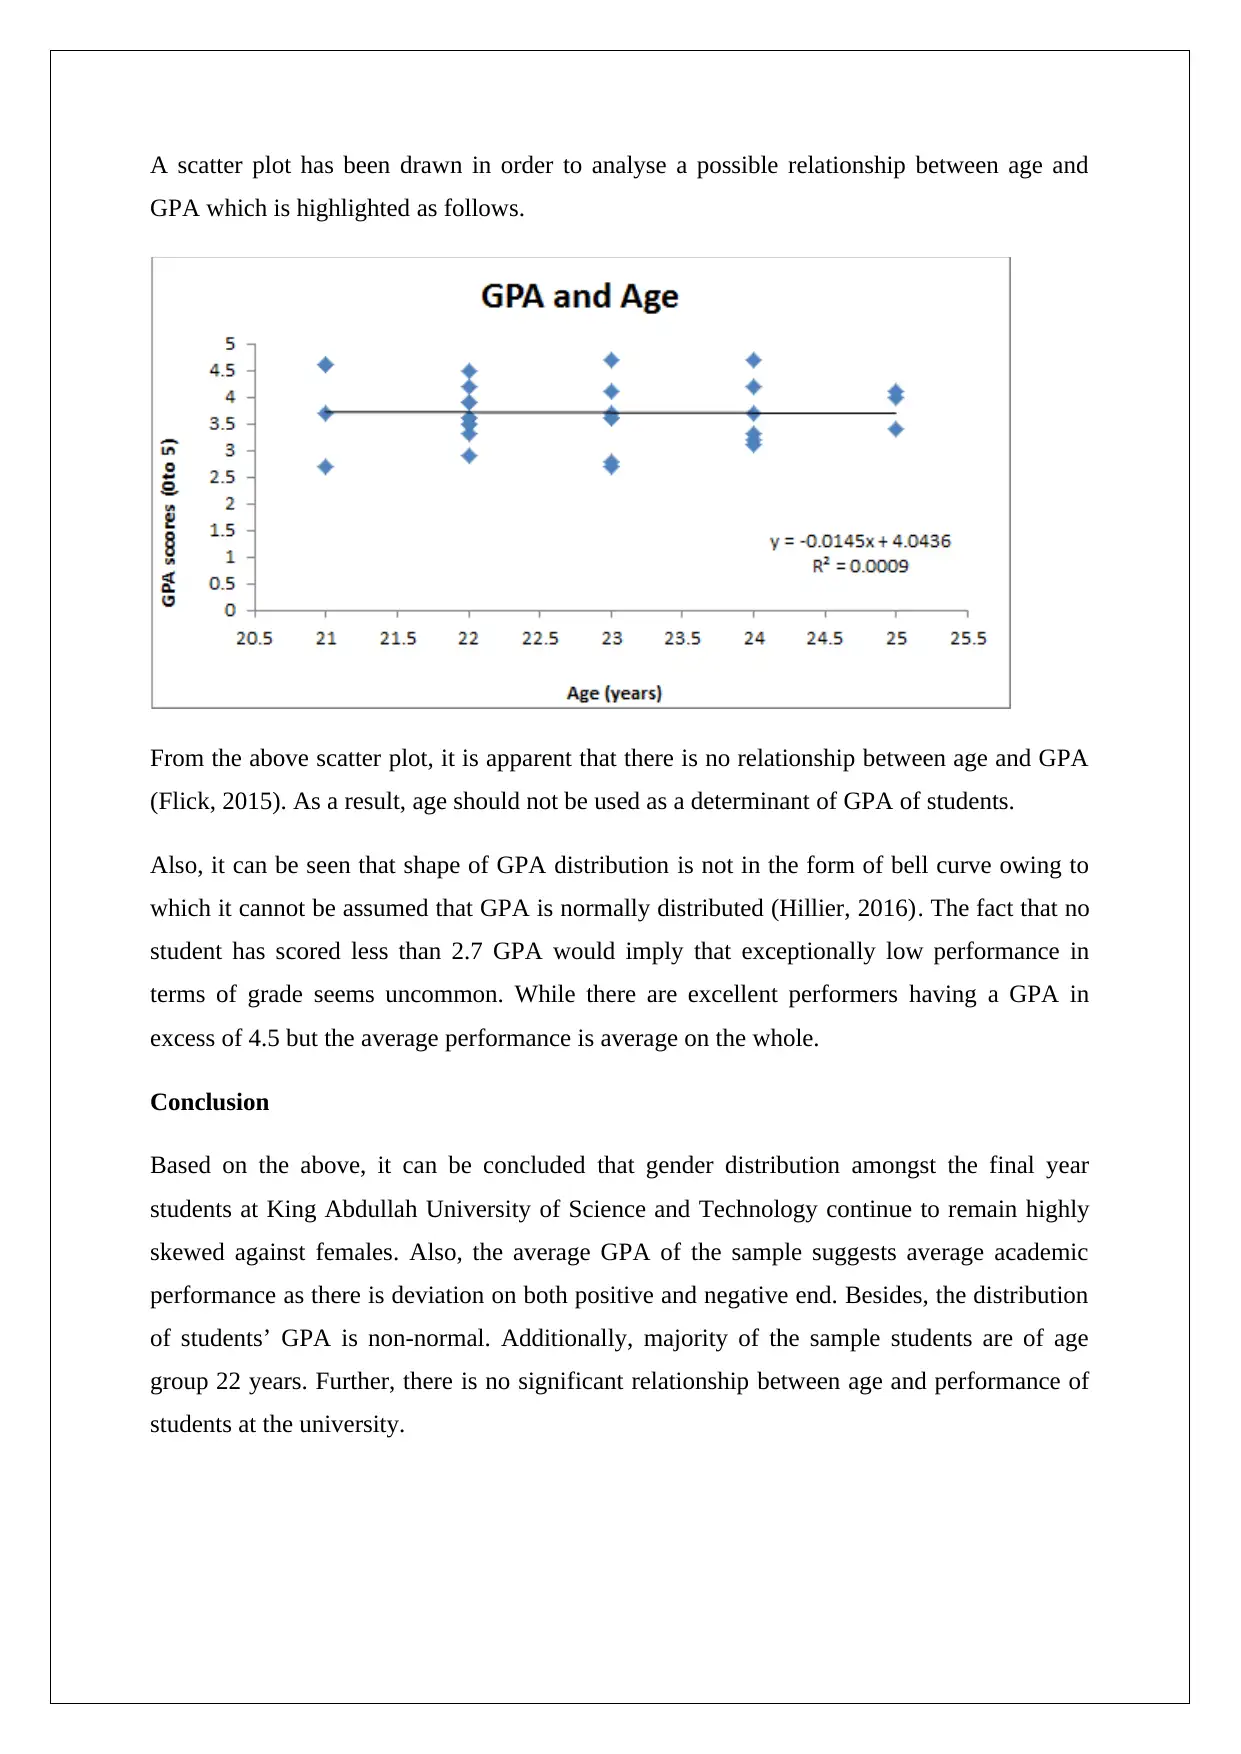
This report presents a statistical analysis of final-year students at King Abdullah University of Science and Technology (KAUST) in Riyadh. The study investigates the gender and age distribution of students and correlates these variables with their academic performance, specifically GPA. Data was collected using convenience sampling, with a sample size of 30 students. The analysis includes frequency distributions for gender, age, and GPA, along with measures of central tendency (mean, median, mode) and dispersion (range, standard deviation). A scatter plot was used to explore the relationship between age and GPA. The findings indicate a skewed gender distribution, average academic performance, and no significant relationship between age and GPA. The report concludes with a summary of the key findings and relevant references.

STATISTICS
STUDENT ID:
[Pick the date]
STUDENT ID:
[Pick the date]
Paraphrase This Document
Need a fresh take? Get an instant paraphrase of this document with our AI Paraphraser

Introduction
The objective of the given research project is to analyse the gender & age distribution of
students coupled with summarising the academic performance of students that are currently
in the final year in the King Abdullah University of Science and Technology, Riyadh. The
motivation behind this study is to analyse if the recent changes with regards to education and
availabilities of more freedom to women have had an effect on gender distribution coupled
with academic performance of students. The quantitative variable of interest would be GPA
along with age. However, qualitative variable in the form of gender is also crucial to the
underlying study.
Data Collection
The main population of interest for the given research was the students studying in their final
year at King Abdullah University of Science and Technology, Riyadh. In order to select the
requisite sample, convenience sampling was used whereby responses from students passing at
a location at a given time were obtained. The sample size for this study is 30. One of the
advantages of convenience sampling is that it is a very convenient and easy to implement
sampling technique. Also, it tends to lower the time consumed in obtaining the sample
(Hillier, 2016). However, one of the key disadvantages of using convenience sampling
technique is that the underlying sample could be biased considering the fact that this
sampling technique is non-probability based sampling technique. This may lead to lower
reliability of the results obtained by considering the sample derived using this sampling
technique (Flick, 2015). The raw data obtained using this sampling technique is indicated as
follows.

Data Analysis
The frequency distribution with regards to female variable is indicated below.
⊘ This is a preview!⊘
Do you want full access?
Subscribe today to unlock all pages.

Trusted by 1+ million students worldwide

It is apparent that 80% of the sample comprises of male students and only 20% comprises of
female students. Assuming that the sample is representative of the population of interest, this
would imply that female representation continues to remain at dismal levels.
The relevant table for frequency distribution of age of sample students is indicated below.
It is apparent from the above that maximum students are 22 years old but there are students
from 21 years to 25 years. The mode of the given data would be 22 years considering that it
has the maximum frequency.
The relevant table for frequency distribution of GPA of sample students is indicated below.
Paraphrase This Document
Need a fresh take? Get an instant paraphrase of this document with our AI Paraphraser

Maximum number of students tend to have a GPA in the range of 3.6 -3.9 and hence it seems
that the academic performance of students seems average only.
The central tendency of the two quantitative variables i.e. age and GPA is summarised below.
From the above, it can be inferred that the mean grade of students is 3.71 which is just about
average considering the maximum possible value of 5. The median value of 3.65 implies that
15 students in the given sample tend to have a GPA less than equal to 3.65. Also, the
dispersion in the sample GPA seems to be on the lower end considering the various measures
such as standard deviation and range (Eriksson & Kovalainen. 2015). With regards to age, the
average age of the sample is 22.8. The median value of 23 implies that 15 students in the
given sample tend to have an age of less than equal to 23 years. Also, the dispersion is quite
low considering a narrow range of age from 21 years to 25 years (Hair et. al., 2015).

A scatter plot has been drawn in order to analyse a possible relationship between age and
GPA which is highlighted as follows.
From the above scatter plot, it is apparent that there is no relationship between age and GPA
(Flick, 2015). As a result, age should not be used as a determinant of GPA of students.
Also, it can be seen that shape of GPA distribution is not in the form of bell curve owing to
which it cannot be assumed that GPA is normally distributed (Hillier, 2016). The fact that no
student has scored less than 2.7 GPA would imply that exceptionally low performance in
terms of grade seems uncommon. While there are excellent performers having a GPA in
excess of 4.5 but the average performance is average on the whole.
Conclusion
Based on the above, it can be concluded that gender distribution amongst the final year
students at King Abdullah University of Science and Technology continue to remain highly
skewed against females. Also, the average GPA of the sample suggests average academic
performance as there is deviation on both positive and negative end. Besides, the distribution
of students’ GPA is non-normal. Additionally, majority of the sample students are of age
group 22 years. Further, there is no significant relationship between age and performance of
students at the university.
⊘ This is a preview!⊘
Do you want full access?
Subscribe today to unlock all pages.

Trusted by 1+ million students worldwide

References
Eriksson, P. & Kovalainen, A. (2015). Quantitative methods in business research London:
Sage Publications.
Flick, U. (2015). Introducing research methodology: A beginner's guide to doing a research
project New York: Sage Publications.
Hair, J. F., Wolfinbarger, M., Money, A. H., Samouel, P., & Page, M. J. (2015). Essentials of
business research methods New York: Routledge.
Hillier, F. (2016). Introduction to Operations Research.New York: McGraw Hill
Publications.
1 out of 7
Related Documents

Your All-in-One AI-Powered Toolkit for Academic Success.
+13062052269
info@desklib.com
Available 24*7 on WhatsApp / Email
Unlock your academic potential
Copyright © 2020–2025 A2Z Services. All Rights Reserved. Developed and managed by ZUCOL.