Statistics Quiz: Solutions and Step-by-Step Explanations
VerifiedAdded on 2021/04/21
|13
|2227
|143
Homework Assignment
AI Summary
This document presents solutions to a statistics quiz, providing detailed answers and explanations for each problem. The quiz covers key statistical concepts, including normal distribution, standard deviation, sample means, and confidence intervals. Solutions are provided for specific numerical problems, such as calculating probabilities within a normal distribution, determining confidence intervals for population means and proportions, and calculating required sample sizes. The explanations offer a step-by-step breakdown of the problem-solving process, including the formulas used and the rationale behind each step. The document helps students understand and apply these concepts to solve similar problems. The document also includes answers to homework problems and their explanations from weeks 5 and 6, ensuring a comprehensive understanding of the material.
Running head: QUIZ ON STATISTICS
Quiz on Statistics
Name of the Student
Name of the University
Author Note
Quiz on Statistics
Name of the Student
Name of the University
Author Note
Paraphrase This Document
Need a fresh take? Get an instant paraphrase of this document with our AI Paraphraser

1QUIZ ON STATISTICS
Table of Contents
Answer to Week 5 Homework...................................................................................................2
Explanation of Answer to Week 5 Homework..........................................................................3
Answer to Week 6 Homework...................................................................................................6
Explanation of Answer to Week 6 Homework..........................................................................8
2QUIZ ON STATISTICS
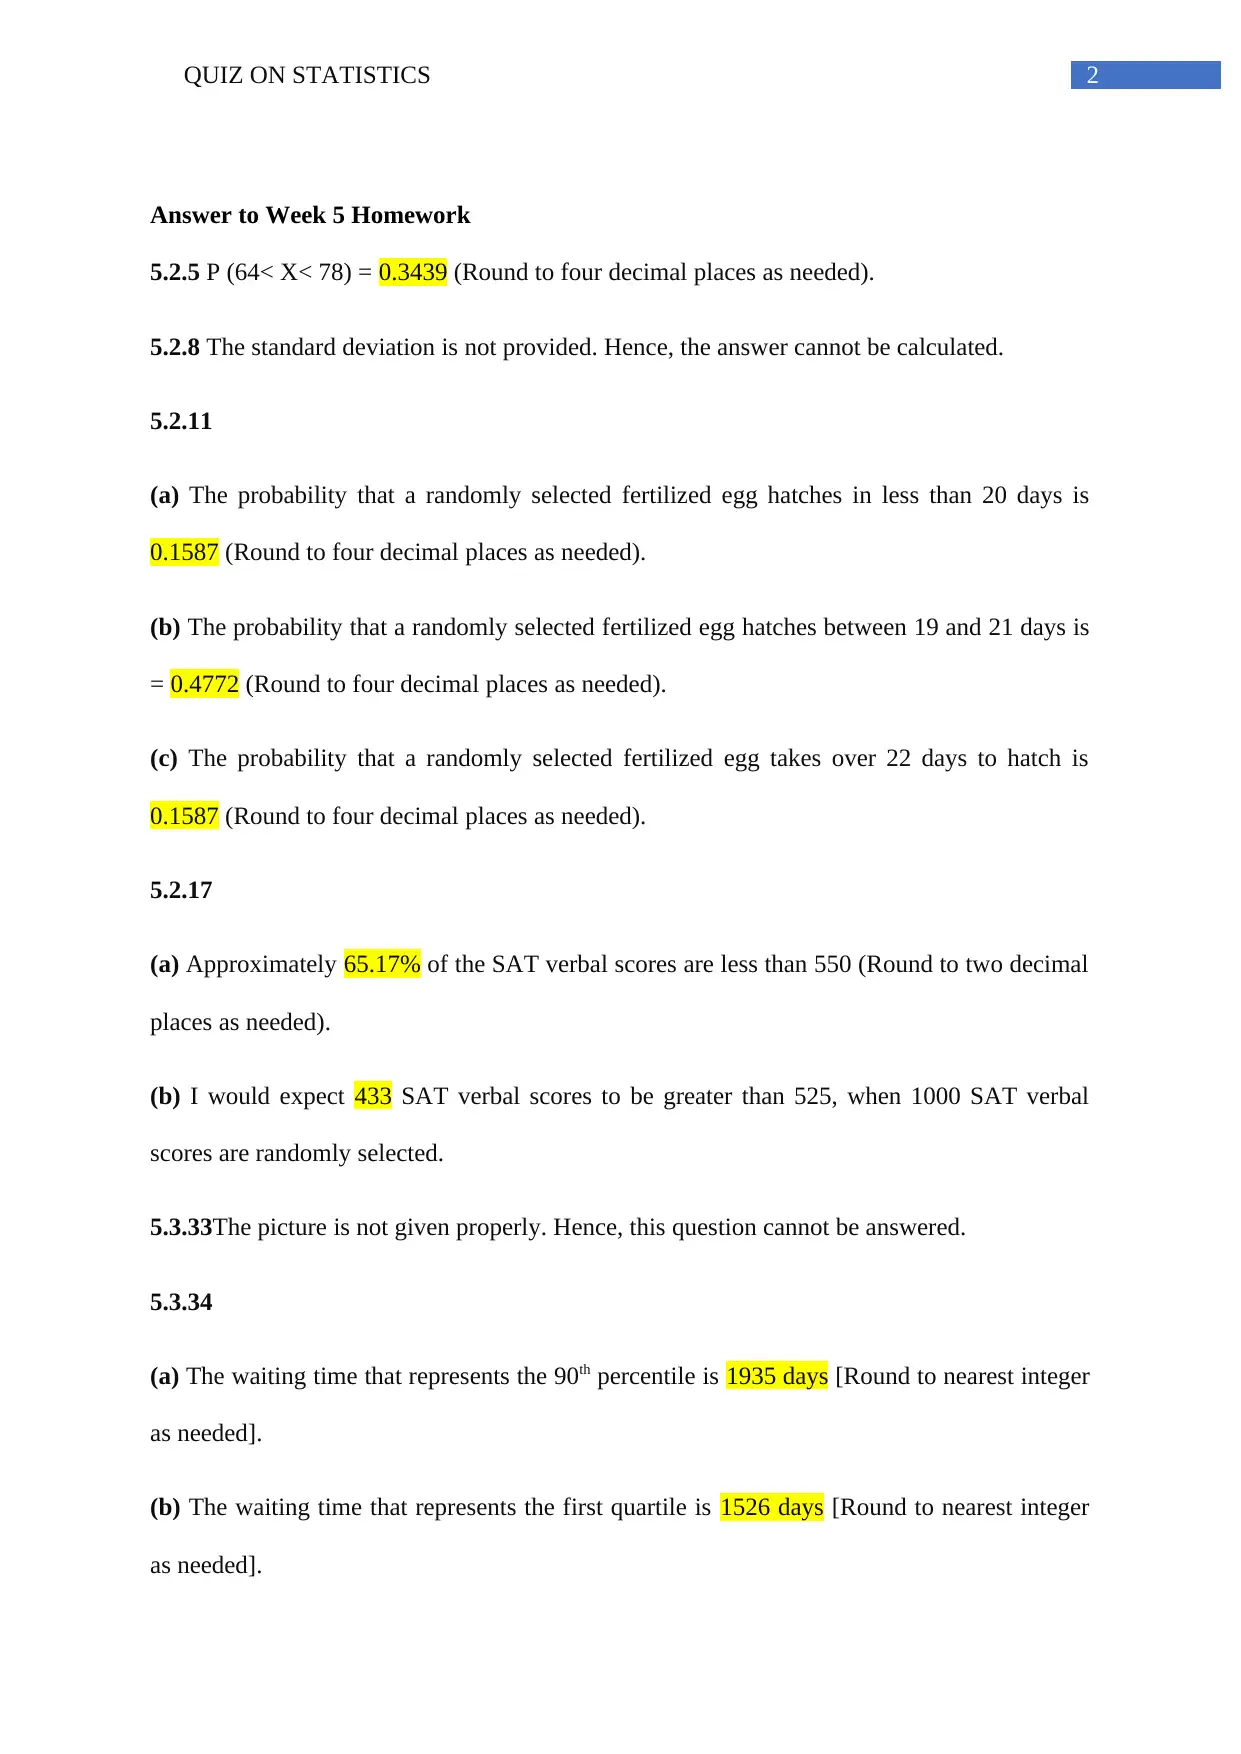
Answer to Week 5 Homework
5.2.5 P (64< X< 78) = 0.3439 (Round to four decimal places as needed).
5.2.8 The standard deviation is not provided. Hence, the answer cannot be calculated.
5.2.11
(a) The probability that a randomly selected fertilized egg hatches in less than 20 days is
0.1587 (Round to four decimal places as needed).
(b) The probability that a randomly selected fertilized egg hatches between 19 and 21 days is
= 0.4772 (Round to four decimal places as needed).
(c) The probability that a randomly selected fertilized egg takes over 22 days to hatch is
0.1587 (Round to four decimal places as needed).
5.2.17
(a) Approximately 65.17% of the SAT verbal scores are less than 550 (Round to two decimal
places as needed).
(b) I would expect 433 SAT verbal scores to be greater than 525, when 1000 SAT verbal
scores are randomly selected.
5.3.33The picture is not given properly. Hence, this question cannot be answered.
5.3.34
(a) The waiting time that represents the 90th percentile is 1935 days [Round to nearest integer
as needed].
(b) The waiting time that represents the first quartile is 1526 days [Round to nearest integer
as needed].
⊘ This is a preview!⊘
Do you want full access?
Subscribe today to unlock all pages.
Trusted by 1+ million students worldwide
3QUIZ ON STATISTICS
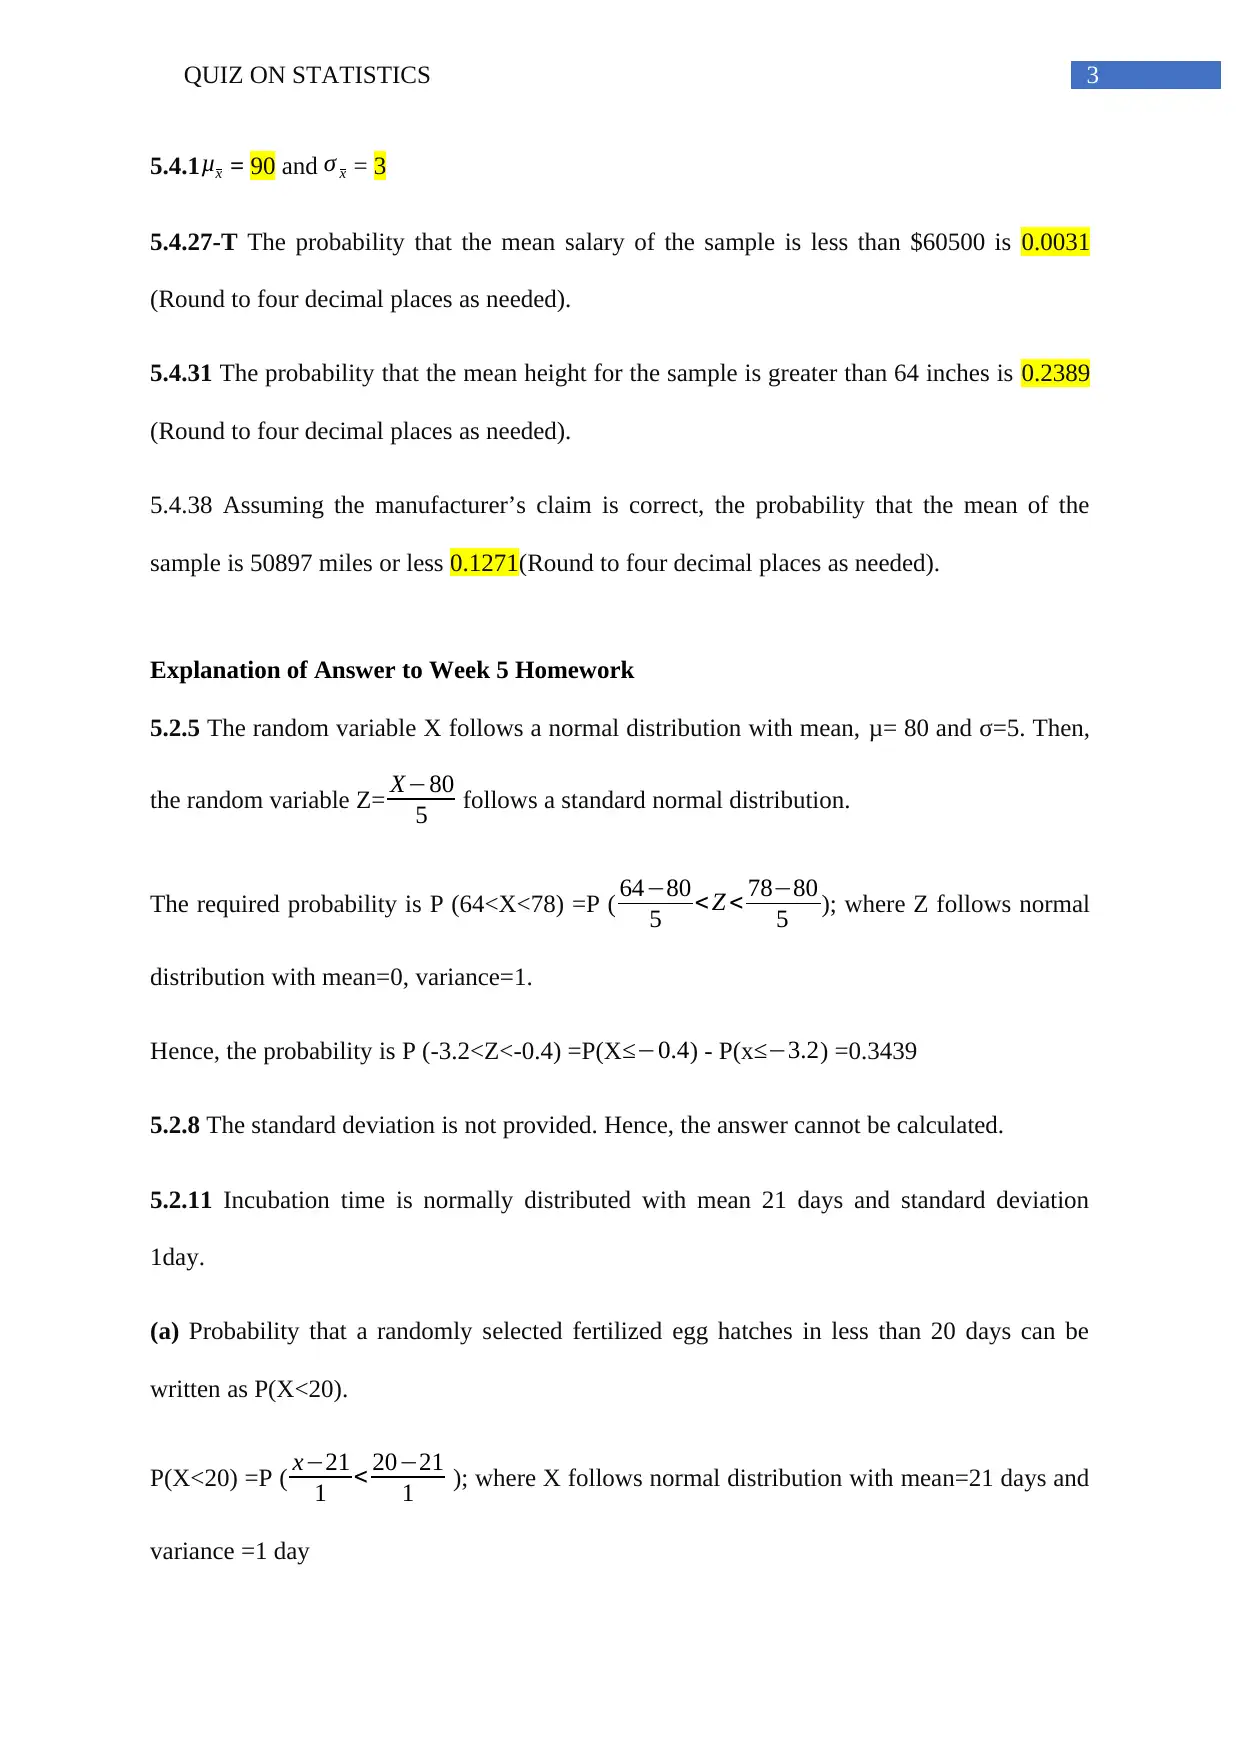
5.4.1μx = 90 and σ x = 3
5.4.27-T The probability that the mean salary of the sample is less than $60500 is 0.0031
(Round to four decimal places as needed).
5.4.31 The probability that the mean height for the sample is greater than 64 inches is 0.2389
(Round to four decimal places as needed).
5.4.38 Assuming the manufacturer’s claim is correct, the probability that the mean of the
sample is 50897 miles or less 0.1271(Round to four decimal places as needed).
Explanation of Answer to Week 5 Homework
5.2.5 The random variable X follows a normal distribution with mean, μ= 80 and σ=5. Then,
the random variable Z= X−80
5 follows a standard normal distribution.
The required probability is P (64<X<78) =P ( 64−80
5 < Z < 78−80
5 ); where Z follows normal
distribution with mean=0, variance=1.
Hence, the probability is P (-3.2<Z<-0.4) =P(X ≤−0.4) - P(x≤−3.2) =0.3439
5.2.8 The standard deviation is not provided. Hence, the answer cannot be calculated.
5.2.11 Incubation time is normally distributed with mean 21 days and standard deviation
1day.
(a) Probability that a randomly selected fertilized egg hatches in less than 20 days can be
written as P(X<20).
P(X<20) =P ( x−21
1 < 20−21
1 ); where X follows normal distribution with mean=21 days and
variance =1 day
Paraphrase This Document
Need a fresh take? Get an instant paraphrase of this document with our AI Paraphraser
4QUIZ ON STATISTICS
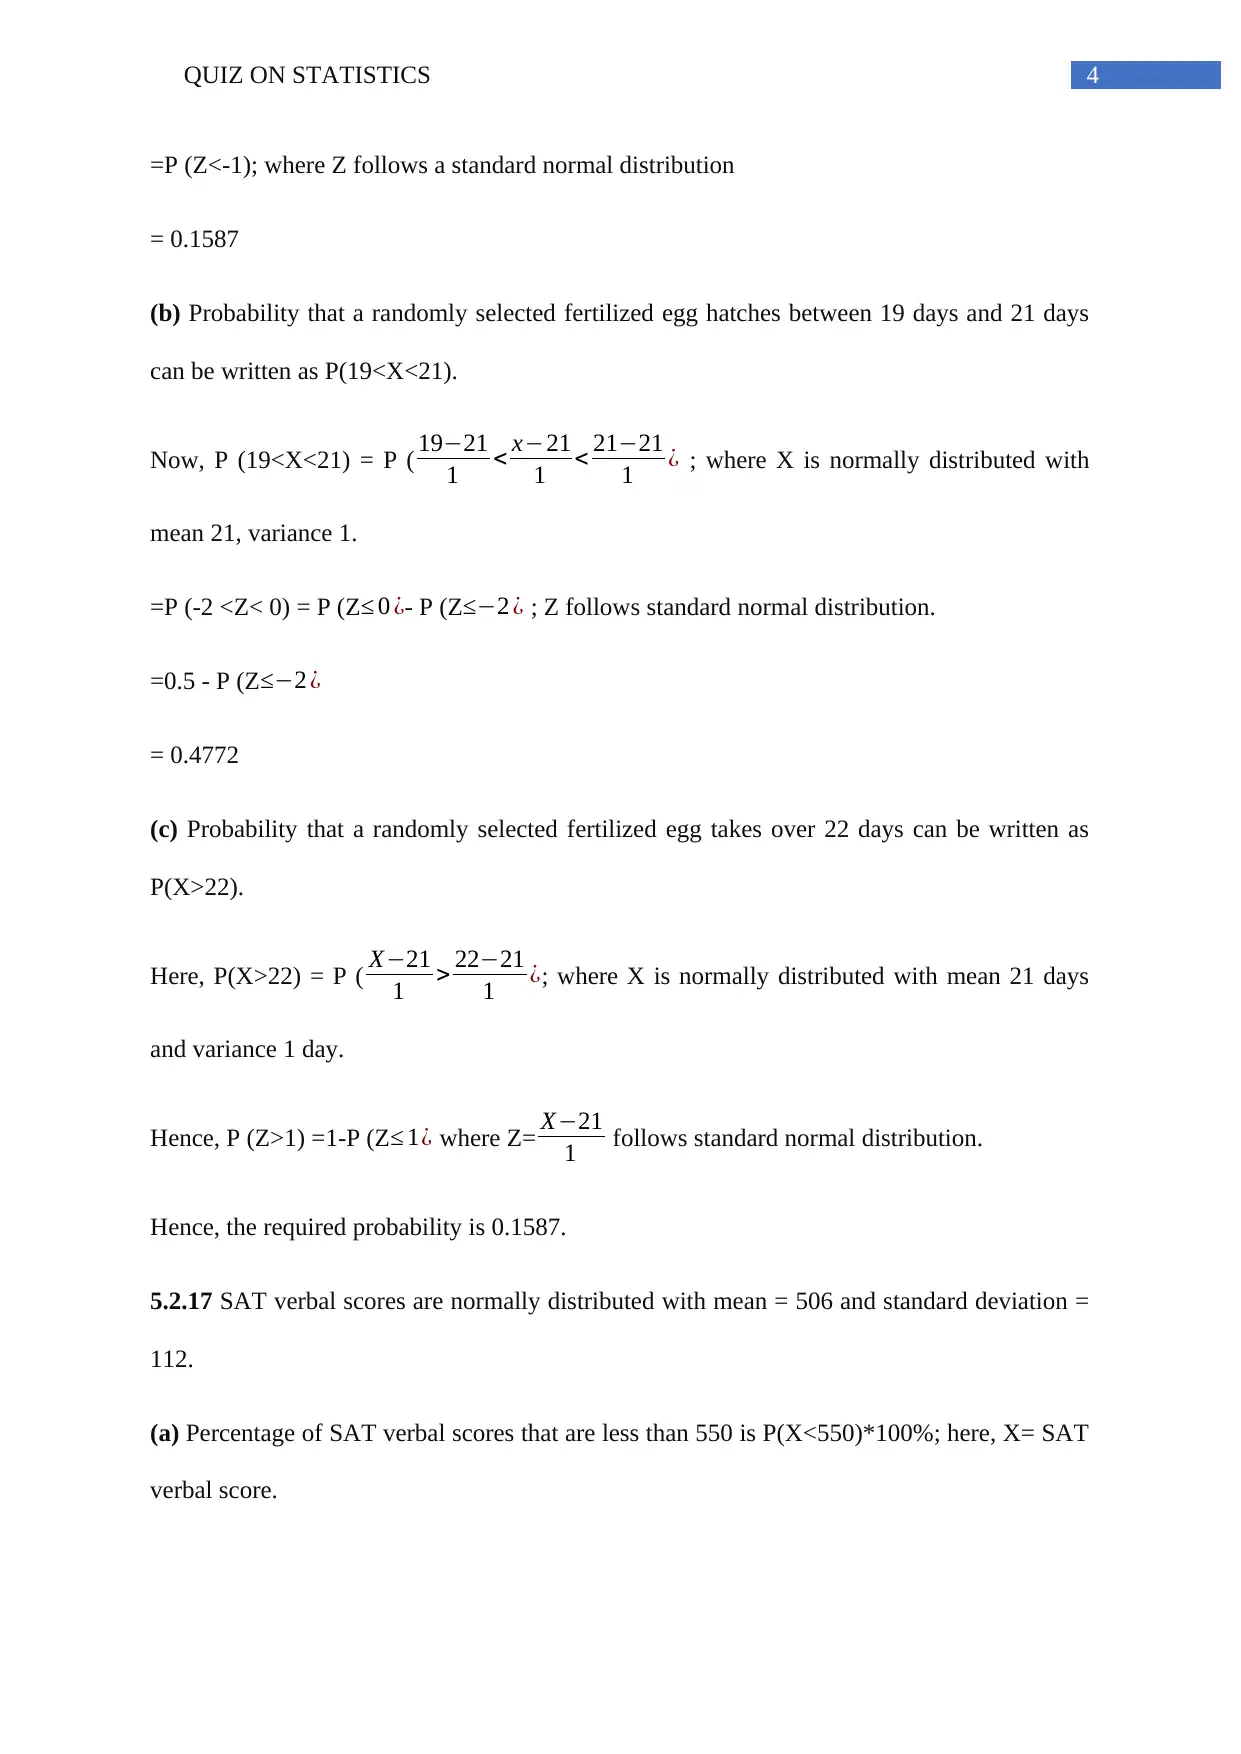
=P (Z<-1); where Z follows a standard normal distribution
= 0.1587
(b) Probability that a randomly selected fertilized egg hatches between 19 days and 21 days
can be written as P(19<X<21).
Now, P (19<X<21) = P ( 19−21
1 < x−21
1 < 21−21
1 ¿ ; where X is normally distributed with
mean 21, variance 1.
=P (-2 <Z< 0) = P (Z≤ 0 ¿- P (Z≤−2 ¿ ; Z follows standard normal distribution.
=0.5 - P (Z≤−2 ¿
= 0.4772
(c) Probability that a randomly selected fertilized egg takes over 22 days can be written as
P(X>22).
Here, P(X>22) = P ( X−21
1 > 22−21
1 ¿; where X is normally distributed with mean 21 days
and variance 1 day.
Hence, P (Z>1) =1-P (Z ≤ 1¿ where Z= X−21
1 follows standard normal distribution.
Hence, the required probability is 0.1587.
5.2.17 SAT verbal scores are normally distributed with mean = 506 and standard deviation =
112.
(a) Percentage of SAT verbal scores that are less than 550 is P(X<550)*100%; here, X= SAT
verbal score.
5QUIZ ON STATISTICS
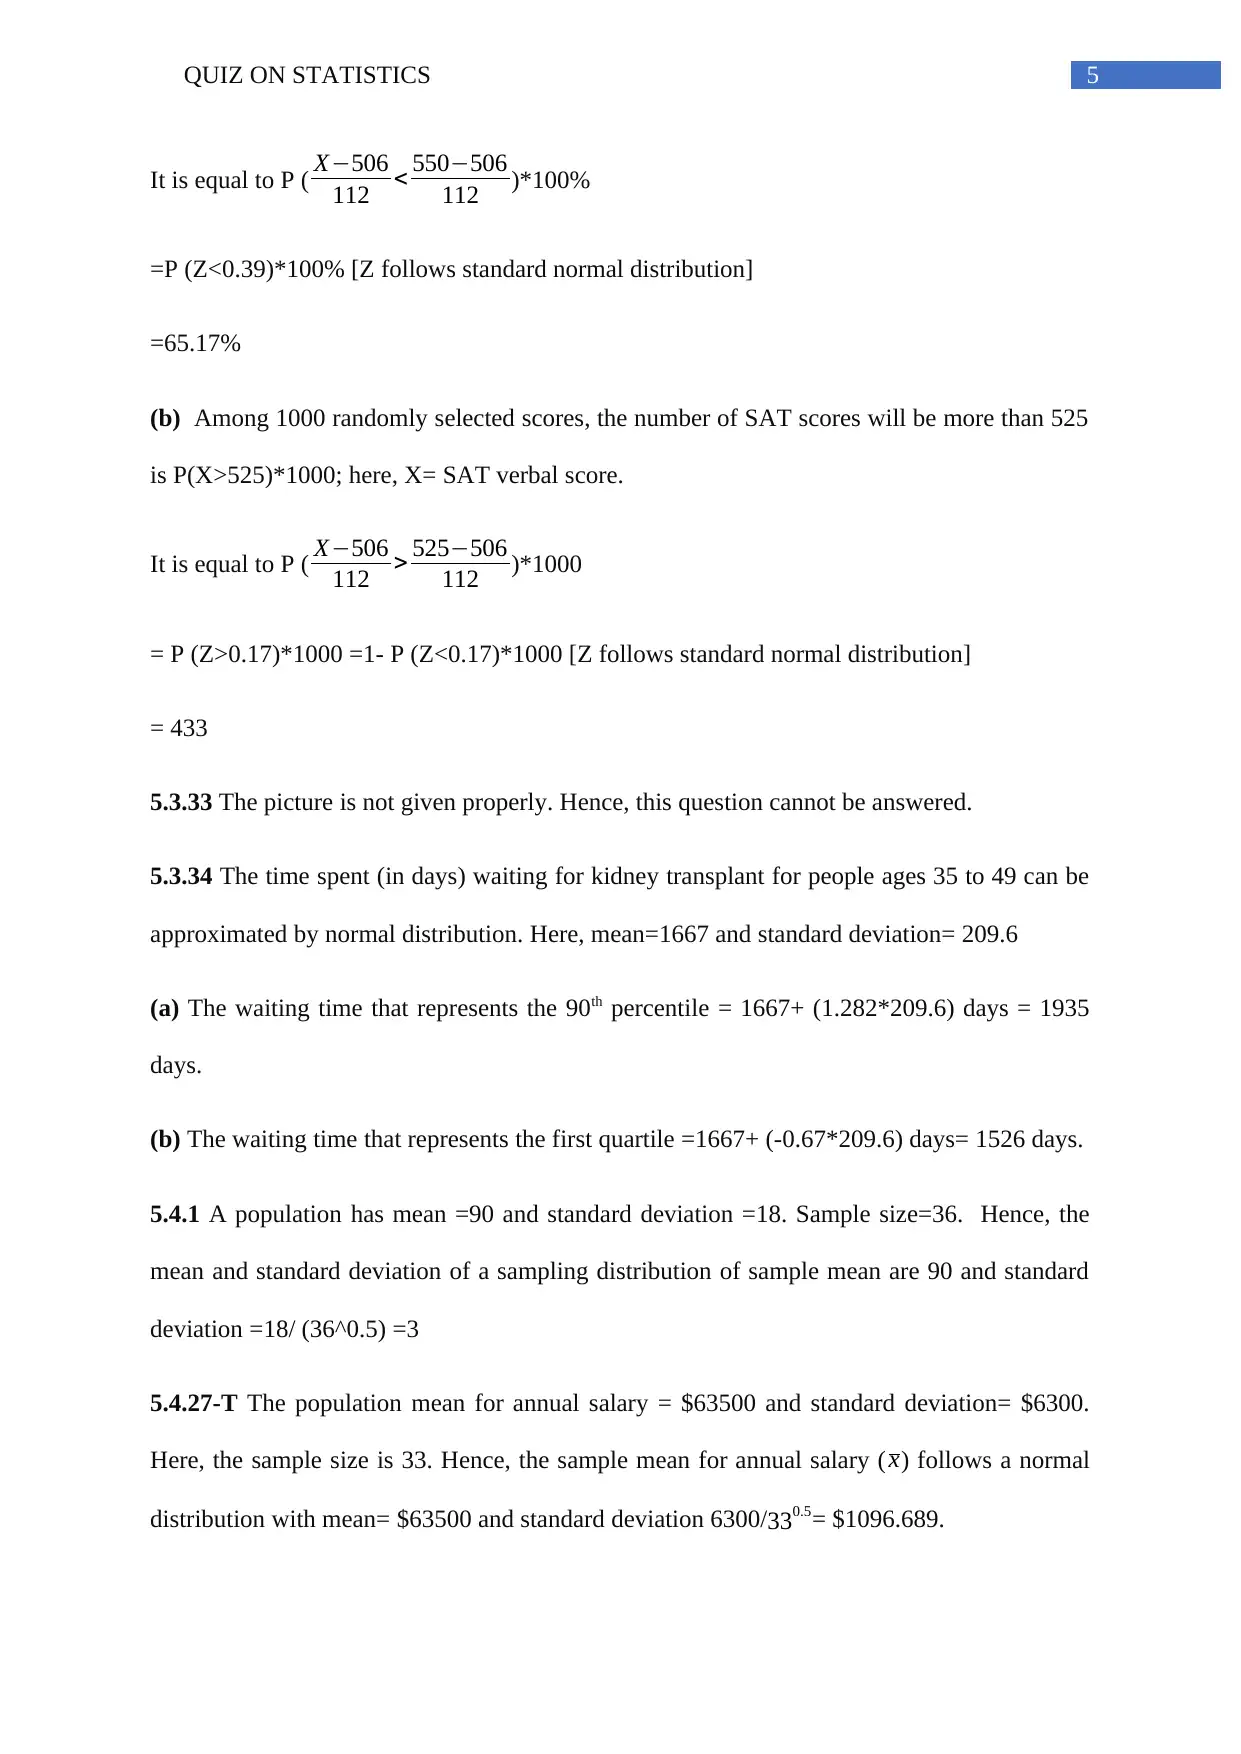
It is equal to P ( X−506
112 < 550−506
112 )*100%
=P (Z<0.39)*100% [Z follows standard normal distribution]
=65.17%
(b) Among 1000 randomly selected scores, the number of SAT scores will be more than 525
is P(X>525)*1000; here, X= SAT verbal score.
It is equal to P ( X−506
112 > 525−506
112 )*1000
= P (Z>0.17)*1000 =1- P (Z<0.17)*1000 [Z follows standard normal distribution]
= 433
5.3.33 The picture is not given properly. Hence, this question cannot be answered.
5.3.34 The time spent (in days) waiting for kidney transplant for people ages 35 to 49 can be
approximated by normal distribution. Here, mean=1667 and standard deviation= 209.6
(a) The waiting time that represents the 90th percentile = 1667+ (1.282*209.6) days = 1935
days.
(b) The waiting time that represents the first quartile =1667+ (-0.67*209.6) days= 1526 days.
5.4.1 A population has mean =90 and standard deviation =18. Sample size=36. Hence, the
mean and standard deviation of a sampling distribution of sample mean are 90 and standard
deviation =18/ (36^0.5) =3
5.4.27-T The population mean for annual salary = $63500 and standard deviation= $6300.
Here, the sample size is 33. Hence, the sample mean for annual salary ( x) follows a normal
distribution with mean= $63500 and standard deviation 6300/330.5= $1096.689.
It is equal to P ( X−506
112 < 550−506
112 )*100%
=P (Z<0.39)*100% [Z follows standard normal distribution]
=65.17%
(b) Among 1000 randomly selected scores, the number of SAT scores will be more than 525
is P(X>525)*1000; here, X= SAT verbal score.
It is equal to P ( X−506
112 > 525−506
112 )*1000
= P (Z>0.17)*1000 =1- P (Z<0.17)*1000 [Z follows standard normal distribution]
= 433
5.3.33 The picture is not given properly. Hence, this question cannot be answered.
5.3.34 The time spent (in days) waiting for kidney transplant for people ages 35 to 49 can be
approximated by normal distribution. Here, mean=1667 and standard deviation= 209.6
(a) The waiting time that represents the 90th percentile = 1667+ (1.282*209.6) days = 1935
days.
(b) The waiting time that represents the first quartile =1667+ (-0.67*209.6) days= 1526 days.
5.4.1 A population has mean =90 and standard deviation =18. Sample size=36. Hence, the
mean and standard deviation of a sampling distribution of sample mean are 90 and standard
deviation =18/ (36^0.5) =3
5.4.27-T The population mean for annual salary = $63500 and standard deviation= $6300.
Here, the sample size is 33. Hence, the sample mean for annual salary ( x) follows a normal
distribution with mean= $63500 and standard deviation 6300/330.5= $1096.689.
⊘ This is a preview!⊘
Do you want full access?
Subscribe today to unlock all pages.
Trusted by 1+ million students worldwide
6QUIZ ON STATISTICS
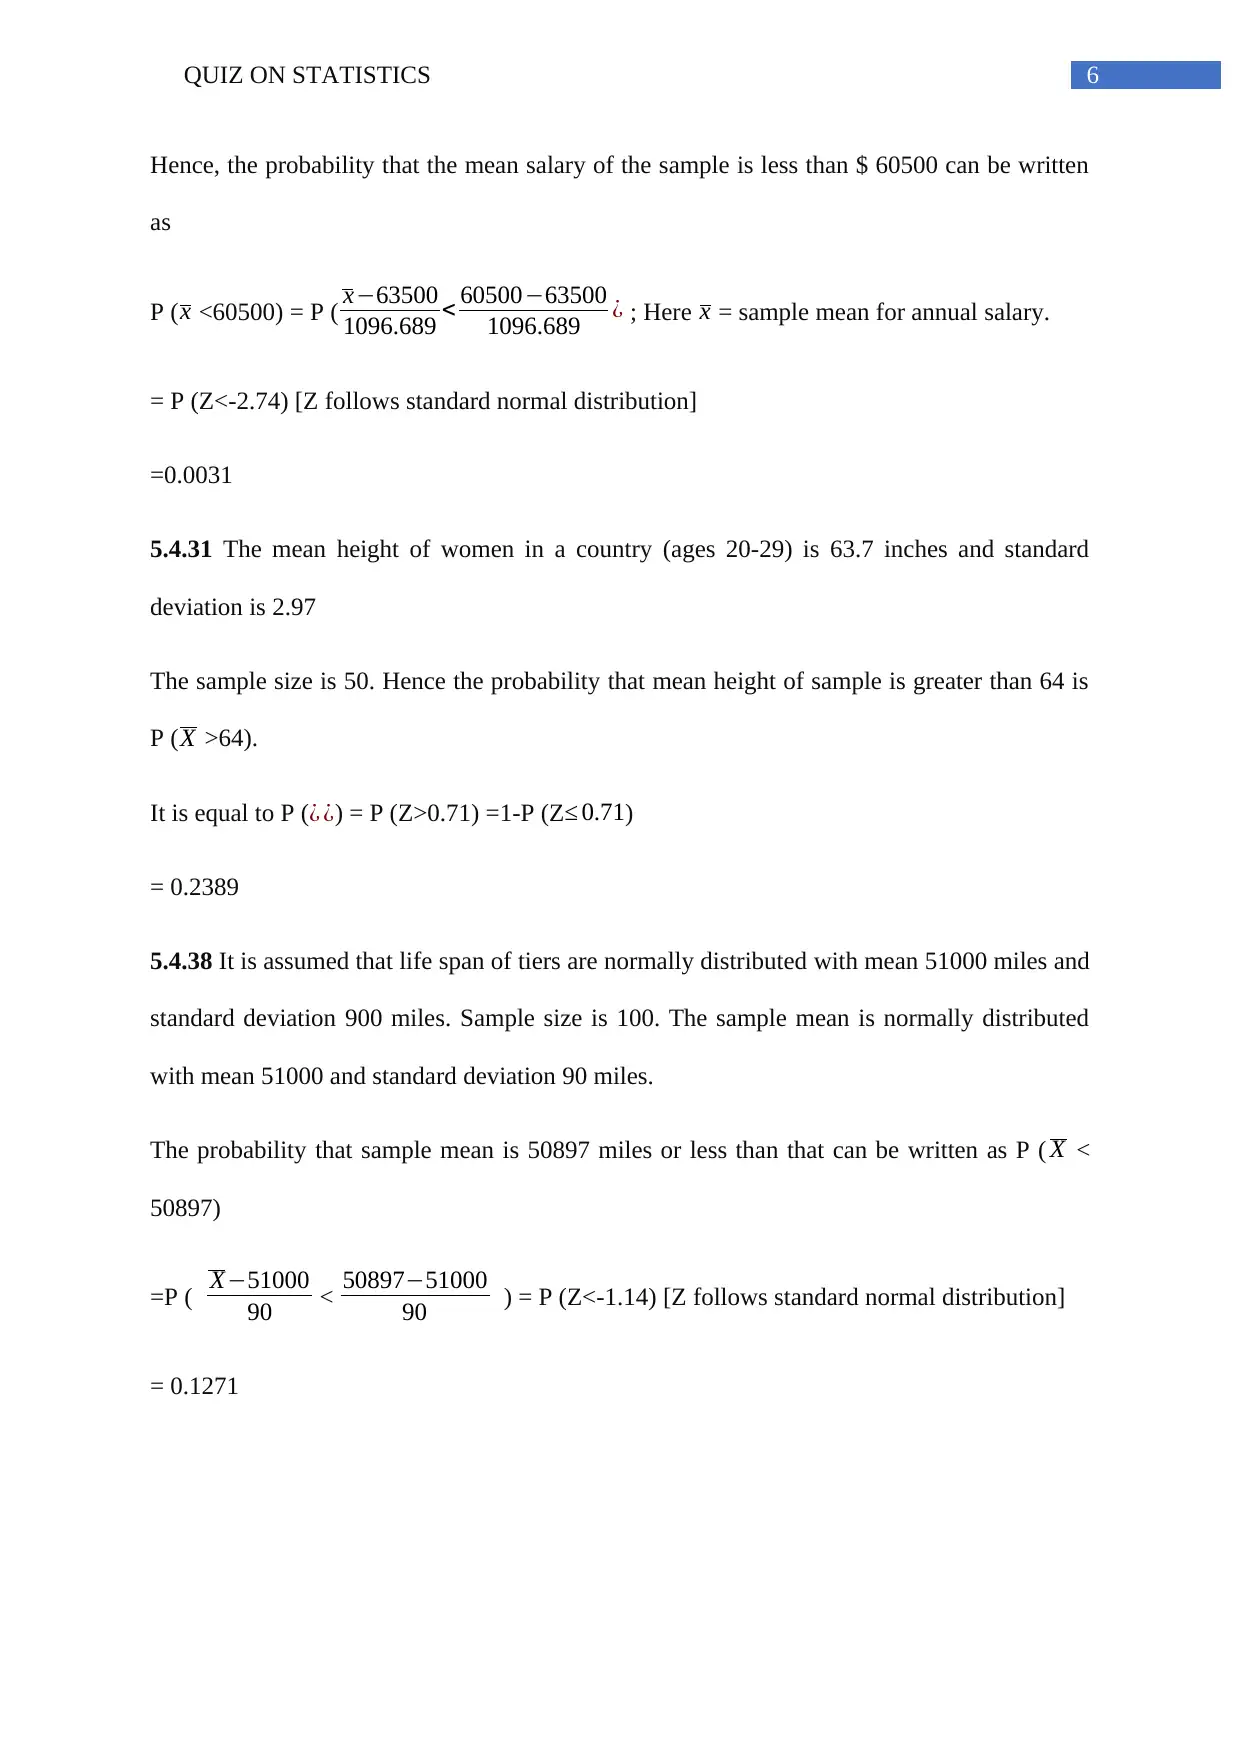
Hence, the probability that the mean salary of the sample is less than $ 60500 can be written
as
P ( x <60500) = P ( x−63500
1096.689 < 60500−63500
1096.689 ¿ ; Here x = sample mean for annual salary.
= P (Z<-2.74) [Z follows standard normal distribution]
=0.0031
5.4.31 The mean height of women in a country (ages 20-29) is 63.7 inches and standard
deviation is 2.97
The sample size is 50. Hence the probability that mean height of sample is greater than 64 is
P ( X >64).
It is equal to P (¿ ¿) = P (Z>0.71) =1-P (Z≤ 0.71)
= 0.2389
5.4.38 It is assumed that life span of tiers are normally distributed with mean 51000 miles and
standard deviation 900 miles. Sample size is 100. The sample mean is normally distributed
with mean 51000 and standard deviation 90 miles.
The probability that sample mean is 50897 miles or less than that can be written as P ( X <
50897)
=P ( X−51000
90 < 50897−51000
90 ) = P (Z<-1.14) [Z follows standard normal distribution]
= 0.1271
Paraphrase This Document
Need a fresh take? Get an instant paraphrase of this document with our AI Paraphraser
7QUIZ ON STATISTICS
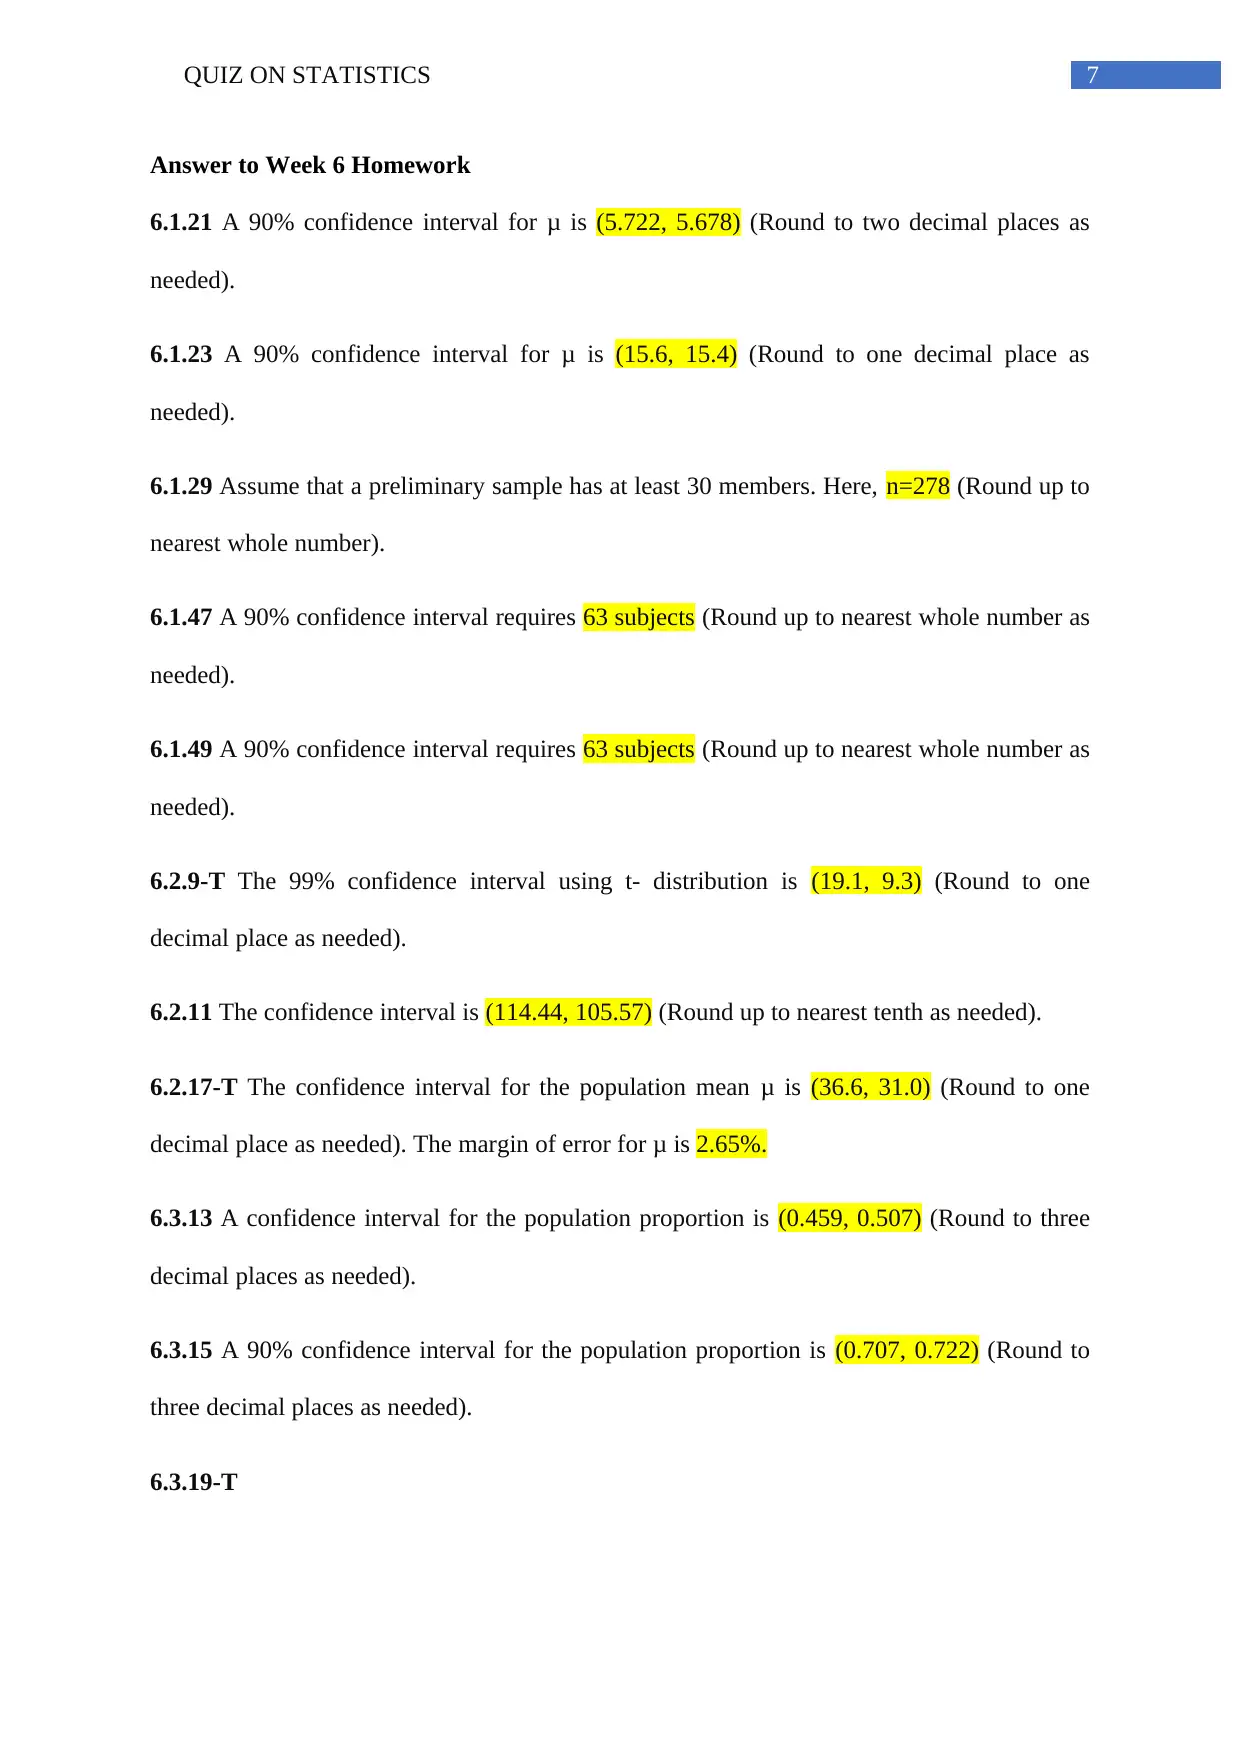
Answer to Week 6 Homework
6.1.21 A 90% confidence interval for μ is (5.722, 5.678) (Round to two decimal places as
needed).
6.1.23 A 90% confidence interval for μ is (15.6, 15.4) (Round to one decimal place as
needed).
6.1.29 Assume that a preliminary sample has at least 30 members. Here, n=278 (Round up to
nearest whole number).
6.1.47 A 90% confidence interval requires 63 subjects (Round up to nearest whole number as
needed).
6.1.49 A 90% confidence interval requires 63 subjects (Round up to nearest whole number as
needed).
6.2.9-T The 99% confidence interval using t- distribution is (19.1, 9.3) (Round to one
decimal place as needed).
6.2.11 The confidence interval is (114.44, 105.57) (Round up to nearest tenth as needed).
6.2.17-T The confidence interval for the population mean μ is (36.6, 31.0) (Round to one
decimal place as needed). The margin of error for μ is 2.65%.
6.3.13 A confidence interval for the population proportion is (0.459, 0.507) (Round to three
decimal places as needed).
6.3.15 A 90% confidence interval for the population proportion is (0.707, 0.722) (Round to
three decimal places as needed).
6.3.19-T
8QUIZ ON STATISTICS
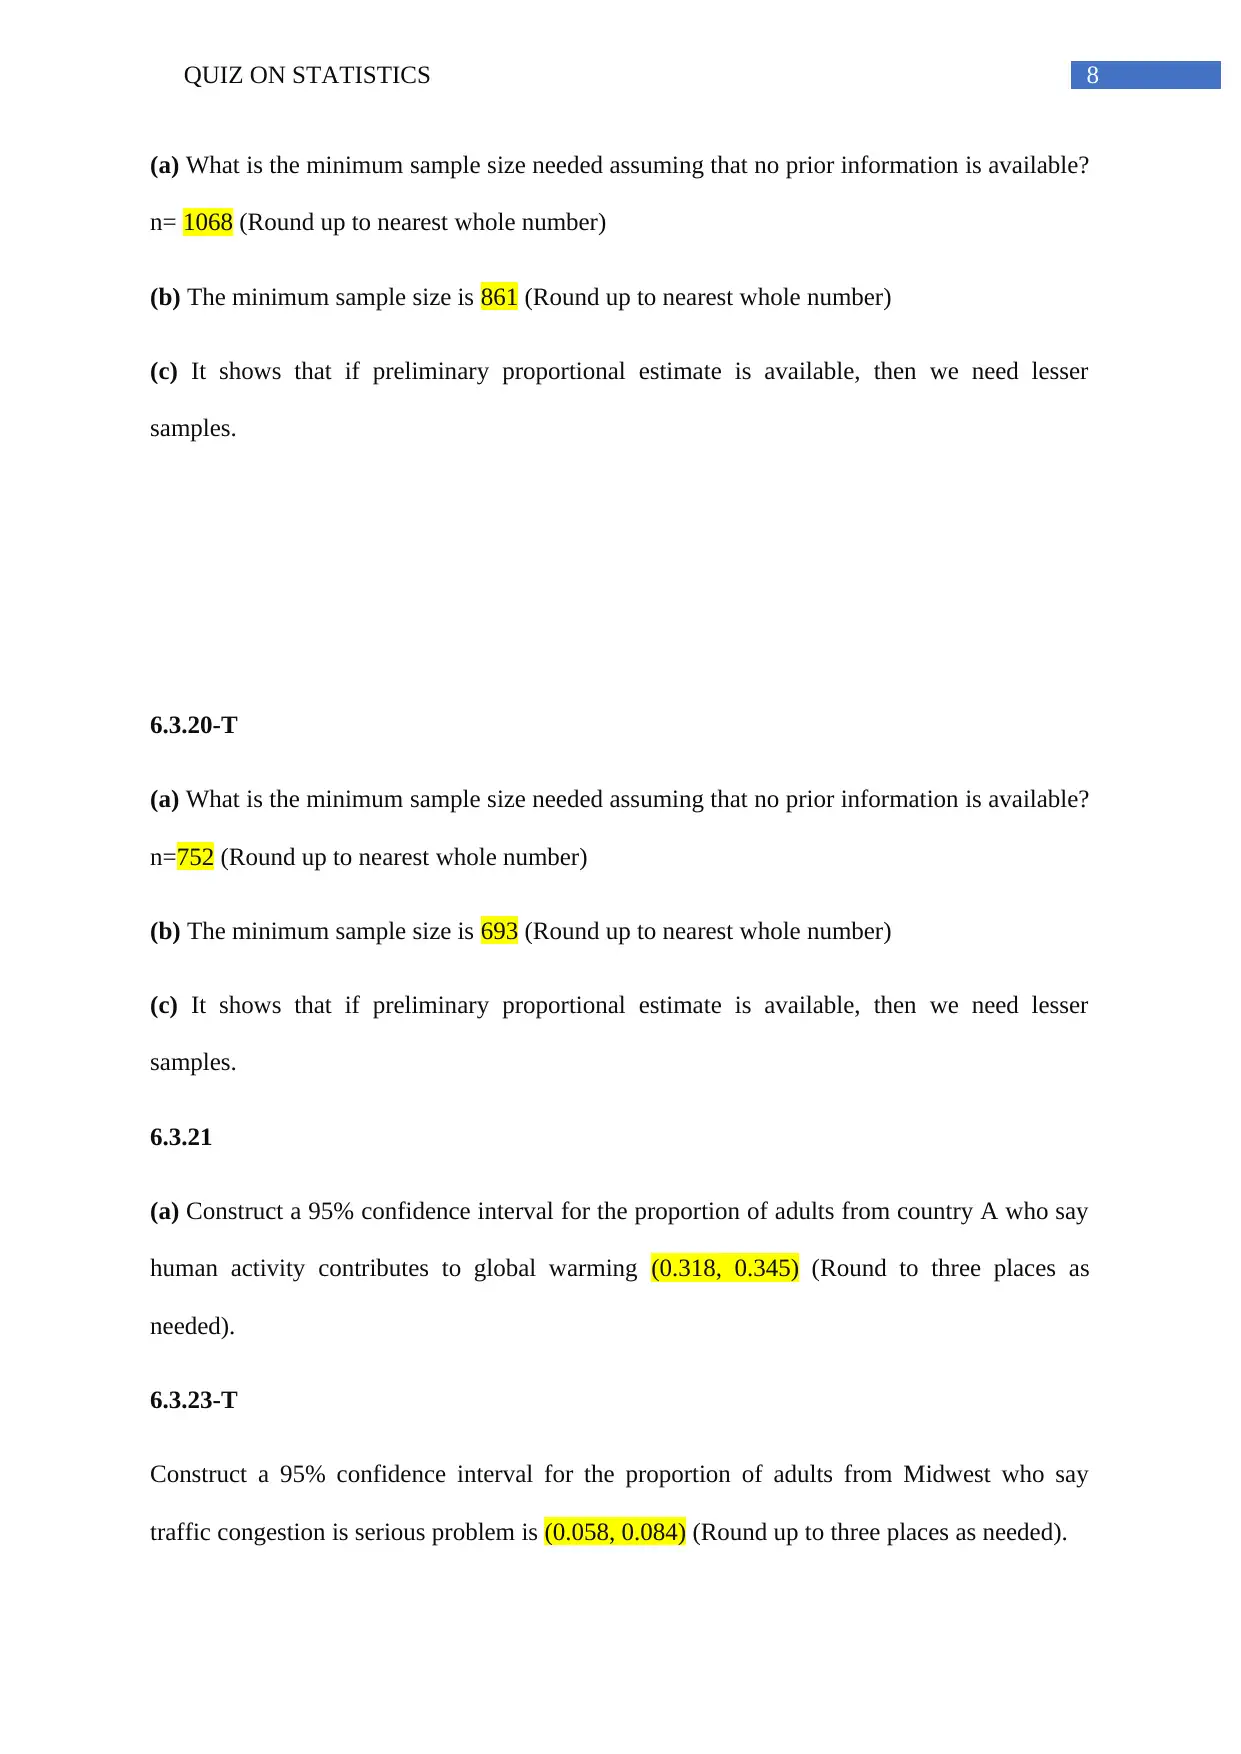
(a) What is the minimum sample size needed assuming that no prior information is available?
n= 1068 (Round up to nearest whole number)
(b) The minimum sample size is 861 (Round up to nearest whole number)
(c) It shows that if preliminary proportional estimate is available, then we need lesser
samples.
6.3.20-T
(a) What is the minimum sample size needed assuming that no prior information is available?
n=752 (Round up to nearest whole number)
(b) The minimum sample size is 693 (Round up to nearest whole number)
(c) It shows that if preliminary proportional estimate is available, then we need lesser
samples.
6.3.21
(a) Construct a 95% confidence interval for the proportion of adults from country A who say
human activity contributes to global warming (0.318, 0.345) (Round to three places as
needed).
6.3.23-T
Construct a 95% confidence interval for the proportion of adults from Midwest who say
traffic congestion is serious problem is (0.058, 0.084) (Round up to three places as needed).
(a) What is the minimum sample size needed assuming that no prior information is available?
n= 1068 (Round up to nearest whole number)
(b) The minimum sample size is 861 (Round up to nearest whole number)
(c) It shows that if preliminary proportional estimate is available, then we need lesser
samples.
6.3.20-T
(a) What is the minimum sample size needed assuming that no prior information is available?
n=752 (Round up to nearest whole number)
(b) The minimum sample size is 693 (Round up to nearest whole number)
(c) It shows that if preliminary proportional estimate is available, then we need lesser
samples.
6.3.21
(a) Construct a 95% confidence interval for the proportion of adults from country A who say
human activity contributes to global warming (0.318, 0.345) (Round to three places as
needed).
6.3.23-T
Construct a 95% confidence interval for the proportion of adults from Midwest who say
traffic congestion is serious problem is (0.058, 0.084) (Round up to three places as needed).
⊘ This is a preview!⊘
Do you want full access?
Subscribe today to unlock all pages.
Trusted by 1+ million students worldwide
9QUIZ ON STATISTICS
Explanation of Answer to Week 6 Homework
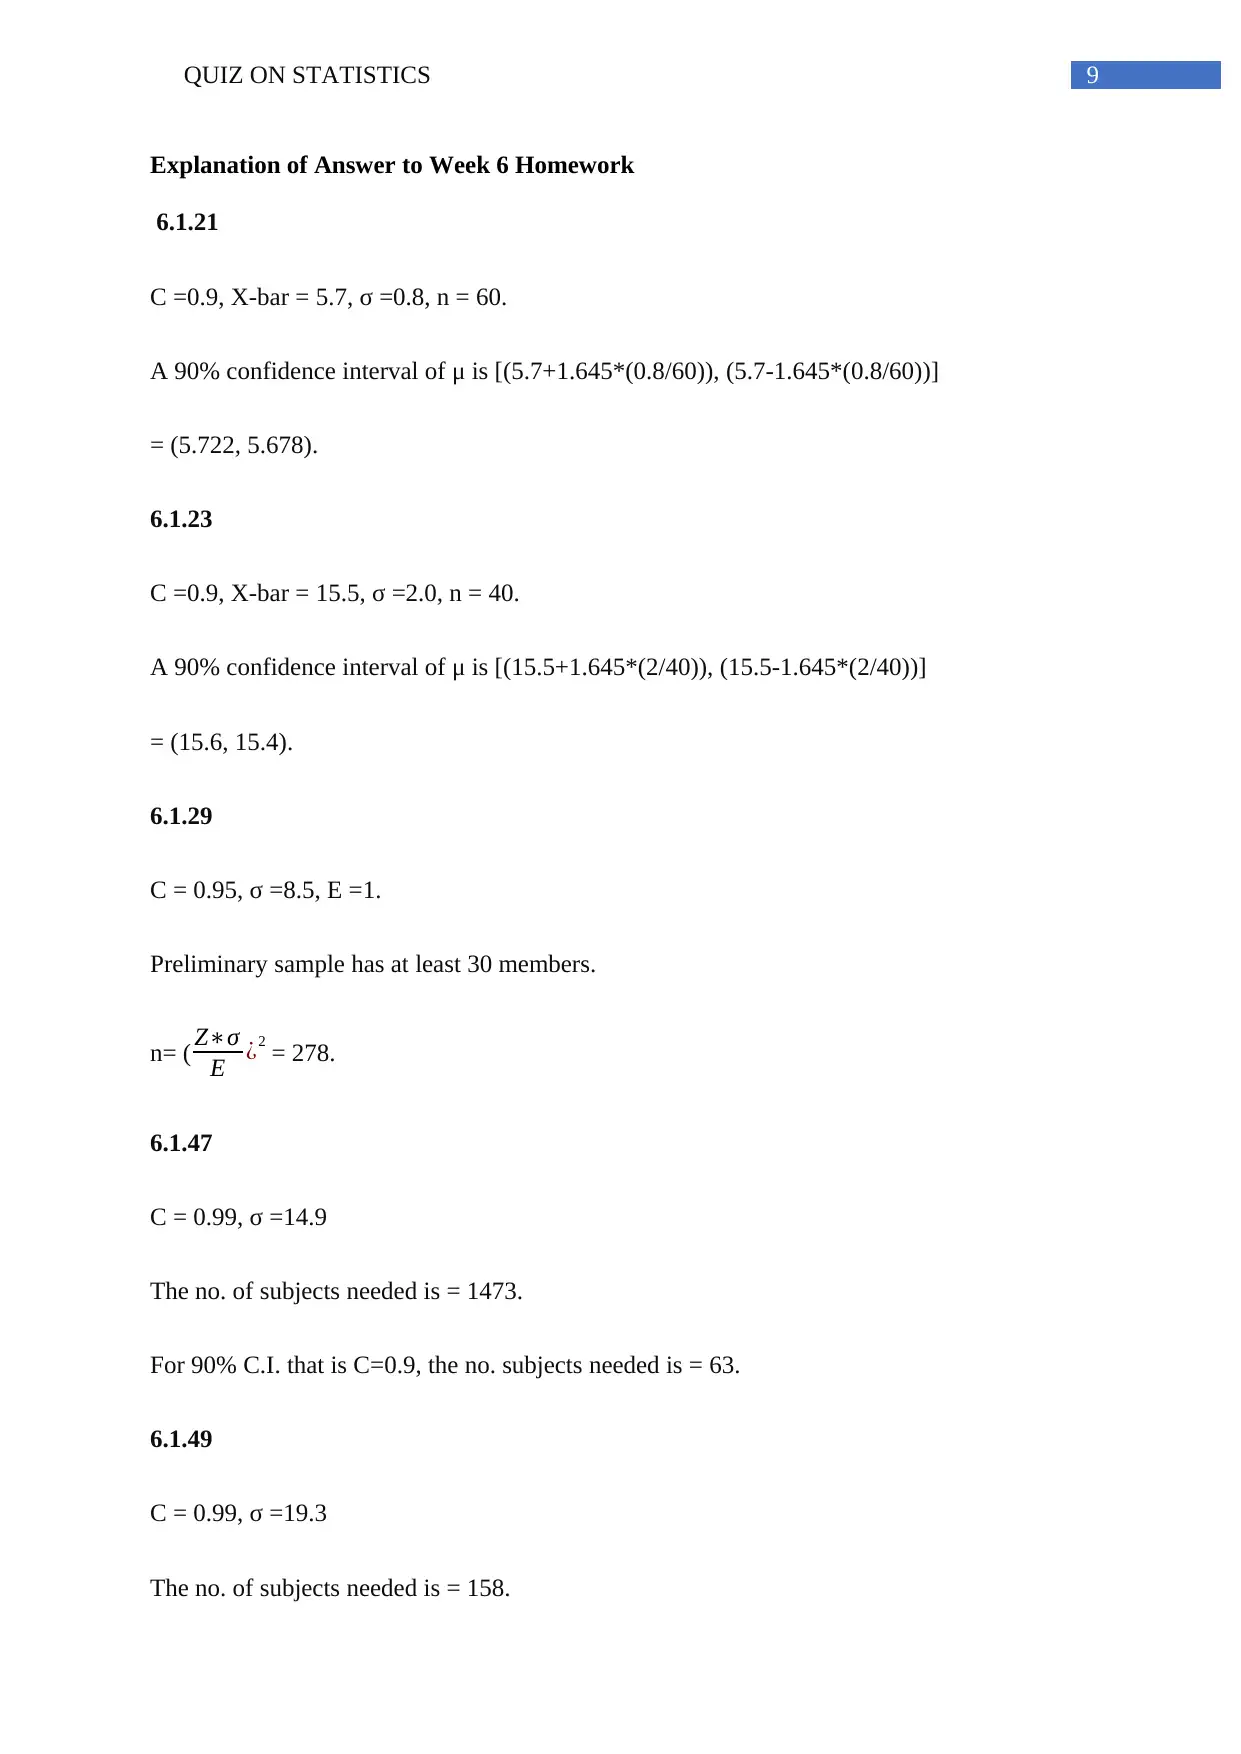
6.1.21
C =0.9, X-bar = 5.7, σ =0.8, n = 60.
A 90% confidence interval of μ is [(5.7+1.645*(0.8/60)), (5.7-1.645*(0.8/60))]
= (5.722, 5.678).
6.1.23
C =0.9, X-bar = 15.5, σ =2.0, n = 40.
A 90% confidence interval of μ is [(15.5+1.645*(2/40)), (15.5-1.645*(2/40))]
= (15.6, 15.4).
6.1.29
C = 0.95, σ =8.5, E =1.
Preliminary sample has at least 30 members.
n= ( Z∗σ
E ¿2
= 278.
6.1.47
C = 0.99, σ =14.9
The no. of subjects needed is = 1473.
For 90% C.I. that is C=0.9, the no. subjects needed is = 63.
6.1.49
C = 0.99, σ =19.3
The no. of subjects needed is = 158.
Explanation of Answer to Week 6 Homework
6.1.21
C =0.9, X-bar = 5.7, σ =0.8, n = 60.
A 90% confidence interval of μ is [(5.7+1.645*(0.8/60)), (5.7-1.645*(0.8/60))]
= (5.722, 5.678).
6.1.23
C =0.9, X-bar = 15.5, σ =2.0, n = 40.
A 90% confidence interval of μ is [(15.5+1.645*(2/40)), (15.5-1.645*(2/40))]
= (15.6, 15.4).
6.1.29
C = 0.95, σ =8.5, E =1.
Preliminary sample has at least 30 members.
n= ( Z∗σ
E ¿2
= 278.
6.1.47
C = 0.99, σ =14.9
The no. of subjects needed is = 1473.
For 90% C.I. that is C=0.9, the no. subjects needed is = 63.
6.1.49
C = 0.99, σ =19.3
The no. of subjects needed is = 158.
Paraphrase This Document
Need a fresh take? Get an instant paraphrase of this document with our AI Paraphraser
10QUIZ ON STATISTICS
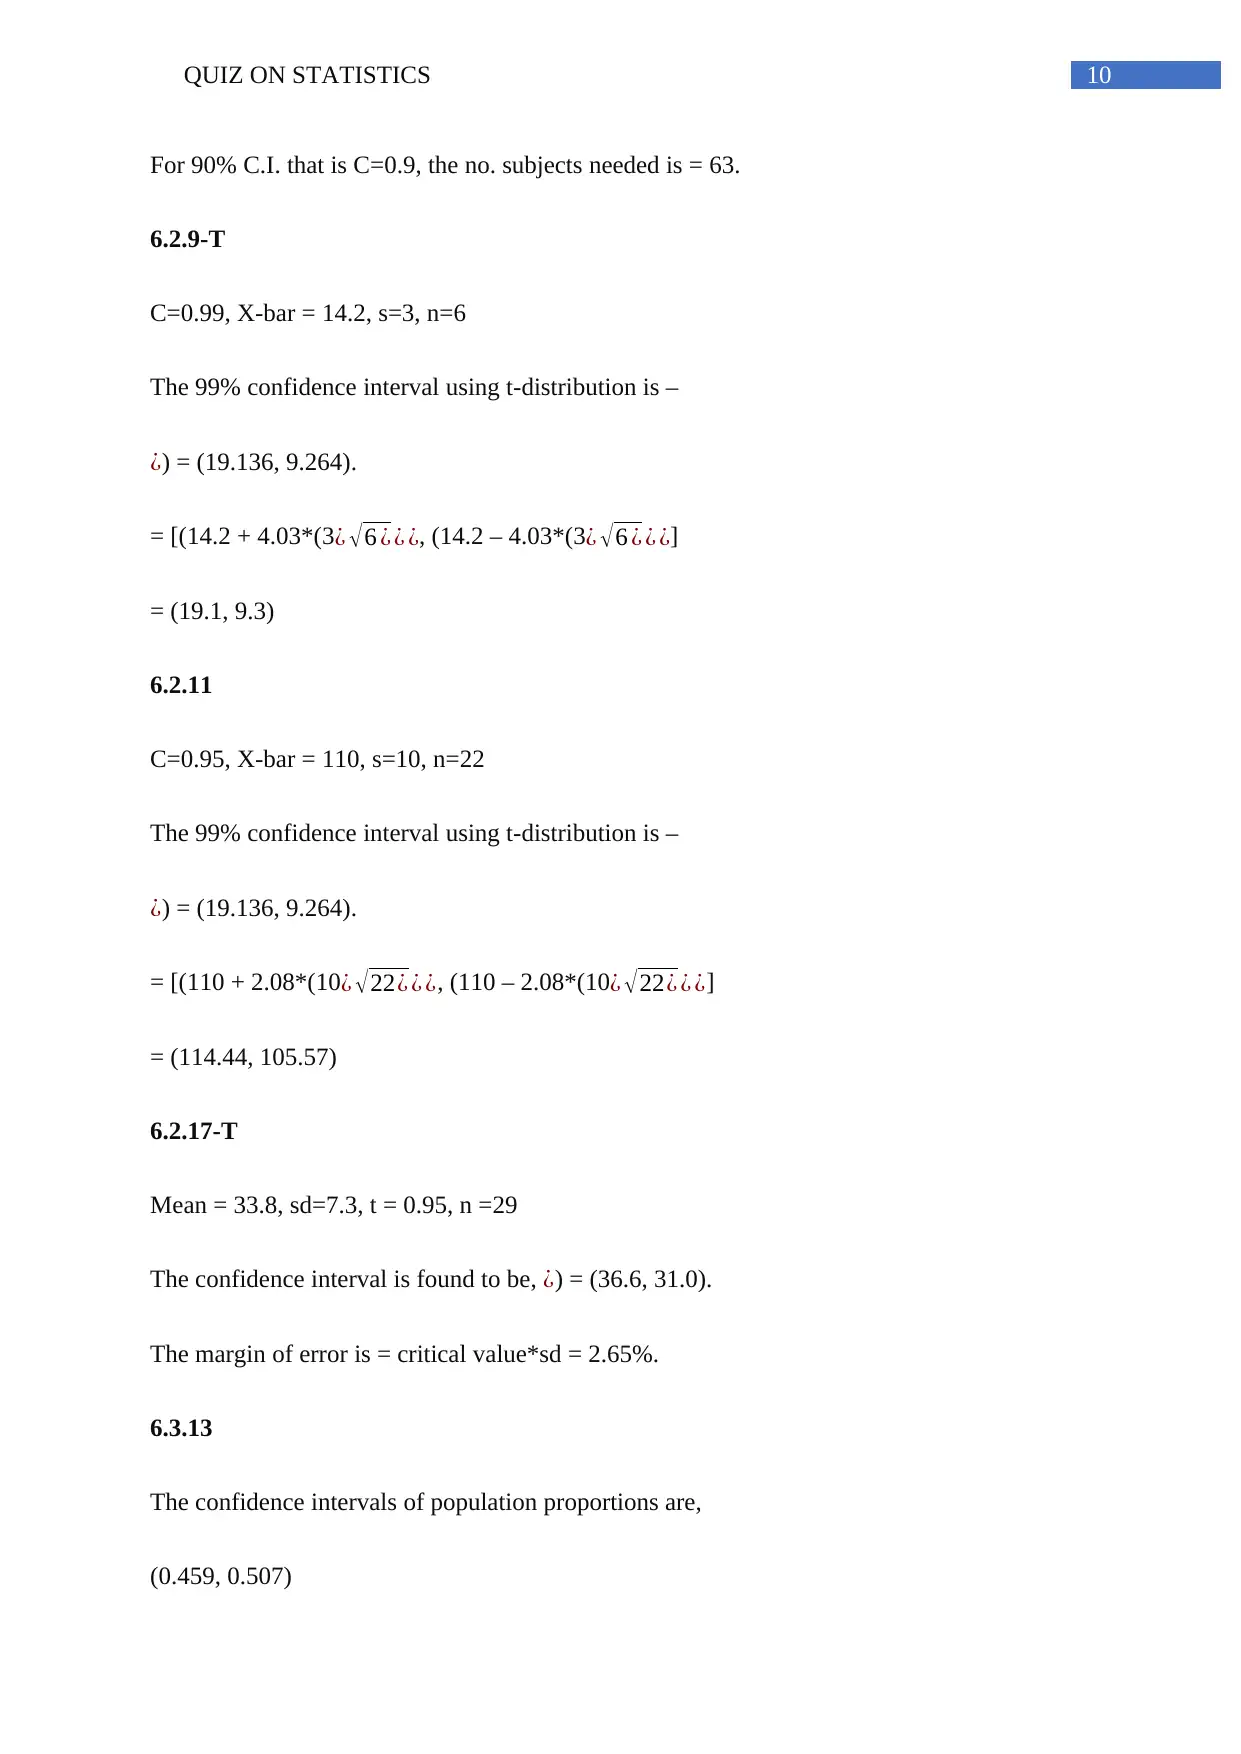
For 90% C.I. that is C=0.9, the no. subjects needed is = 63.
6.2.9-T
C=0.99, X-bar = 14.2, s=3, n=6
The 99% confidence interval using t-distribution is –
¿) = (19.136, 9.264).
= [(14.2 + 4.03*(3¿ √6 ¿ ¿ ¿, (14.2 – 4.03*(3¿ √6 ¿ ¿ ¿]
= (19.1, 9.3)
6.2.11
C=0.95, X-bar = 110, s=10, n=22
The 99% confidence interval using t-distribution is –
¿) = (19.136, 9.264).
= [(110 + 2.08*(10¿ √22¿ ¿ ¿, (110 – 2.08*(10¿ √22¿ ¿ ¿]
= (114.44, 105.57)
6.2.17-T
Mean = 33.8, sd=7.3, t = 0.95, n =29
The confidence interval is found to be, ¿) = (36.6, 31.0).
The margin of error is = critical value*sd = 2.65%.
6.3.13
The confidence intervals of population proportions are,
(0.459, 0.507)
11QUIZ ON STATISTICS
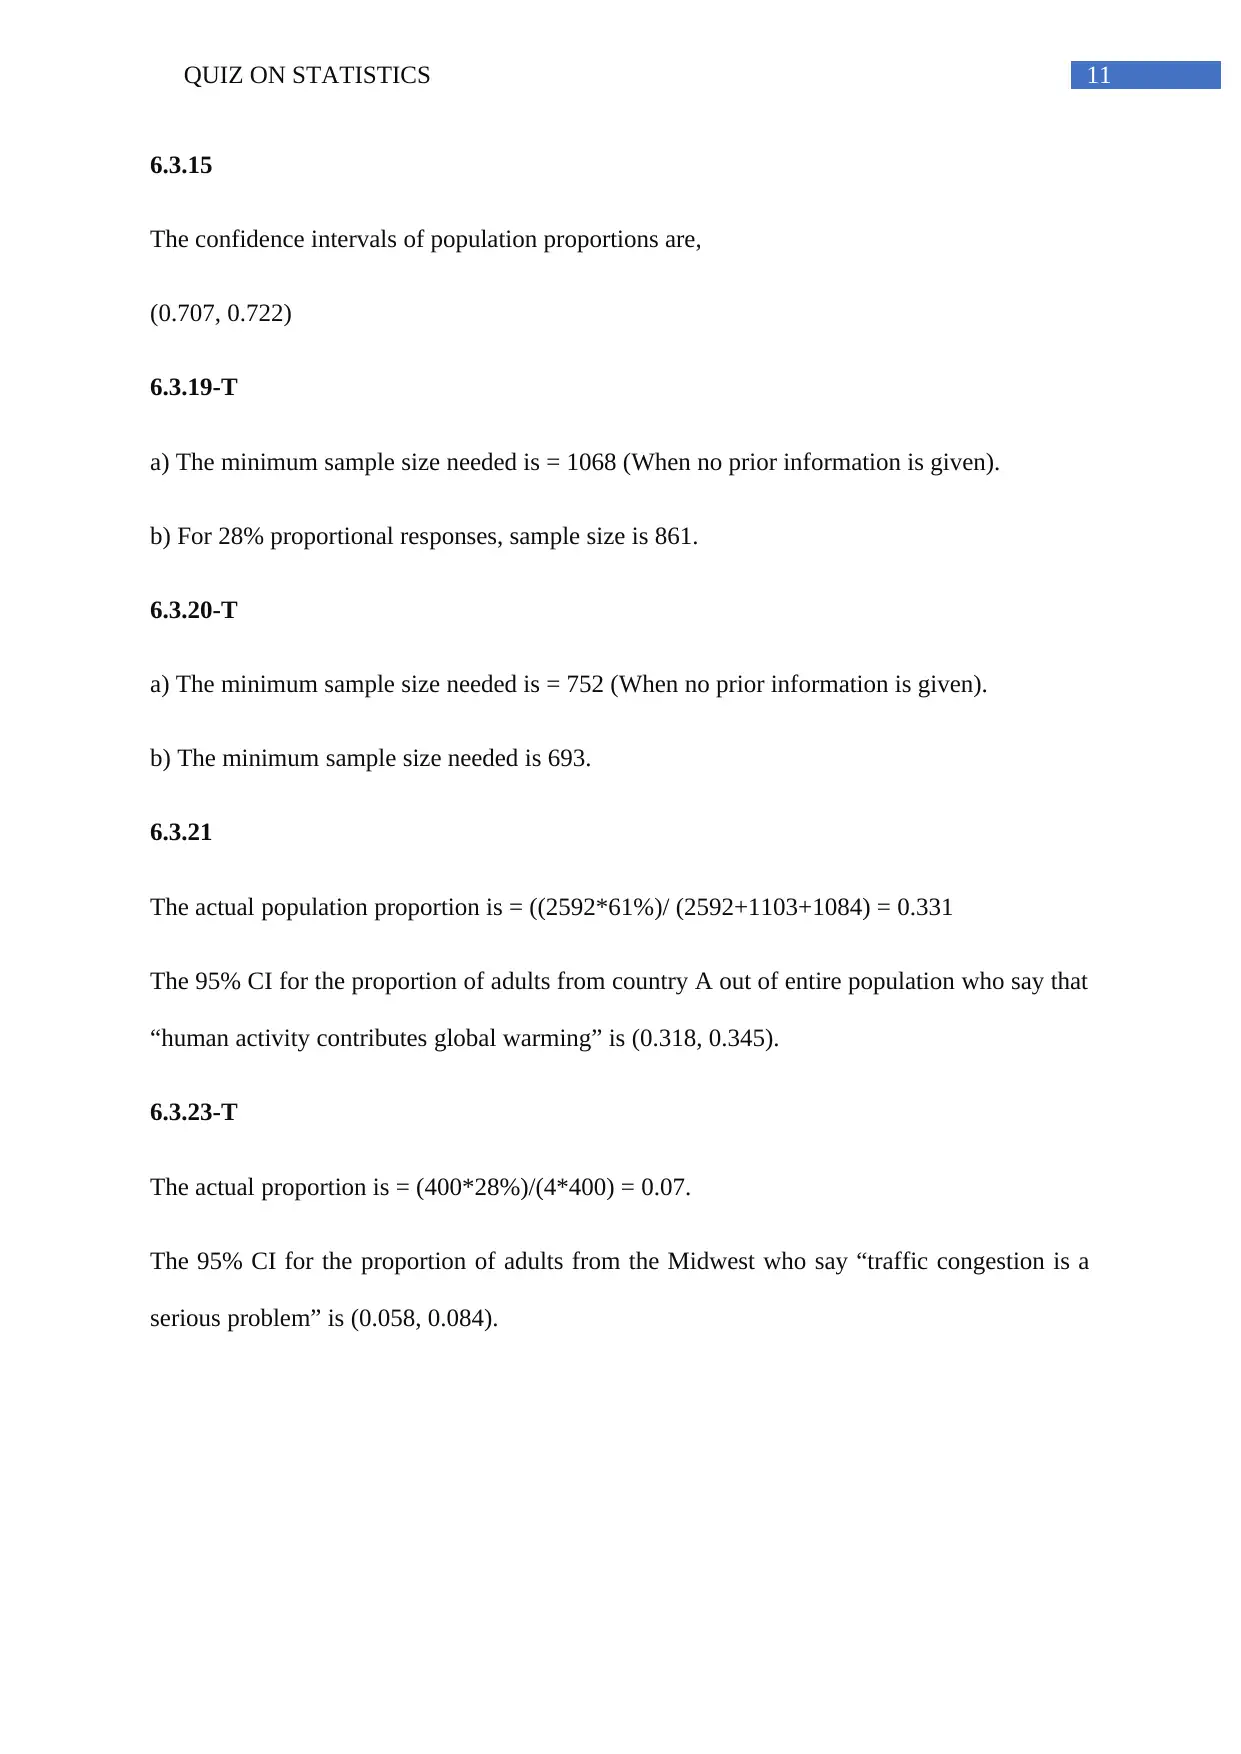
6.3.15
The confidence intervals of population proportions are,
(0.707, 0.722)
6.3.19-T
a) The minimum sample size needed is = 1068 (When no prior information is given).
b) For 28% proportional responses, sample size is 861.
6.3.20-T
a) The minimum sample size needed is = 752 (When no prior information is given).
b) The minimum sample size needed is 693.
6.3.21
The actual population proportion is = ((2592*61%)/ (2592+1103+1084) = 0.331
The 95% CI for the proportion of adults from country A out of entire population who say that
“human activity contributes global warming” is (0.318, 0.345).
6.3.23-T
The actual proportion is = (400*28%)/(4*400) = 0.07.
The 95% CI for the proportion of adults from the Midwest who say “traffic congestion is a
serious problem” is (0.058, 0.084).
⊘ This is a preview!⊘
Do you want full access?
Subscribe today to unlock all pages.
Trusted by 1+ million students worldwide
1 out of 13
Your All-in-One AI-Powered Toolkit for Academic Success.
+13062052269
info@desklib.com
Available 24*7 on WhatsApp / Email
![[object Object]](/_next/static/media/star-bottom.7253800d.svg)
Unlock your academic potential
Copyright © 2020–2026 A2Z Services. All Rights Reserved. Developed and managed by ZUCOL.