Statistics Homework: Regression, ANOVA, Hypothesis Testing, Analysis
VerifiedAdded on 2020/05/16
|9
|1680
|204
Homework Assignment
AI Summary
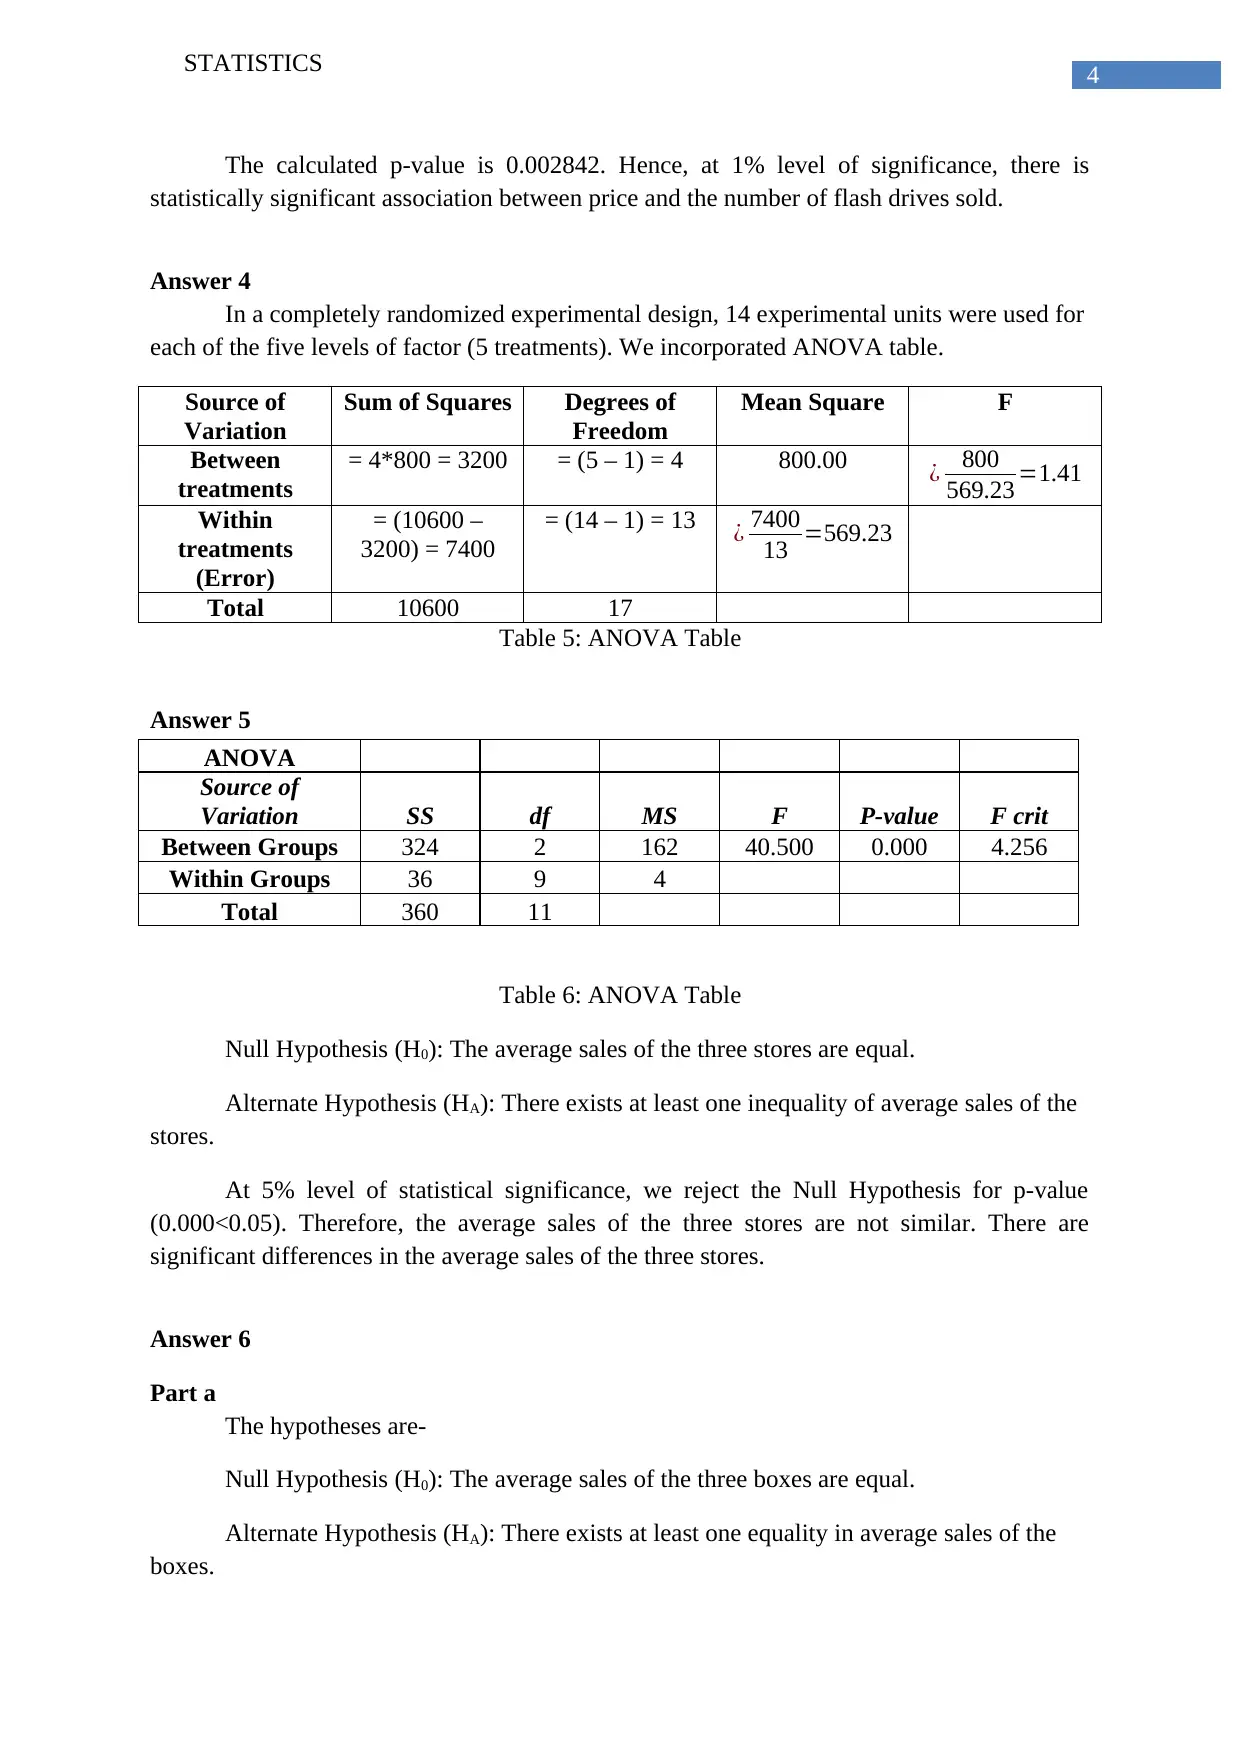
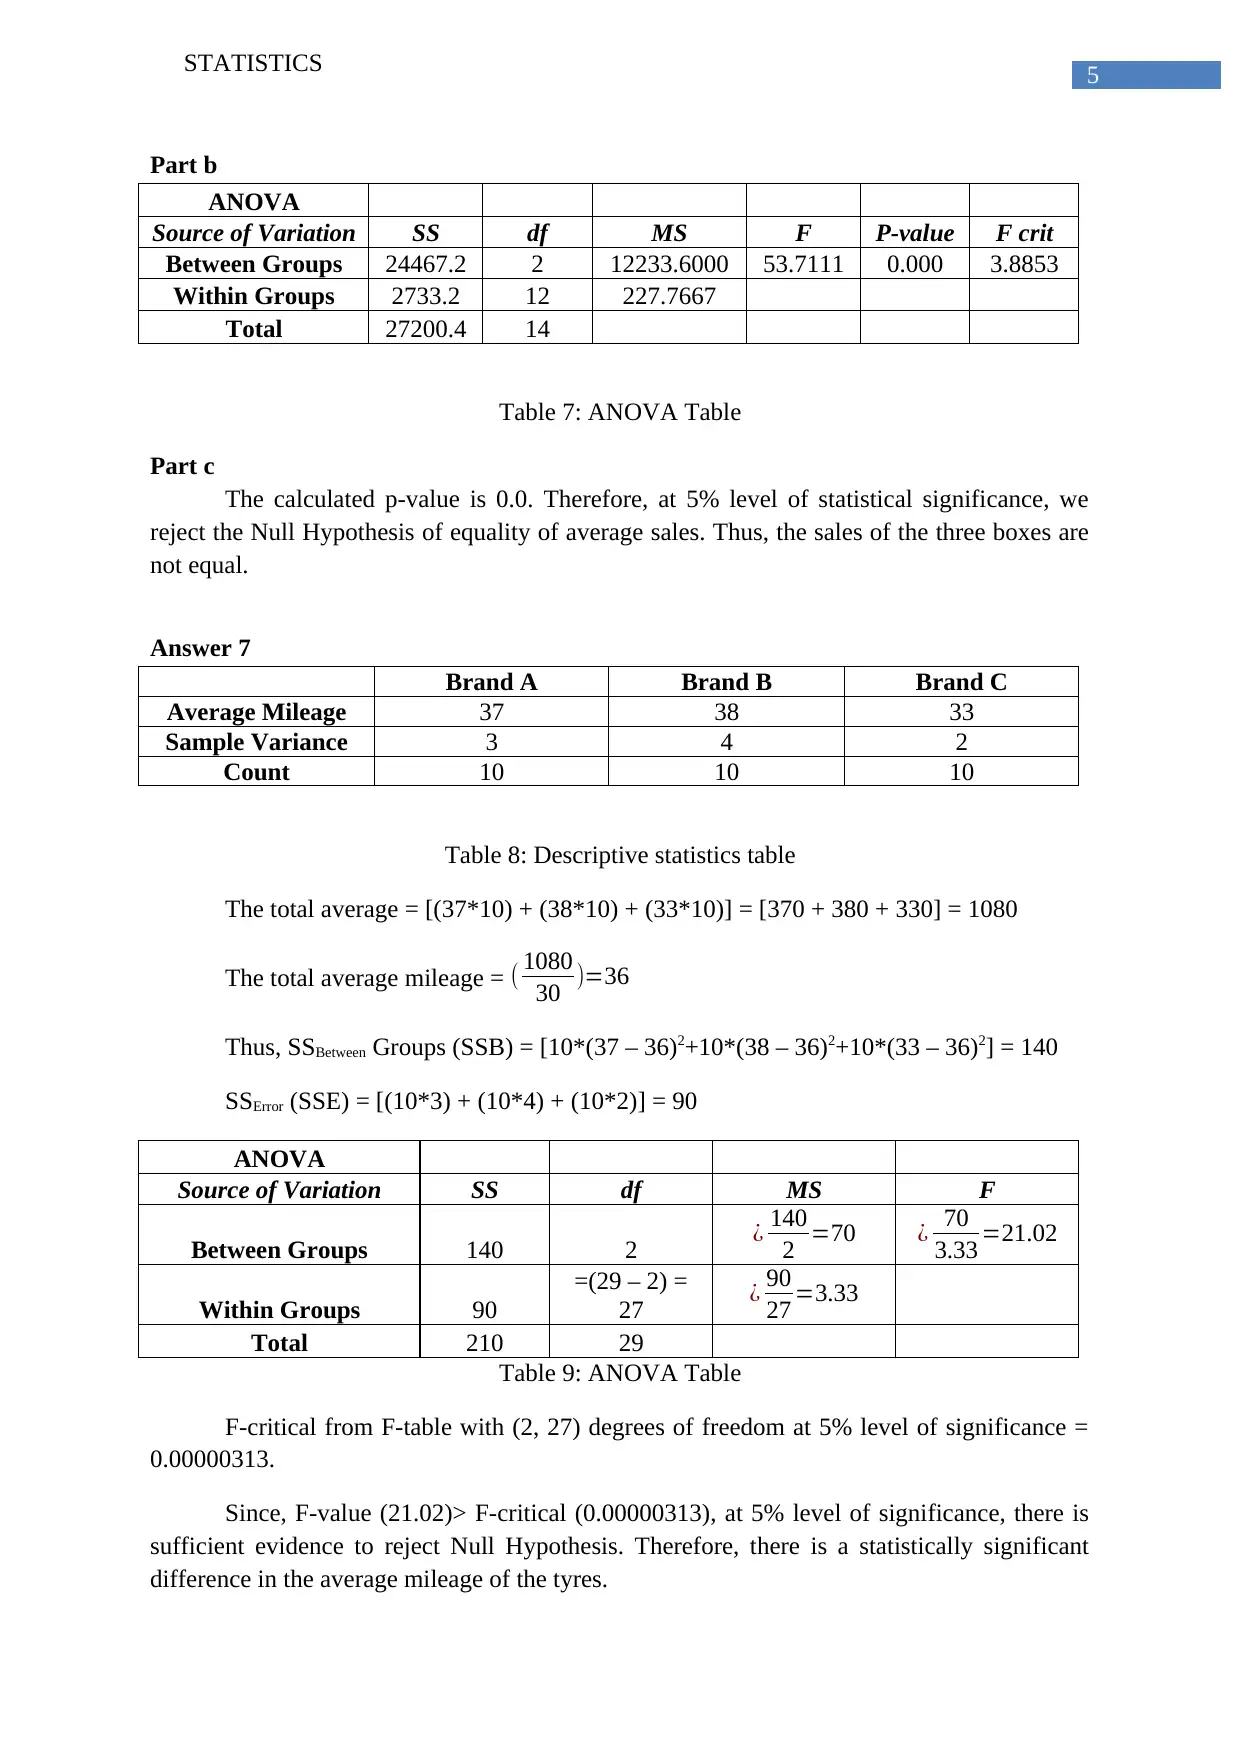
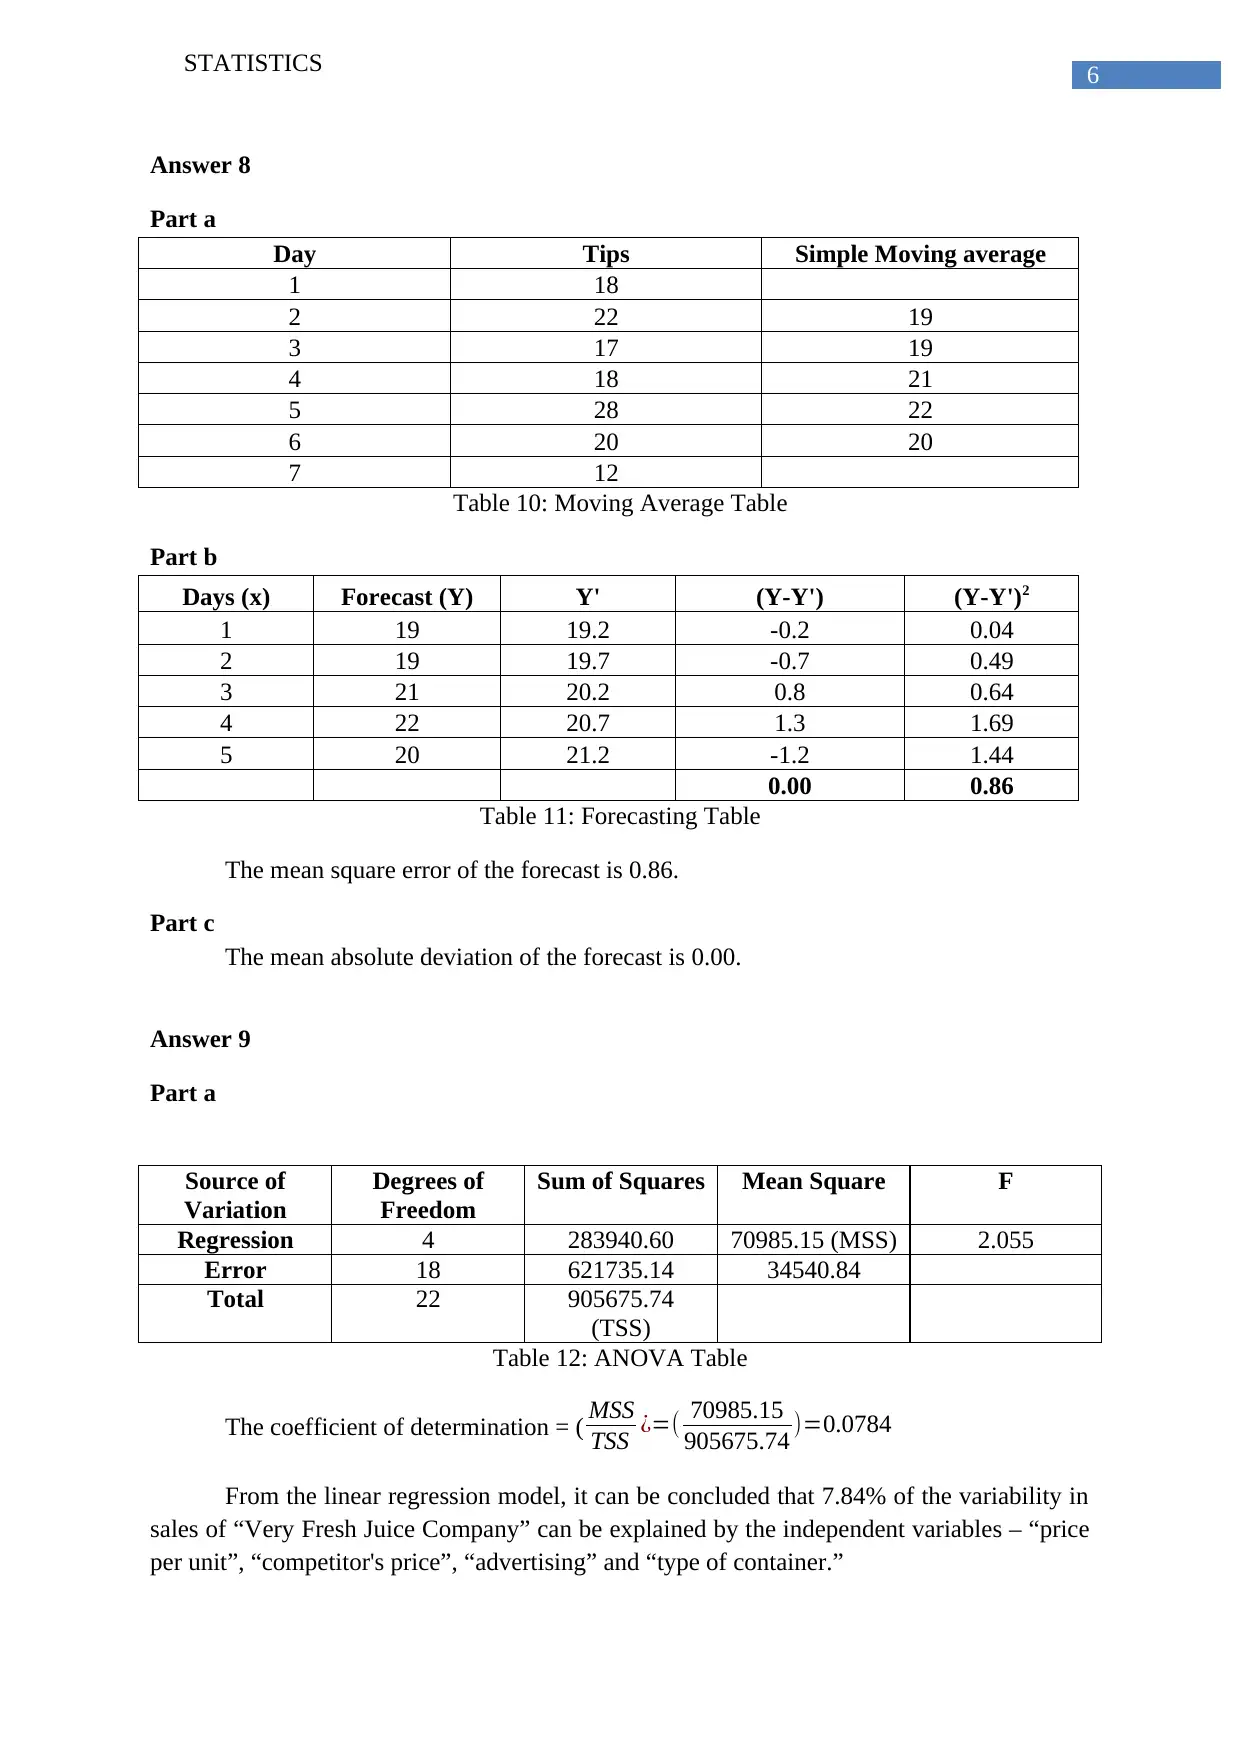
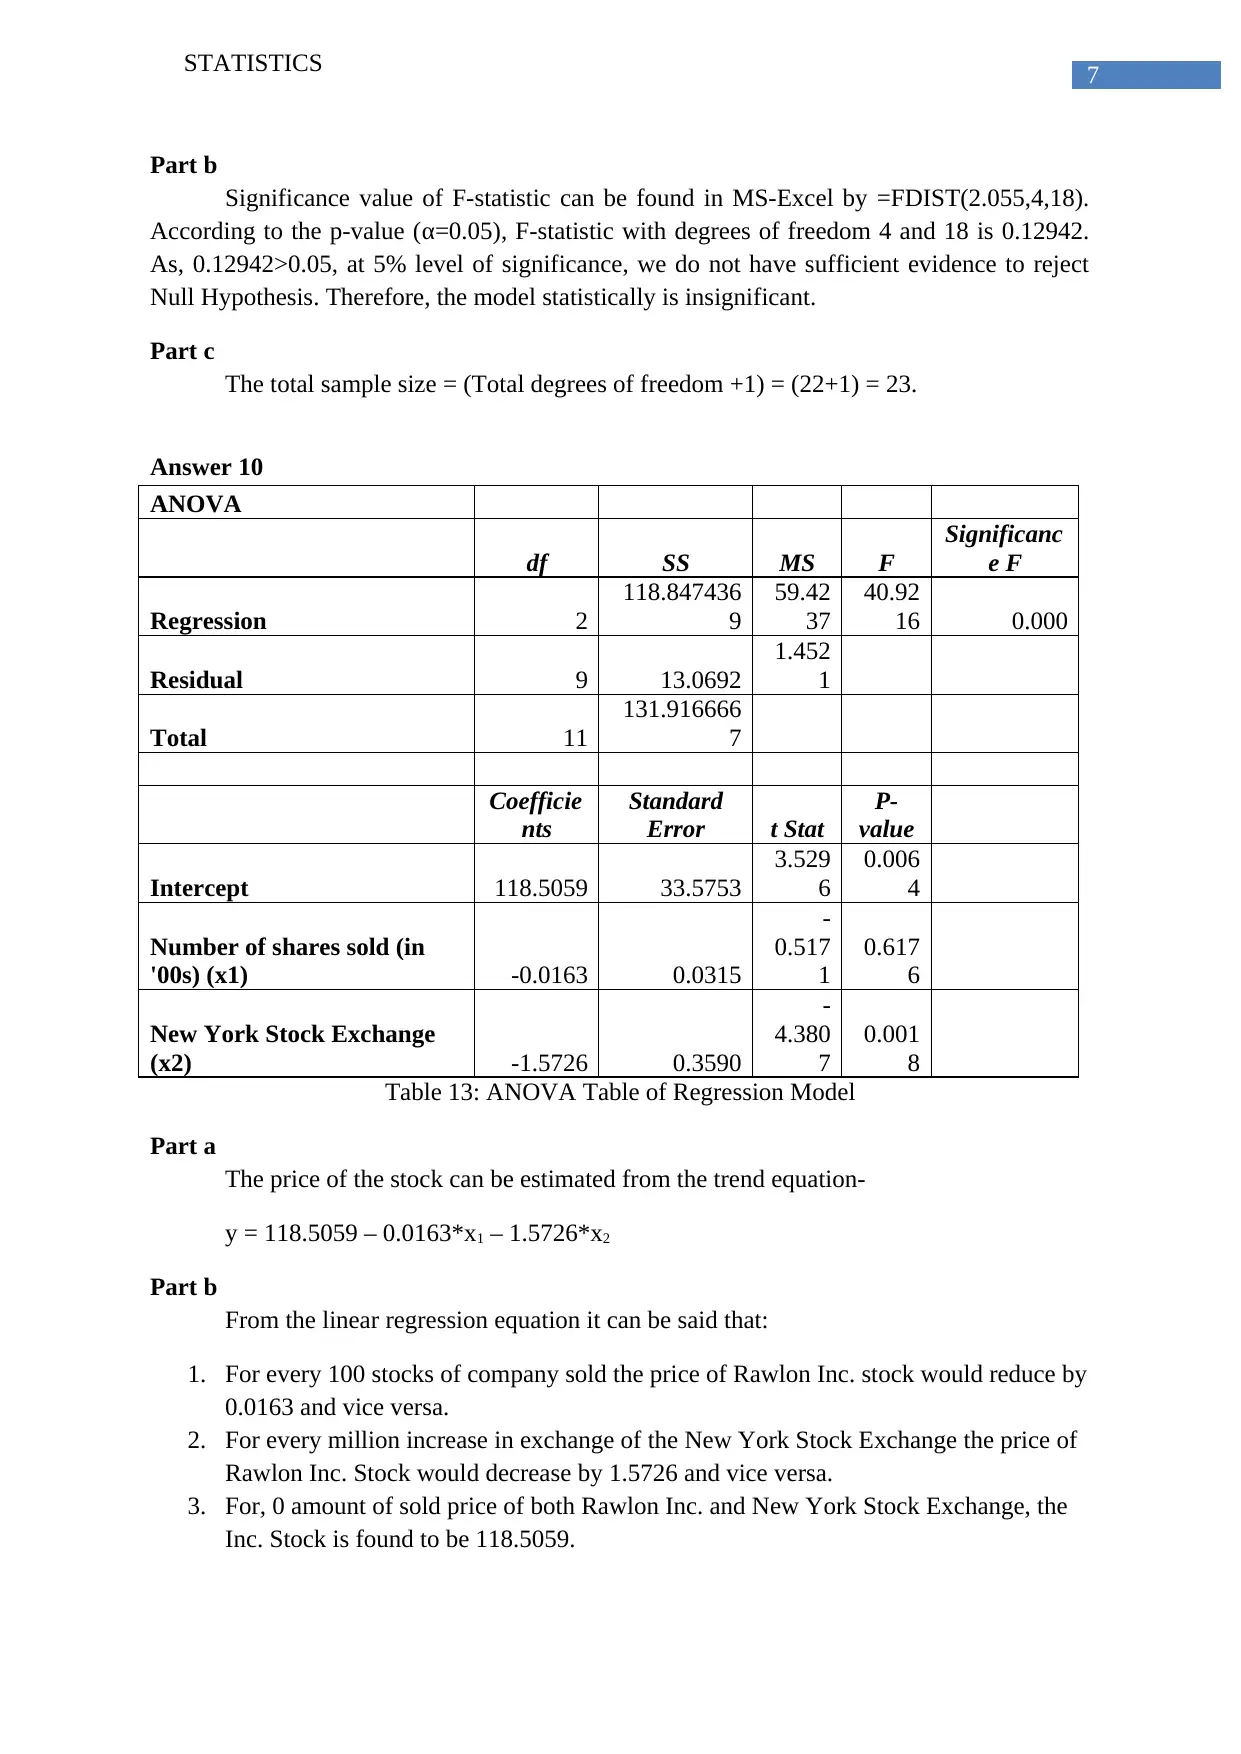
This statistics homework assignment provides solutions to various problems involving statistical analysis. The assignment covers a wide range of topics, including ANOVA (Analysis of Variance) tables, F-tests, and hypothesis testing to determine statistical significance. Solutions include calculations for F-statistics, p-values, and degrees of freedom. The assignment also delves into linear regression models, calculating coefficients, and interpreting results to predict trends and relationships between variables, such as sales figures and stock prices. Furthermore, the assignment explores time series analysis, including moving averages and forecasting methods. The solutions are comprehensive, providing detailed steps and explanations for each problem, allowing students to understand and apply statistical concepts effectively. The assignment provides a thorough examination of the principles and practical applications of statistics.

Running head: STATISTICS
Statistics
Name of the student:
Name of the university:
Author’s note:
Statistics
Name of the student:
Name of the university:
Author’s note:
Paraphrase This Document
Need a fresh take? Get an instant paraphrase of this document with our AI Paraphraser

1STATISTICS
Table of Contents
Answer 1..........................................................................................................................................2
Part a............................................................................................................................................2
Part b............................................................................................................................................2
Part c............................................................................................................................................2
Answer 2..........................................................................................................................................2
Answer 3..........................................................................................................................................3
Part a............................................................................................................................................3
Part b............................................................................................................................................3
Answer 4..........................................................................................................................................4
Answer 5..........................................................................................................................................4
Answer 6..........................................................................................................................................4
Part a............................................................................................................................................4
Part b............................................................................................................................................4
Part c............................................................................................................................................5
Answer 7..........................................................................................................................................5
Answer 8..........................................................................................................................................5
Part a............................................................................................................................................5
Part b............................................................................................................................................6
Part c............................................................................................................................................6
Answer 9..........................................................................................................................................6
Part a............................................................................................................................................6
Part b............................................................................................................................................6
Part c............................................................................................................................................7
Answer 10........................................................................................................................................7
Part a............................................................................................................................................7
Part b............................................................................................................................................7
Part c............................................................................................................................................7
Part d............................................................................................................................................7

2STATISTICS
Answer 1
Part a
Source of
Variation
Sum of squares Degrees of
Freedom
Mean Square F
Between
treatments
90 3 ¿ 90
3 =30 ¿ 30
6 =5
Within
treatments
(Error)
120 20 ¿ 120
20 =6
Total = (90 + 120)
= 210
= (3+20)
=23
Table 1: ANOVA table
The calculated F-statistic is 5. The p-value for the F-statistic at 3 and 20 degrees of
freedom is 0.00951034. At 1% level of significance (α=0.01), as calculated p-value is less
than 0.01. Hence, we reject the null hypothesis.
Part b
Number of Groups = (degrees of freedom of between treatments) + 1 = (3+1) = 4
Hence, there are 4 groups in the problem.
Part c
Number of observations = (degrees of freedom of within treatment) + 1= (20+1) = 21
There are 21 observations in the problem.
Answer 2
Simple linear regression model:
Coefficient
s
Standard
Error t Stat P-value
Lower
95%
Upper
95%
Intercept 136 13.76 9.881 0.000 104.2621 167.7379
Year (t) 39.18 2.22 17.664 0.000 34.0668 44.29684
Table 2: Linear Regression Model
The simple linear regression, Y = β0 + β1*X.
Here, the calculated intercept (β0) = 136, the calculated slope (β1) = 39.18.
According to the table 2, the estimated number of units sold by the auto manufacturer
is:
Number of Units sold (‘000s) = 136 + 39.18*Year
⊘ This is a preview!⊘
Do you want full access?
Subscribe today to unlock all pages.

Trusted by 1+ million students worldwide

3STATISTICS
Thus, in the 11th (t=11) year, the number of units sold = (136+39.18*11) = 567
(‘000s).
0 2 4 6 8 10 12
0
100
200
300
400
500
600
f(x) = 39.1818181818182 x + 136
R² = 0.975002230693999
Number of Cars Sold (in 1000s units)
Year (t)
Number of Cars Sold (000s)
Figure 1: Trend of the number of units sold by major auto manufacturer
The prediction of trend shows that the number of units that can be sold by the auto
manufacturer = 567000.
Answer 3
Part a
ANOVA
df SS MS F Significance F
Regression 1 59.89145 59.89145 29.62415 0.002842
Residual 5 10.10855 2.021711
Total 6 70
Table 3: Linear Regression Model of F-statistic
The calculated p-value of the F-statistic is 0.002842. Therefore, at 1% level of
significance there is statistically significant association between price and the number of flash
drives sold.
Part b
Coefficient
s
Standard
Error t Stat P-value
Lower
95%
Upper
95%
Intercept 40.033 1.070 37.4309 0.0000 37.28362 42.78217
Units sold (y) -1.174 0.216 -5.4428 0.0028 -1.72897 -0.61971
Table 4: Linear Regression Model of t-statistic
Paraphrase This Document
Need a fresh take? Get an instant paraphrase of this document with our AI Paraphraser

4STATISTICS
The calculated p-value is 0.002842. Hence, at 1% level of significance, there is
statistically significant association between price and the number of flash drives sold.
Answer 4
In a completely randomized experimental design, 14 experimental units were used for
each of the five levels of factor (5 treatments). We incorporated ANOVA table.
Source of
Variation
Sum of Squares Degrees of
Freedom
Mean Square F
Between
treatments
= 4*800 = 3200 = (5 – 1) = 4 800.00 ¿ 800
569.23 =1.41
Within
treatments
(Error)
= (10600 –
3200) = 7400
= (14 – 1) = 13 ¿ 7400
13 =569.23
Total 10600 17
Table 5: ANOVA Table
Answer 5
ANOVA
Source of
Variation SS df MS F P-value F crit
Between Groups 324 2 162 40.500 0.000 4.256
Within Groups 36 9 4
Total 360 11
Table 6: ANOVA Table
Null Hypothesis (H0): The average sales of the three stores are equal.
Alternate Hypothesis (HA): There exists at least one inequality of average sales of the
stores.
At 5% level of statistical significance, we reject the Null Hypothesis for p-value
(0.000<0.05). Therefore, the average sales of the three stores are not similar. There are
significant differences in the average sales of the three stores.
Answer 6
Part a
The hypotheses are-
Null Hypothesis (H0): The average sales of the three boxes are equal.
Alternate Hypothesis (HA): There exists at least one equality in average sales of the
boxes.

5STATISTICS
Part b
ANOVA
Source of Variation SS df MS F P-value F crit
Between Groups 24467.2 2 12233.6000 53.7111 0.000 3.8853
Within Groups 2733.2 12 227.7667
Total 27200.4 14
Table 7: ANOVA Table
Part c
The calculated p-value is 0.0. Therefore, at 5% level of statistical significance, we
reject the Null Hypothesis of equality of average sales. Thus, the sales of the three boxes are
not equal.
Answer 7
Brand A Brand B Brand C
Average Mileage 37 38 33
Sample Variance 3 4 2
Count 10 10 10
Table 8: Descriptive statistics table
The total average = [(37*10) + (38*10) + (33*10)] = [370 + 380 + 330] = 1080
The total average mileage = ( 1080
30 )=36
Thus, SSBetween Groups (SSB) = [10*(37 – 36)2+10*(38 – 36)2+10*(33 – 36)2] = 140
SSError (SSE) = [(10*3) + (10*4) + (10*2)] = 90
ANOVA
Source of Variation SS df MS F
Between Groups 140 2 ¿ 140
2 =70 ¿ 70
3.33 =21.02
Within Groups 90
=(29 – 2) =
27 ¿ 90
27 =3.33
Total 210 29
Table 9: ANOVA Table
F-critical from F-table with (2, 27) degrees of freedom at 5% level of significance =
0.00000313.
Since, F-value (21.02)> F-critical (0.00000313), at 5% level of significance, there is
sufficient evidence to reject Null Hypothesis. Therefore, there is a statistically significant
difference in the average mileage of the tyres.
⊘ This is a preview!⊘
Do you want full access?
Subscribe today to unlock all pages.

Trusted by 1+ million students worldwide

6STATISTICS
Answer 8
Part a
Day Tips Simple Moving average
1 18
2 22 19
3 17 19
4 18 21
5 28 22
6 20 20
7 12
Table 10: Moving Average Table
Part b
Days (x) Forecast (Y) Y' (Y-Y') (Y-Y')2
1 19 19.2 -0.2 0.04
2 19 19.7 -0.7 0.49
3 21 20.2 0.8 0.64
4 22 20.7 1.3 1.69
5 20 21.2 -1.2 1.44
0.00 0.86
Table 11: Forecasting Table
The mean square error of the forecast is 0.86.
Part c
The mean absolute deviation of the forecast is 0.00.
Answer 9
Part a
Source of
Variation
Degrees of
Freedom
Sum of Squares Mean Square F
Regression 4 283940.60 70985.15 (MSS) 2.055
Error 18 621735.14 34540.84
Total 22 905675.74
(TSS)
Table 12: ANOVA Table
The coefficient of determination = ( MSS
TSS ¿=( 70985.15
905675.74 )=0.0784
From the linear regression model, it can be concluded that 7.84% of the variability in
sales of “Very Fresh Juice Company” can be explained by the independent variables – “price
per unit”, “competitor's price”, “advertising” and “type of container.”
Paraphrase This Document
Need a fresh take? Get an instant paraphrase of this document with our AI Paraphraser

7STATISTICS
Part b
Significance value of F-statistic can be found in MS-Excel by =FDIST(2.055,4,18).
According to the p-value (α=0.05), F-statistic with degrees of freedom 4 and 18 is 0.12942.
As, 0.12942>0.05, at 5% level of significance, we do not have sufficient evidence to reject
Null Hypothesis. Therefore, the model statistically is insignificant.
Part c
The total sample size = (Total degrees of freedom +1) = (22+1) = 23.
Answer 10
ANOVA
df SS MS F
Significanc
e F
Regression 2
118.847436
9
59.42
37
40.92
16 0.000
Residual 9 13.0692
1.452
1
Total 11
131.916666
7
Coefficie
nts
Standard
Error t Stat
P-
value
Intercept 118.5059 33.5753
3.529
6
0.006
4
Number of shares sold (in
'00s) (x1) -0.0163 0.0315
-
0.517
1
0.617
6
New York Stock Exchange
(x2) -1.5726 0.3590
-
4.380
7
0.001
8
Table 13: ANOVA Table of Regression Model
Part a
The price of the stock can be estimated from the trend equation-
y = 118.5059 – 0.0163*x1 – 1.5726*x2
Part b
From the linear regression equation it can be said that:
1. For every 100 stocks of company sold the price of Rawlon Inc. stock would reduce by
0.0163 and vice versa.
2. For every million increase in exchange of the New York Stock Exchange the price of
Rawlon Inc. Stock would decrease by 1.5726 and vice versa.
3. For, 0 amount of sold price of both Rawlon Inc. and New York Stock Exchange, the
Inc. Stock is found to be 118.5059.
Part b
Significance value of F-statistic can be found in MS-Excel by =FDIST(2.055,4,18).
According to the p-value (α=0.05), F-statistic with degrees of freedom 4 and 18 is 0.12942.
As, 0.12942>0.05, at 5% level of significance, we do not have sufficient evidence to reject
Null Hypothesis. Therefore, the model statistically is insignificant.
Part c
The total sample size = (Total degrees of freedom +1) = (22+1) = 23.
Answer 10
ANOVA
df SS MS F
Significanc
e F
Regression 2
118.847436
9
59.42
37
40.92
16 0.000
Residual 9 13.0692
1.452
1
Total 11
131.916666
7
Coefficie
nts
Standard
Error t Stat
P-
value
Intercept 118.5059 33.5753
3.529
6
0.006
4
Number of shares sold (in
'00s) (x1) -0.0163 0.0315
-
0.517
1
0.617
6
New York Stock Exchange
(x2) -1.5726 0.3590
-
4.380
7
0.001
8
Table 13: ANOVA Table of Regression Model
Part a
The price of the stock can be estimated from the trend equation-
y = 118.5059 – 0.0163*x1 – 1.5726*x2
Part b
From the linear regression equation it can be said that:
1. For every 100 stocks of company sold the price of Rawlon Inc. stock would reduce by
0.0163 and vice versa.
2. For every million increase in exchange of the New York Stock Exchange the price of
Rawlon Inc. Stock would decrease by 1.5726 and vice versa.
3. For, 0 amount of sold price of both Rawlon Inc. and New York Stock Exchange, the
Inc. Stock is found to be 118.5059.

8STATISTICS
Part c
At 5% level of significance, the volume of exchange of New York stock exchange is
statistically significant (as p-value = 0.0018< 0.05).
The calculated p-value is 0.6176 (>0.05). Therefore, at 5% level of significance, the
number of shares sold by Rawlon Inc. is not statistically significant.
Part d
For 94500 stocks sold and 16 million the volume of exchange on the New York Stock
Exchange, the price of the stock (Inc. stock) would be:
y = [118.5059 – (0.0163*x1) – (1.5726*x2)]
= [118.5059 – (0.0163*945) – (1.5726*16)]
= 77.95
⊘ This is a preview!⊘
Do you want full access?
Subscribe today to unlock all pages.

Trusted by 1+ million students worldwide
1 out of 9
Related Documents

Your All-in-One AI-Powered Toolkit for Academic Success.
+13062052269
info@desklib.com
Available 24*7 on WhatsApp / Email
Unlock your academic potential
Copyright © 2020–2025 A2Z Services. All Rights Reserved. Developed and managed by ZUCOL.