HI6007 Statistics Assignment: Analyzing Startup Costs and Sales Data

Verified

Added on  2020/03/23

|12
|762
|51
Homework Assignment
AI Summary
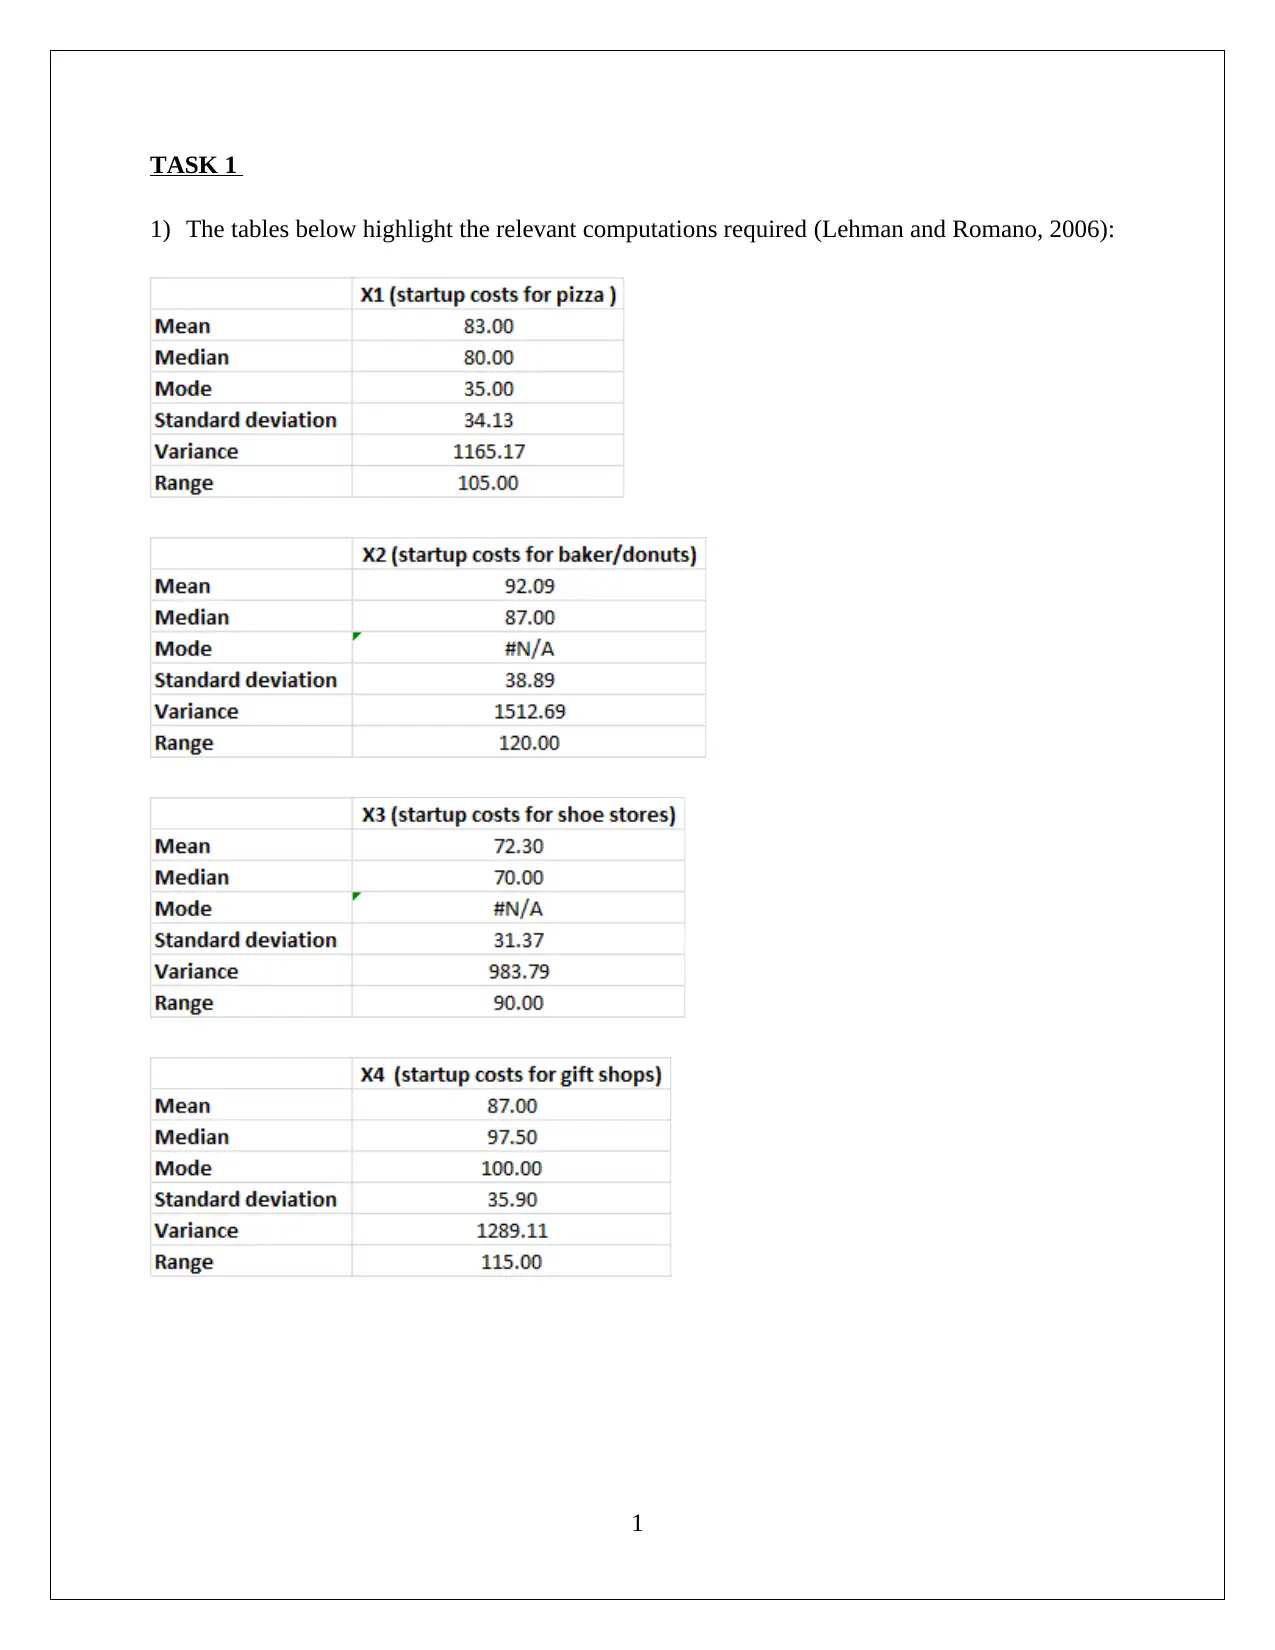
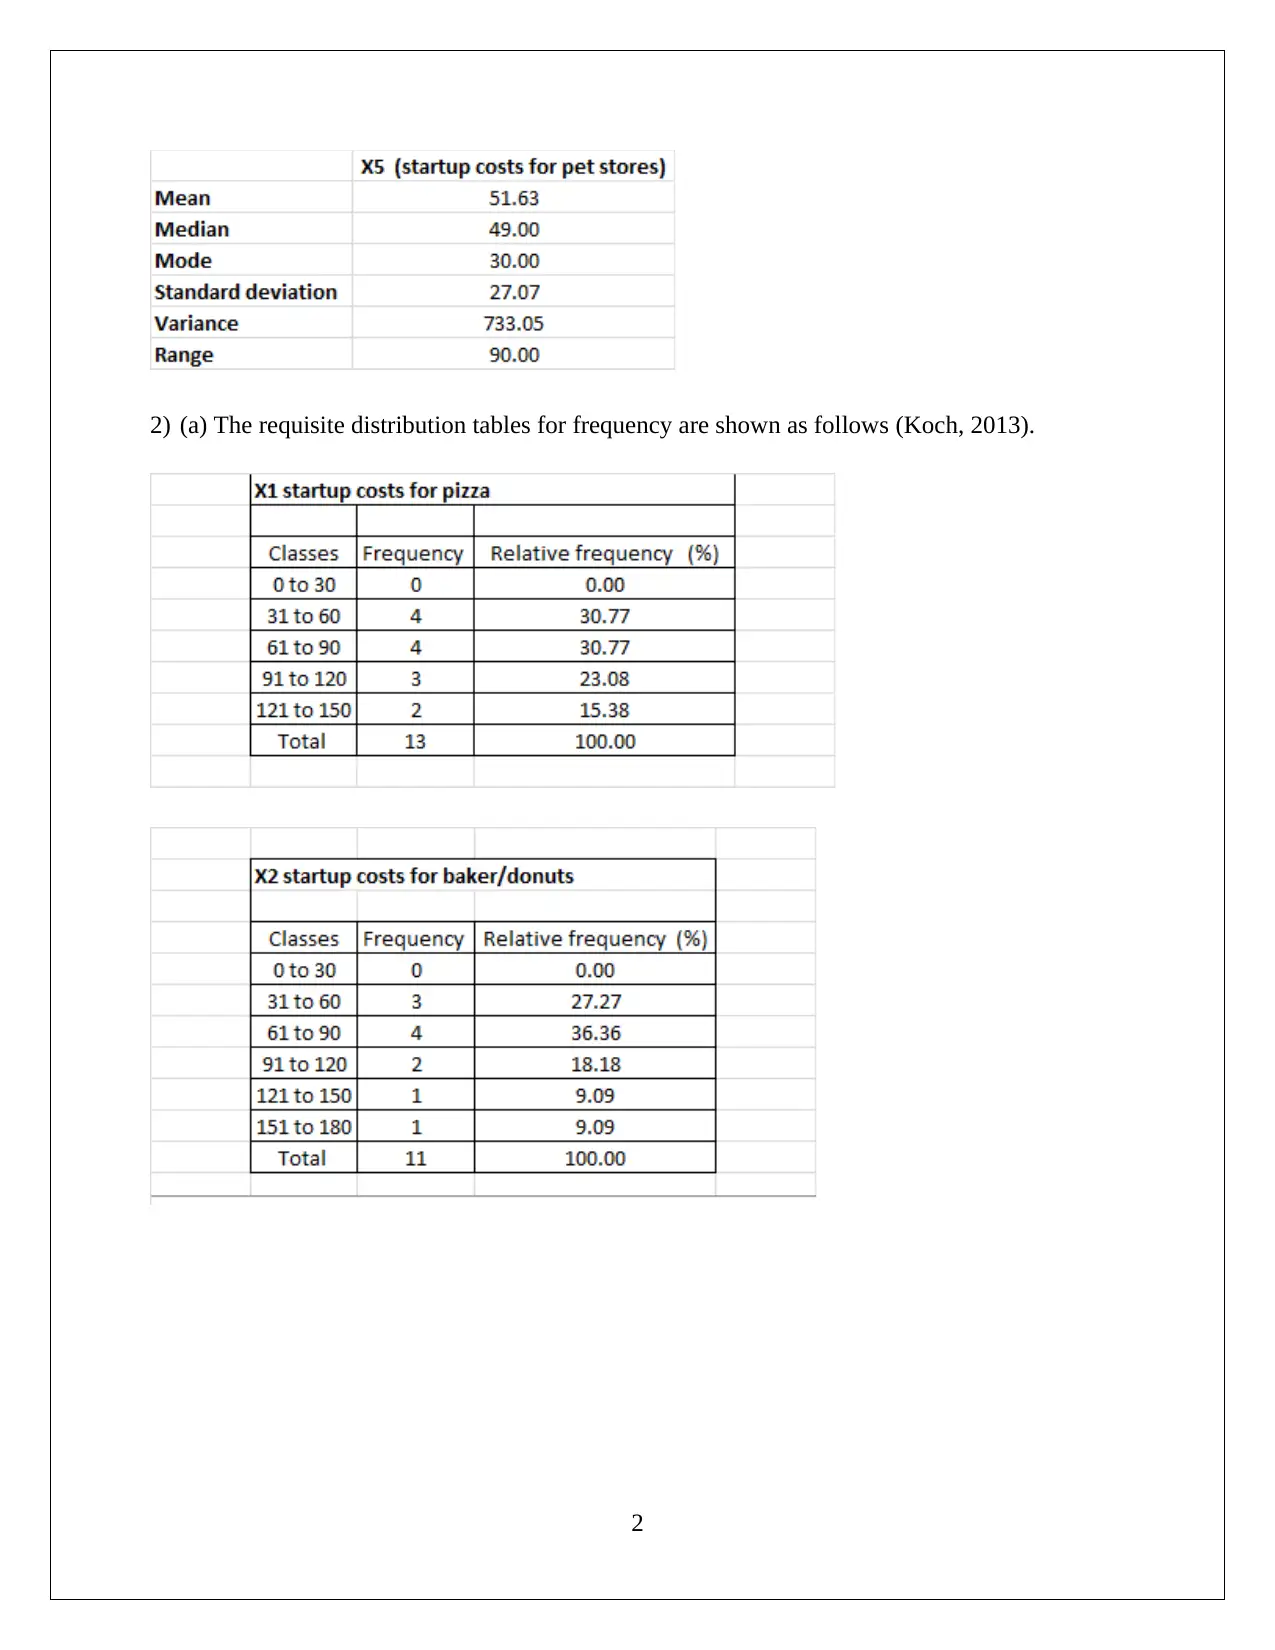
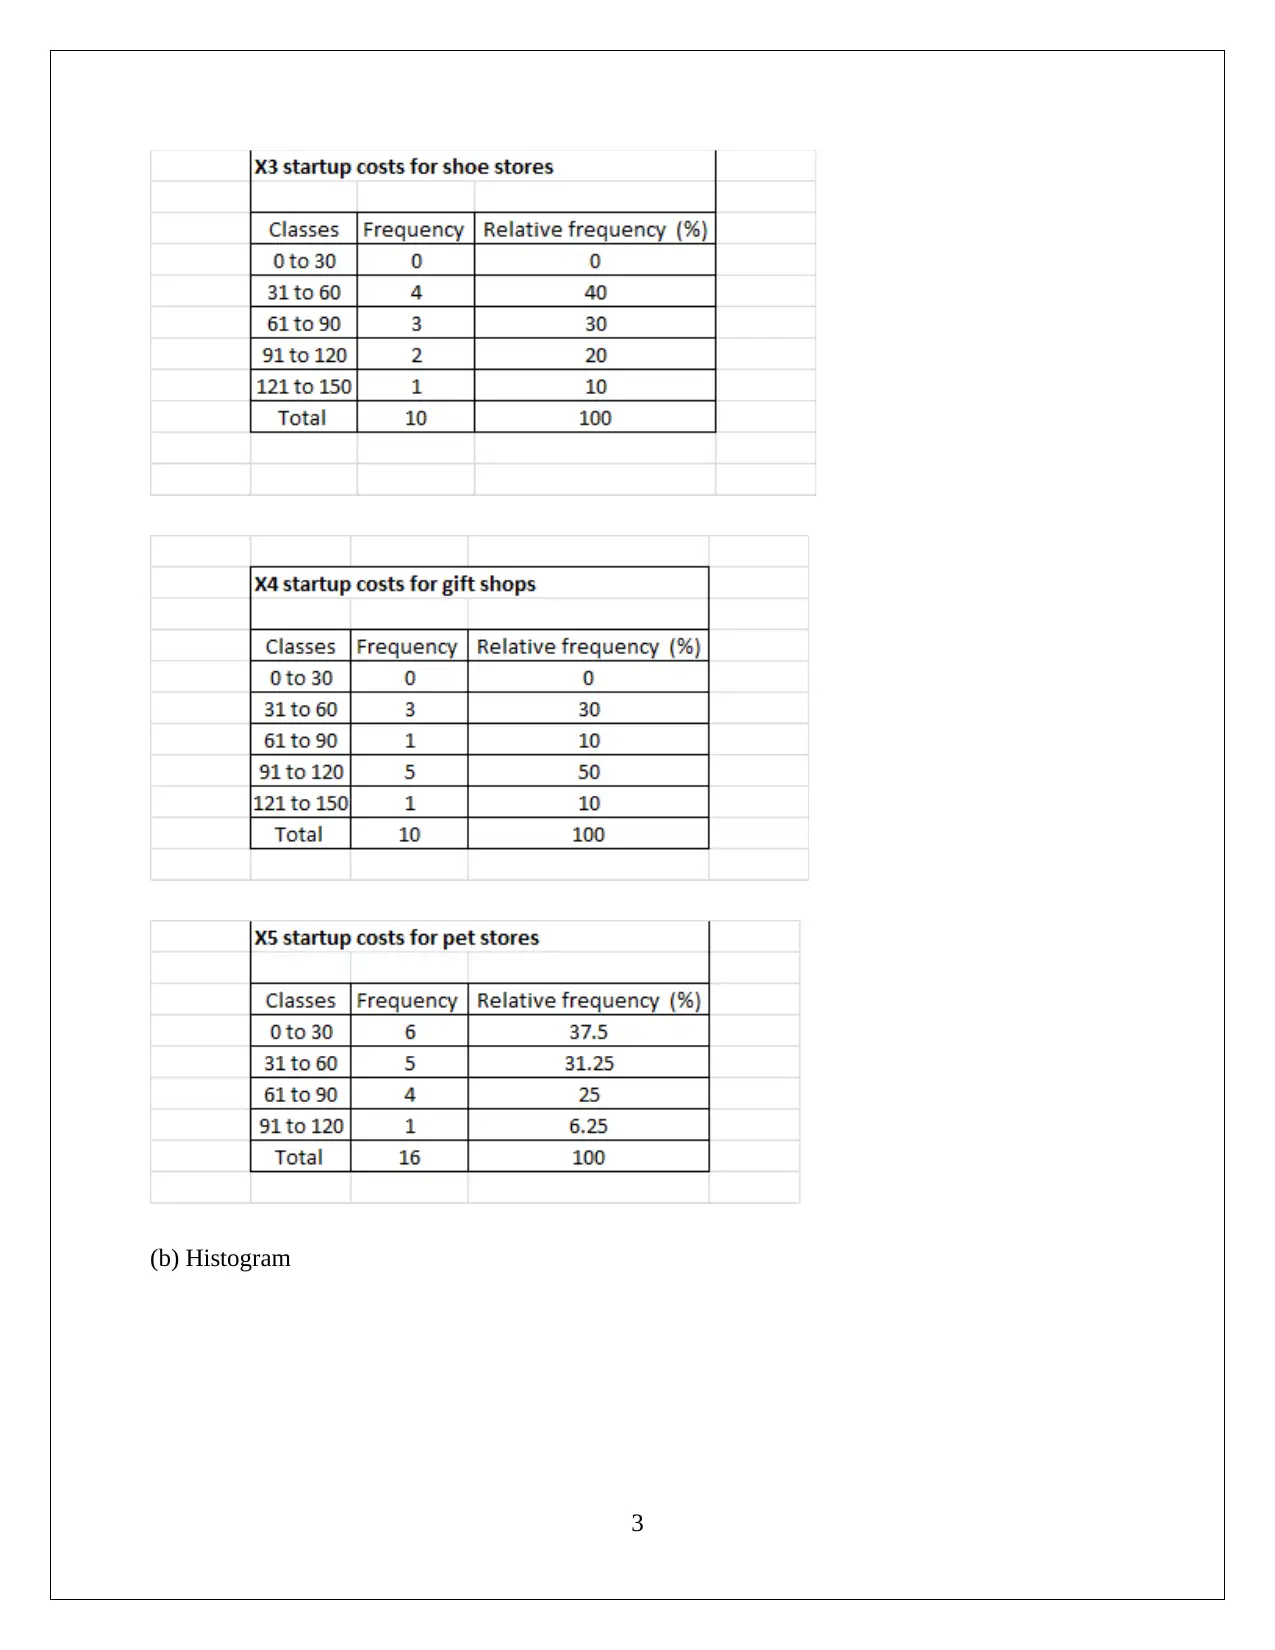
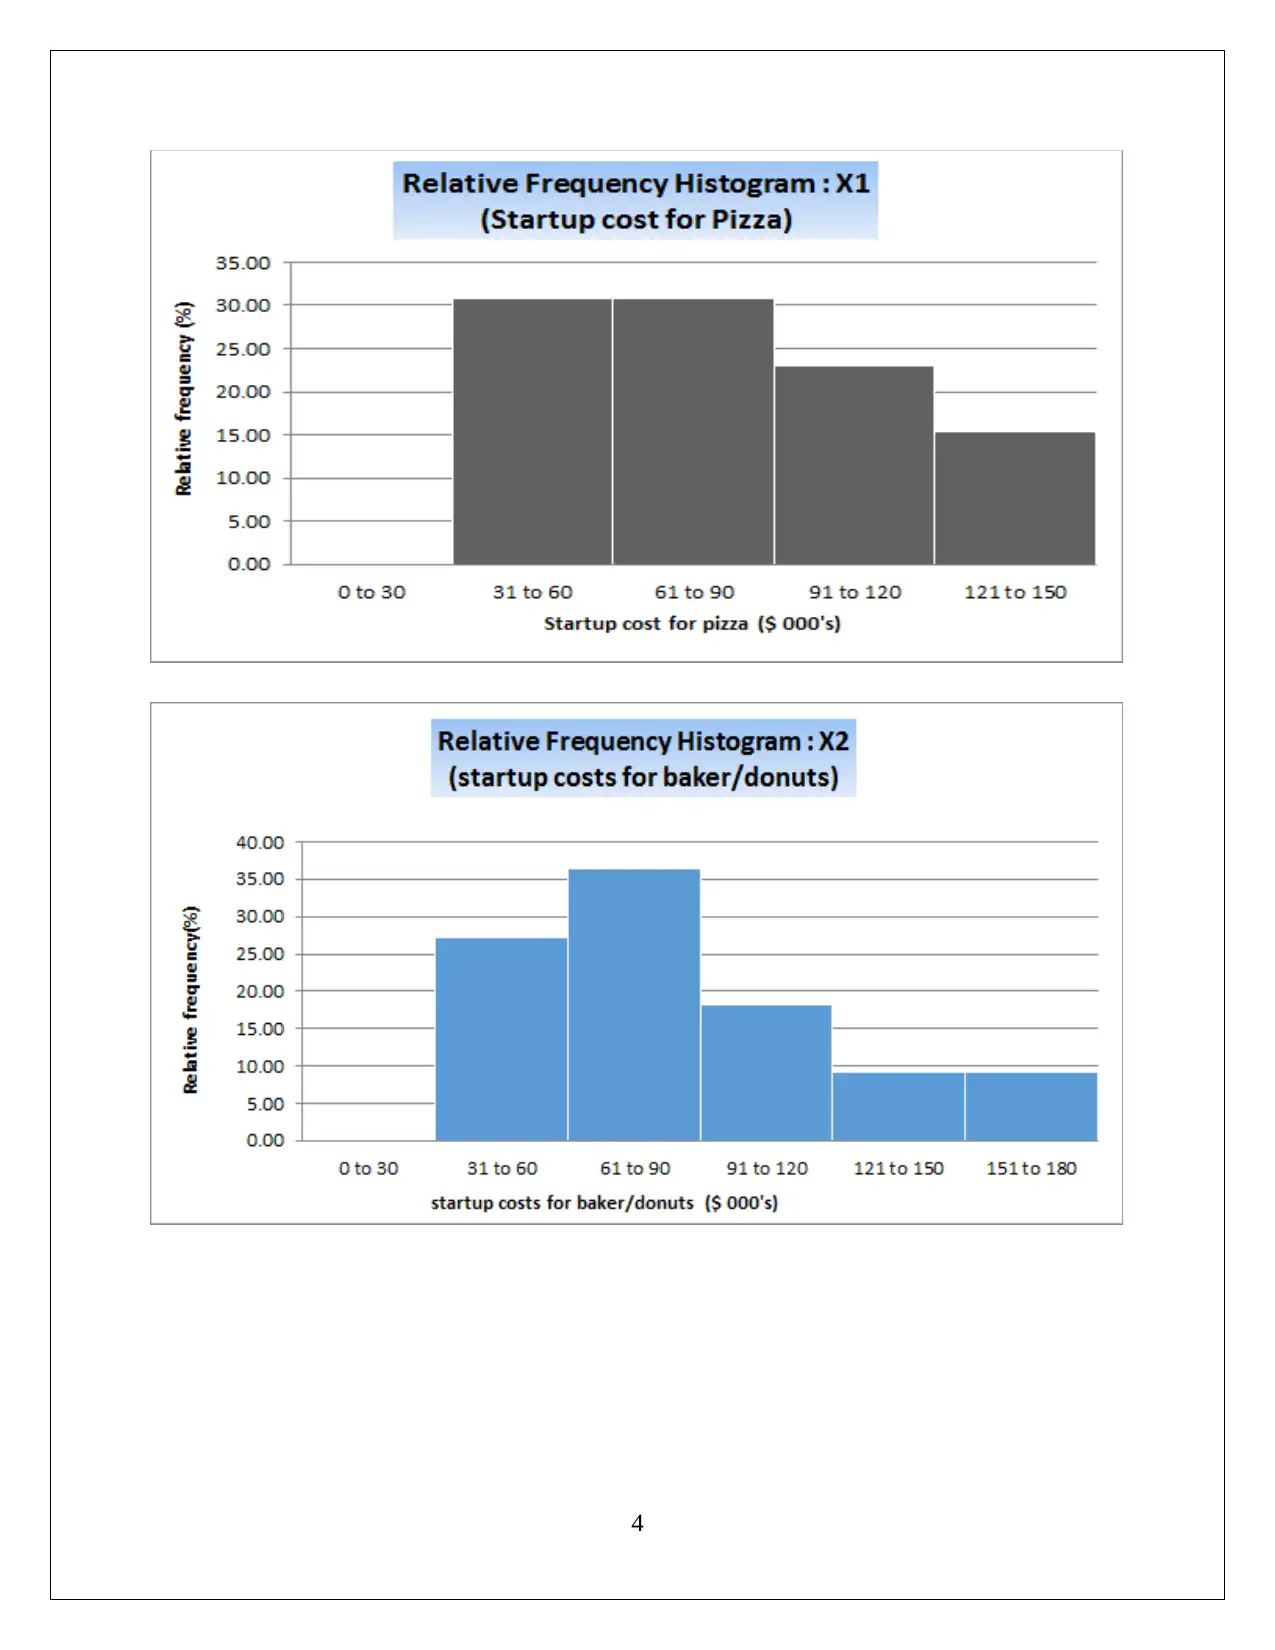
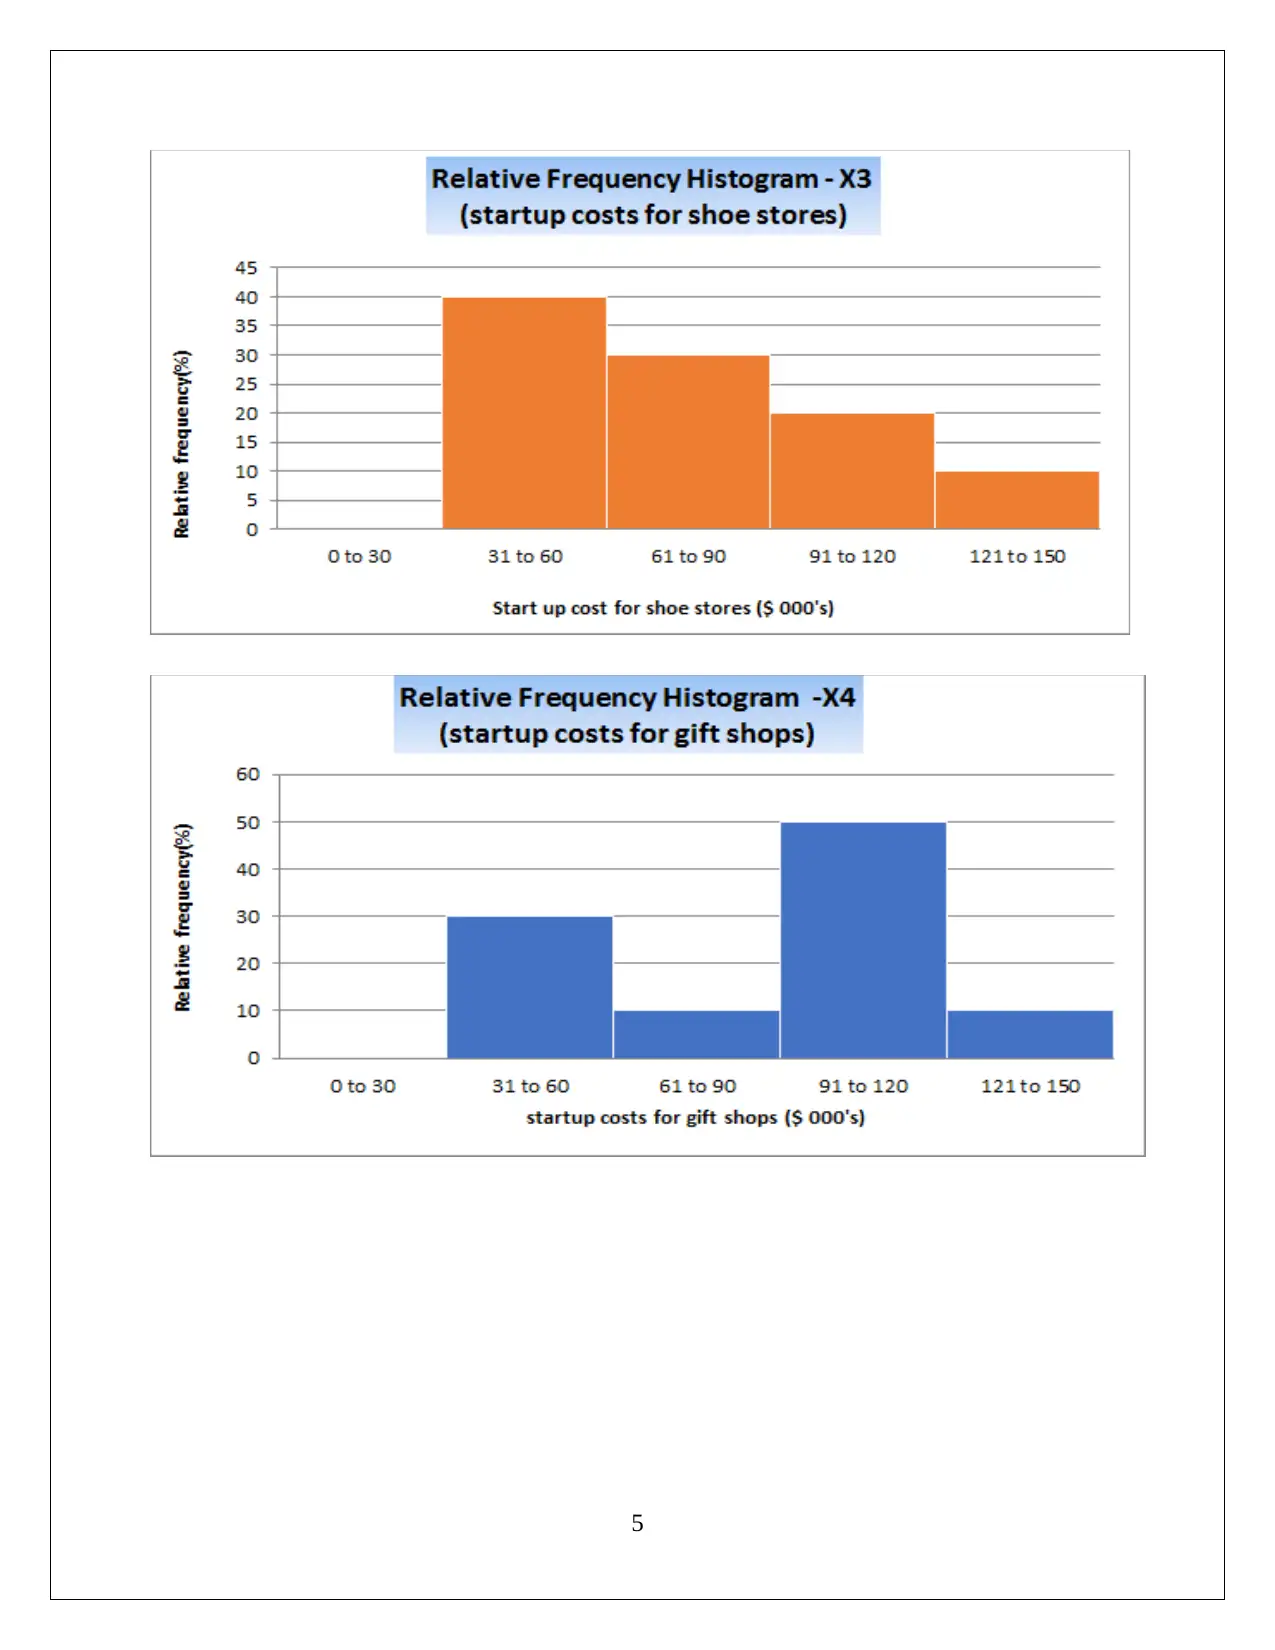
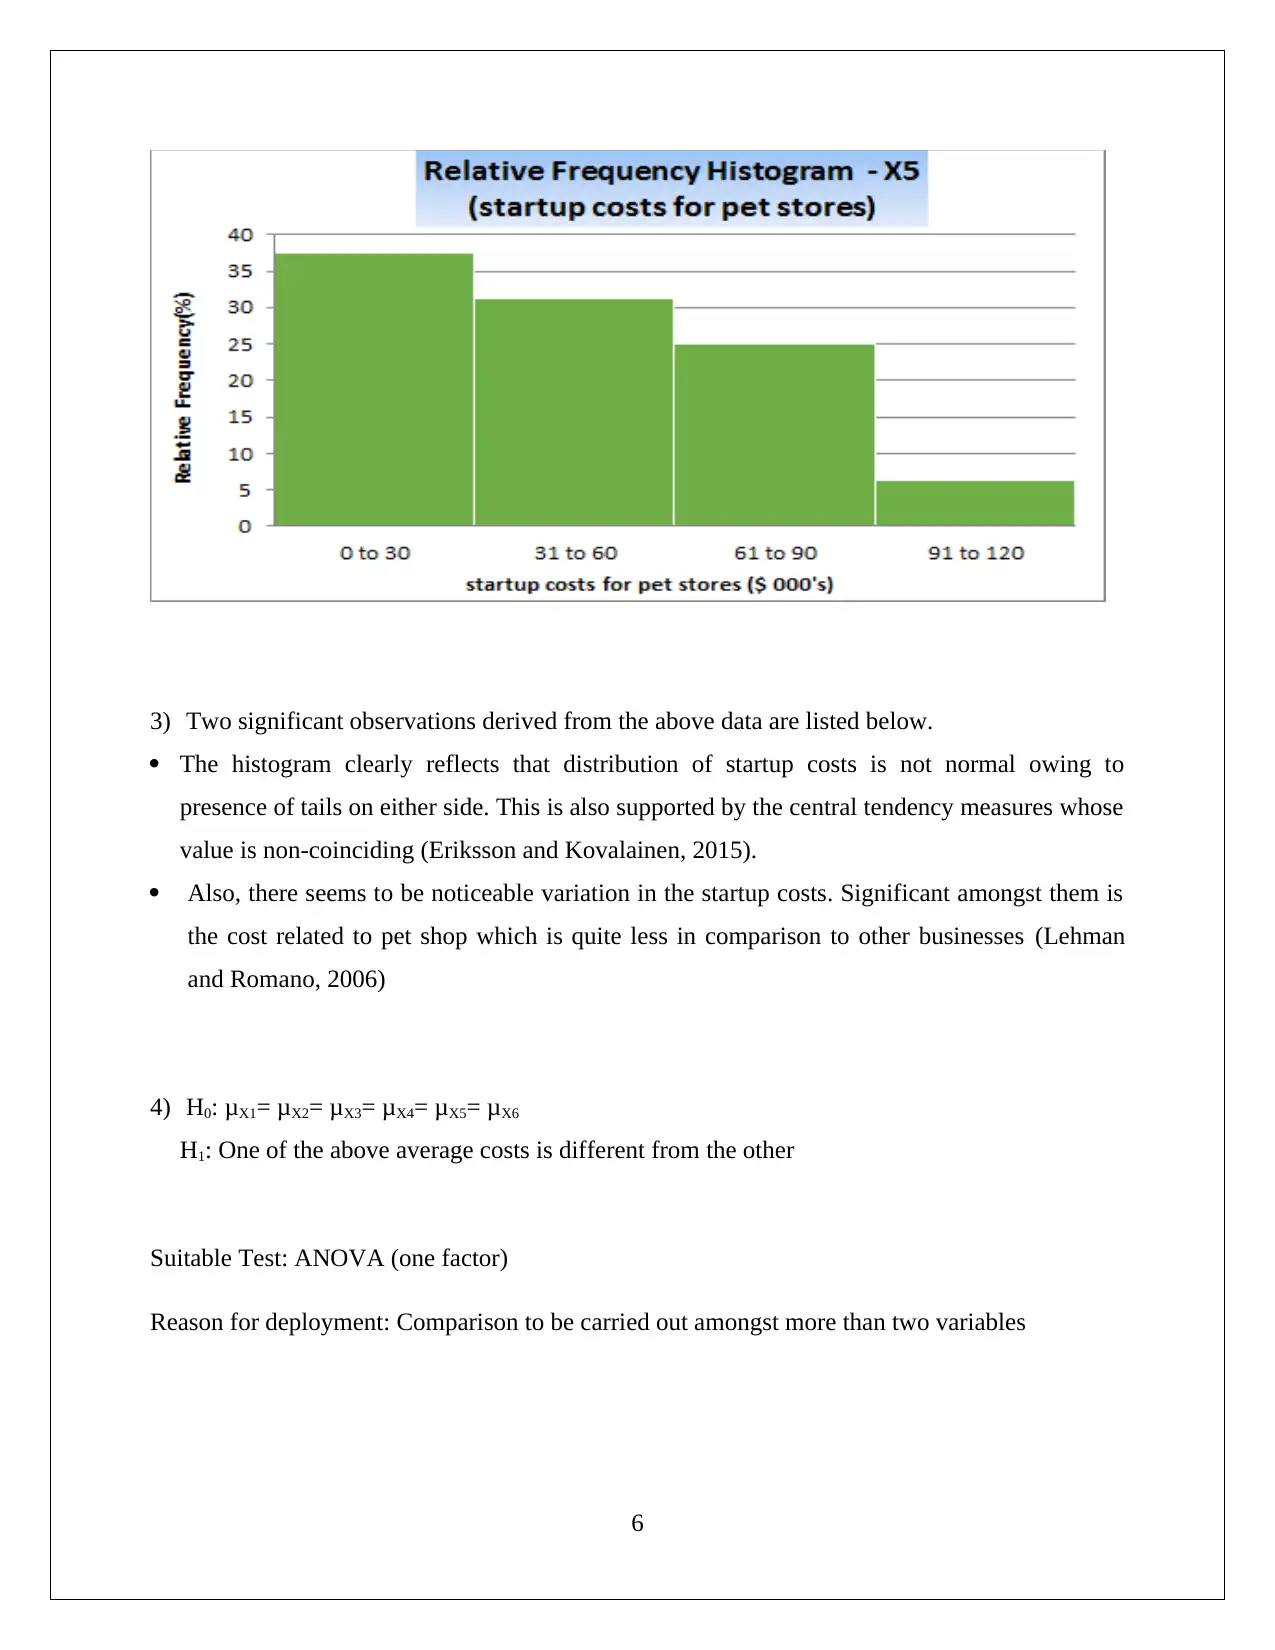
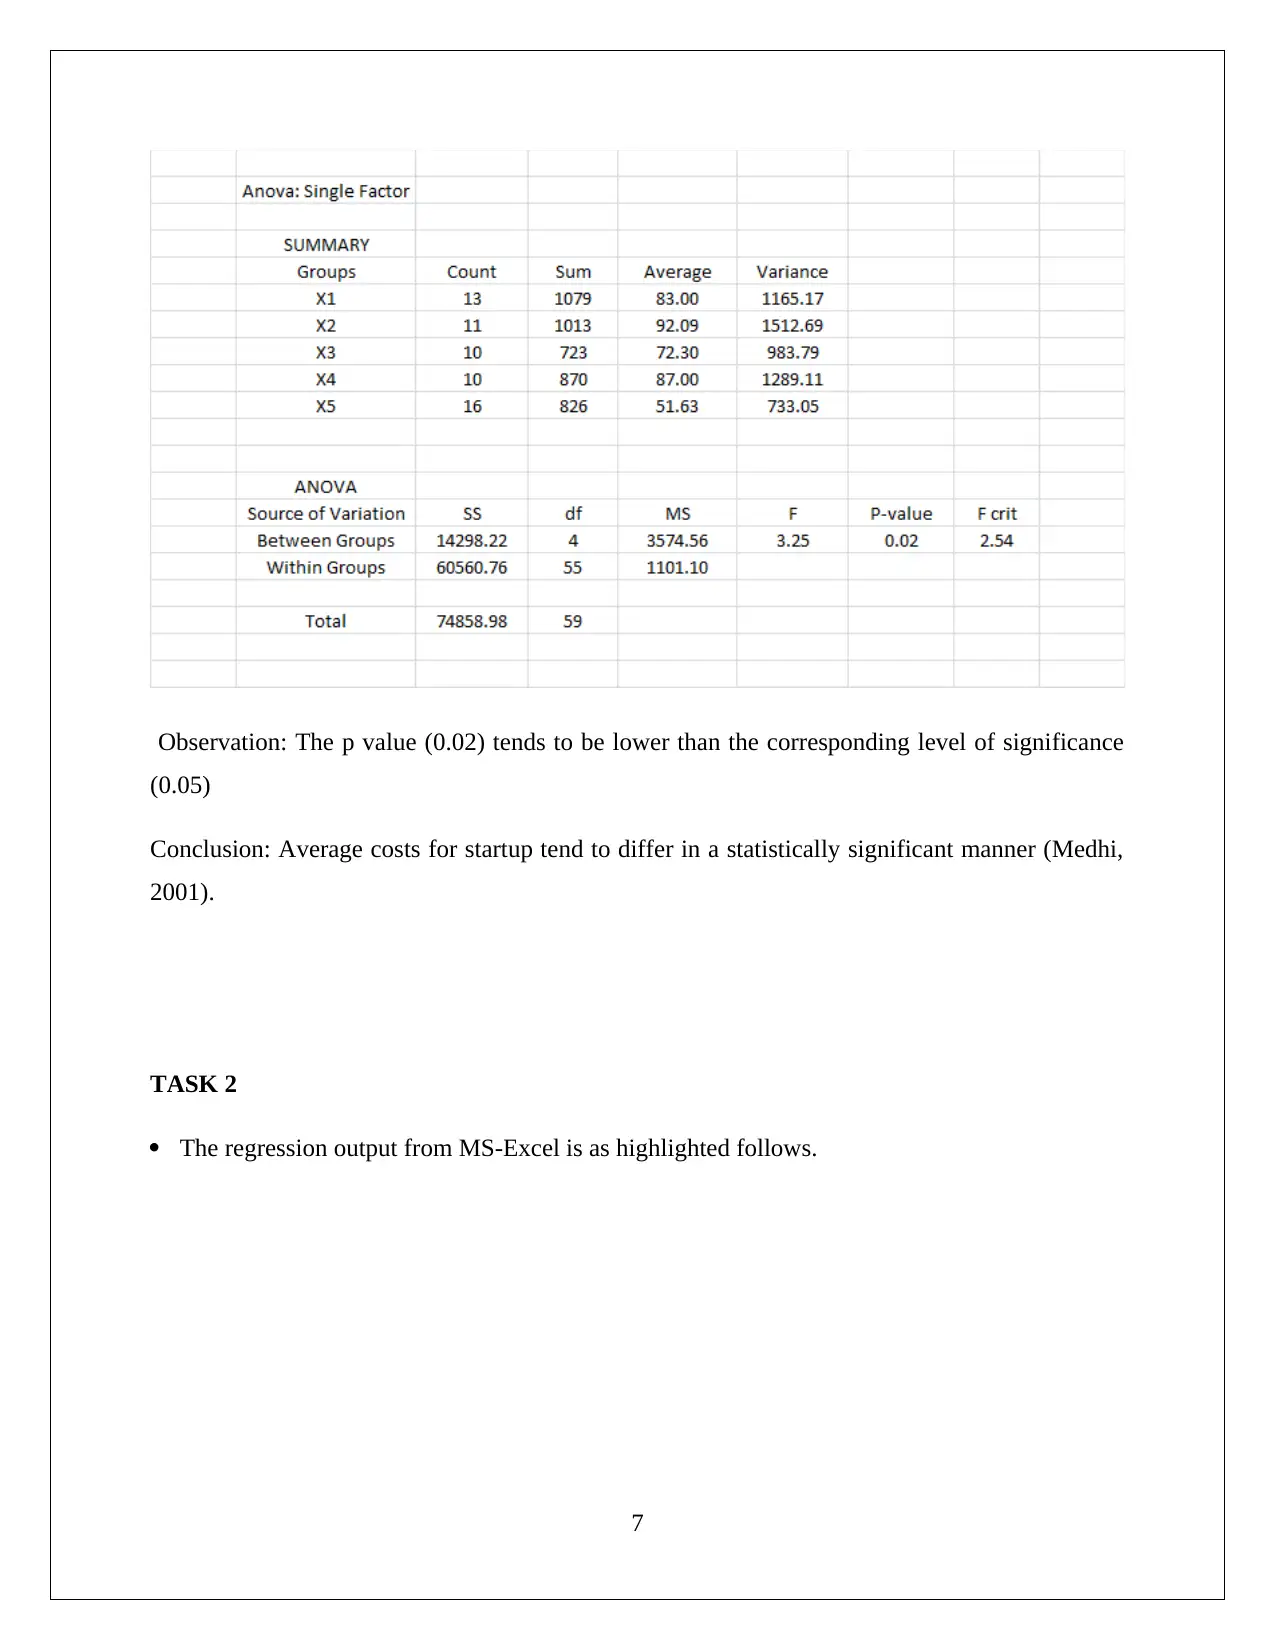
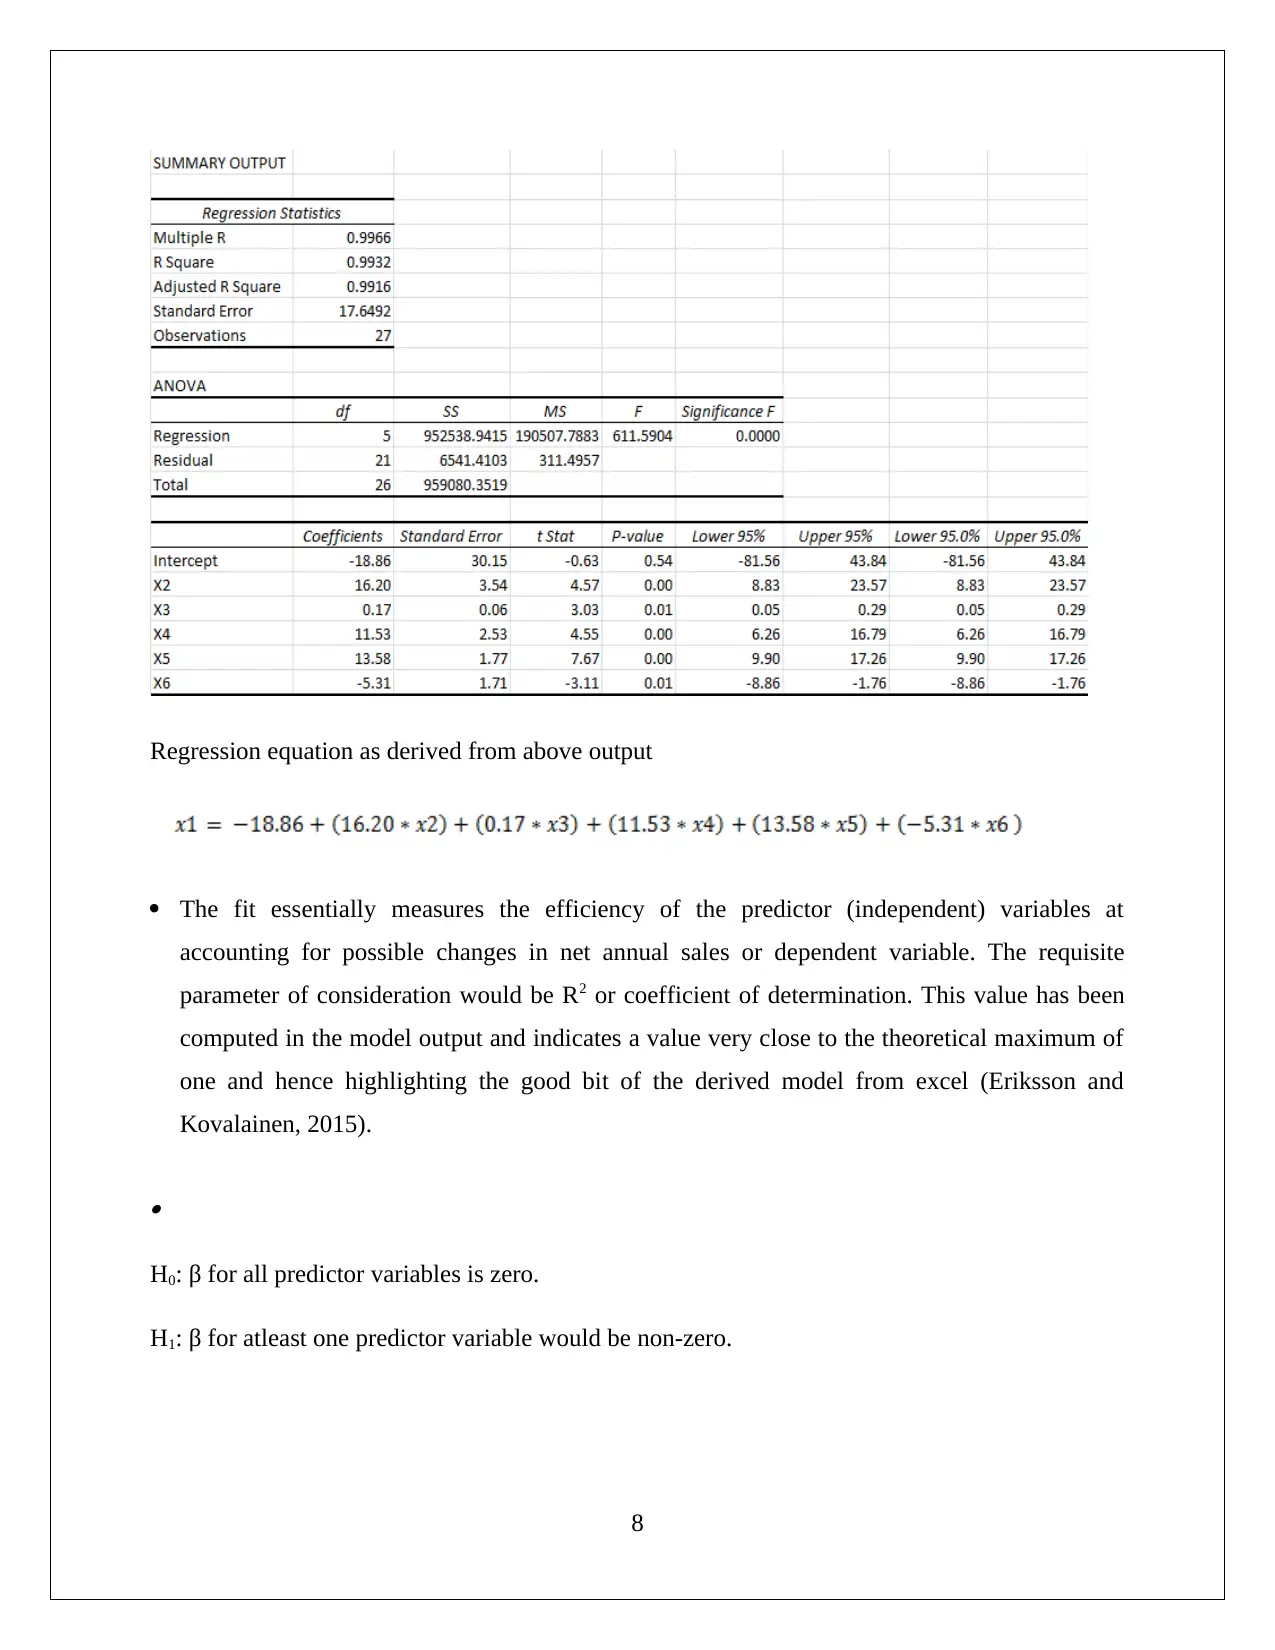
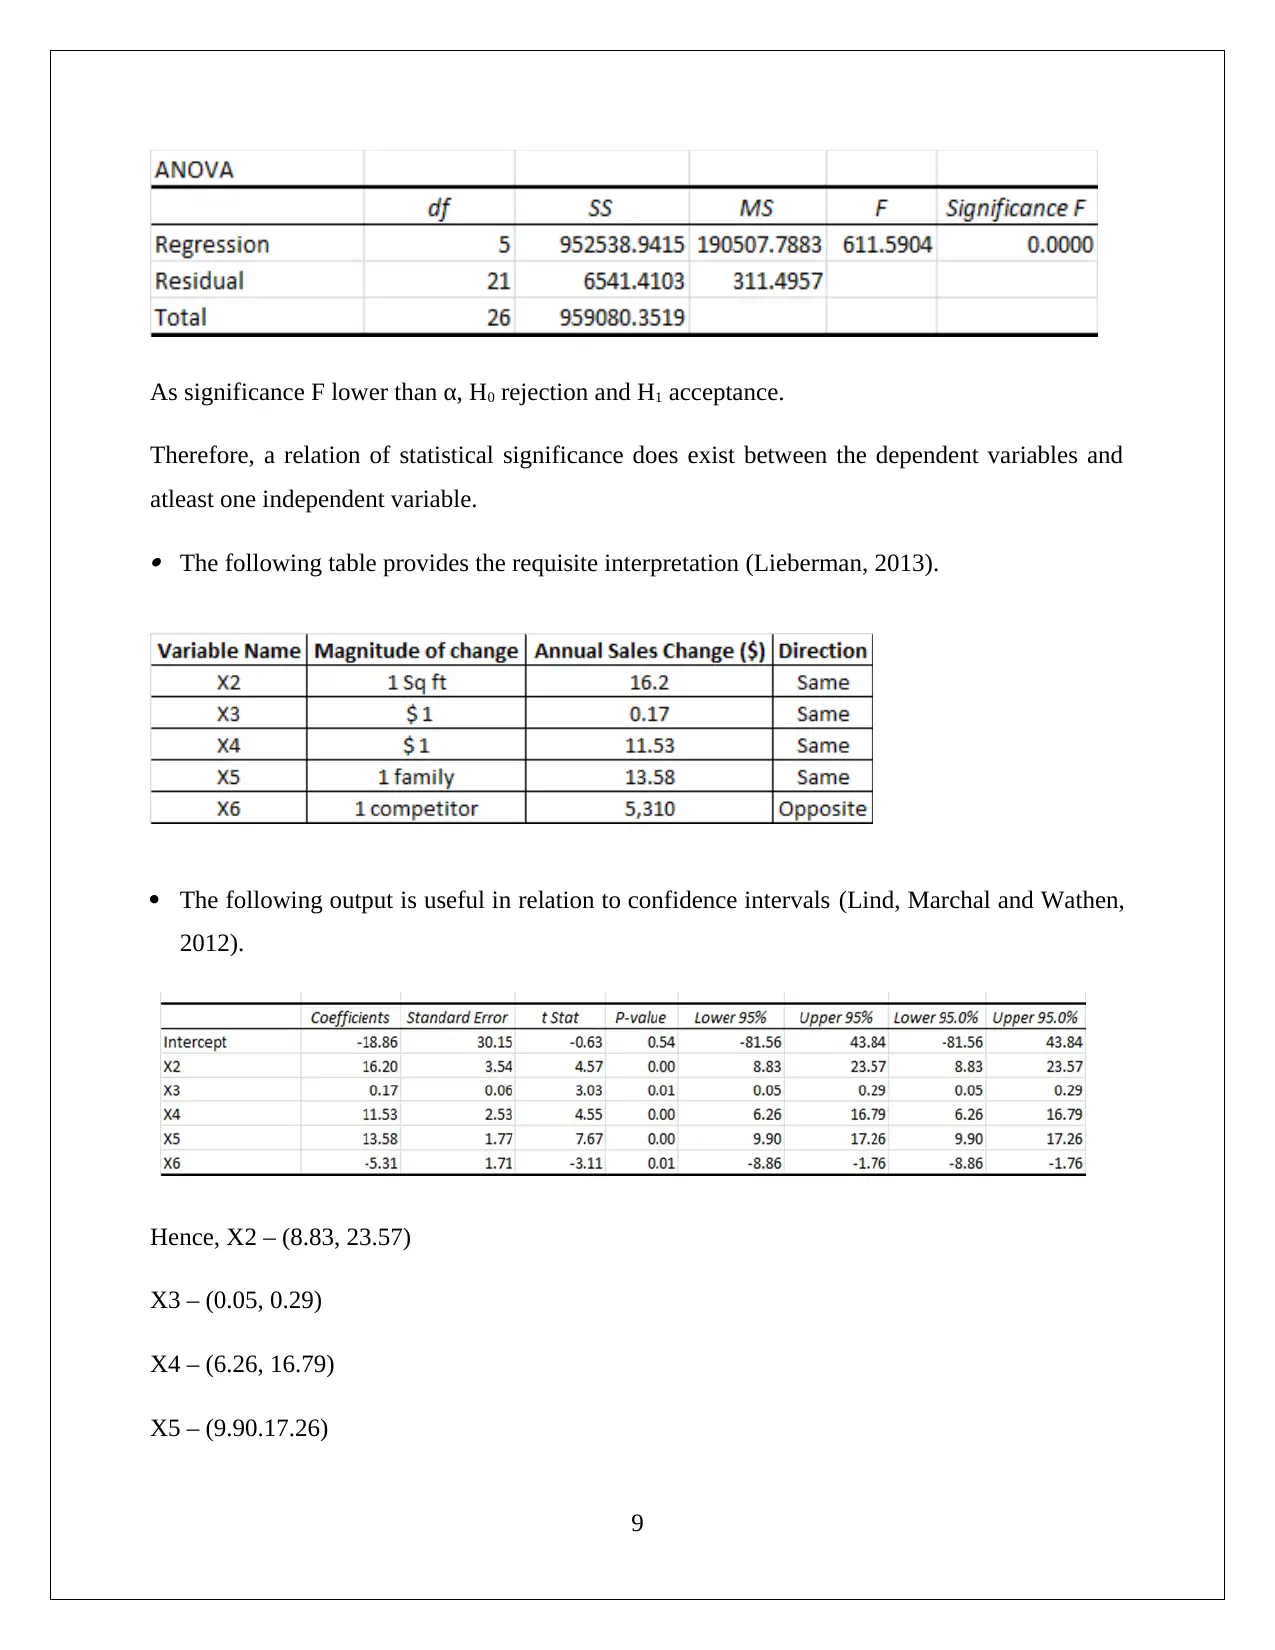
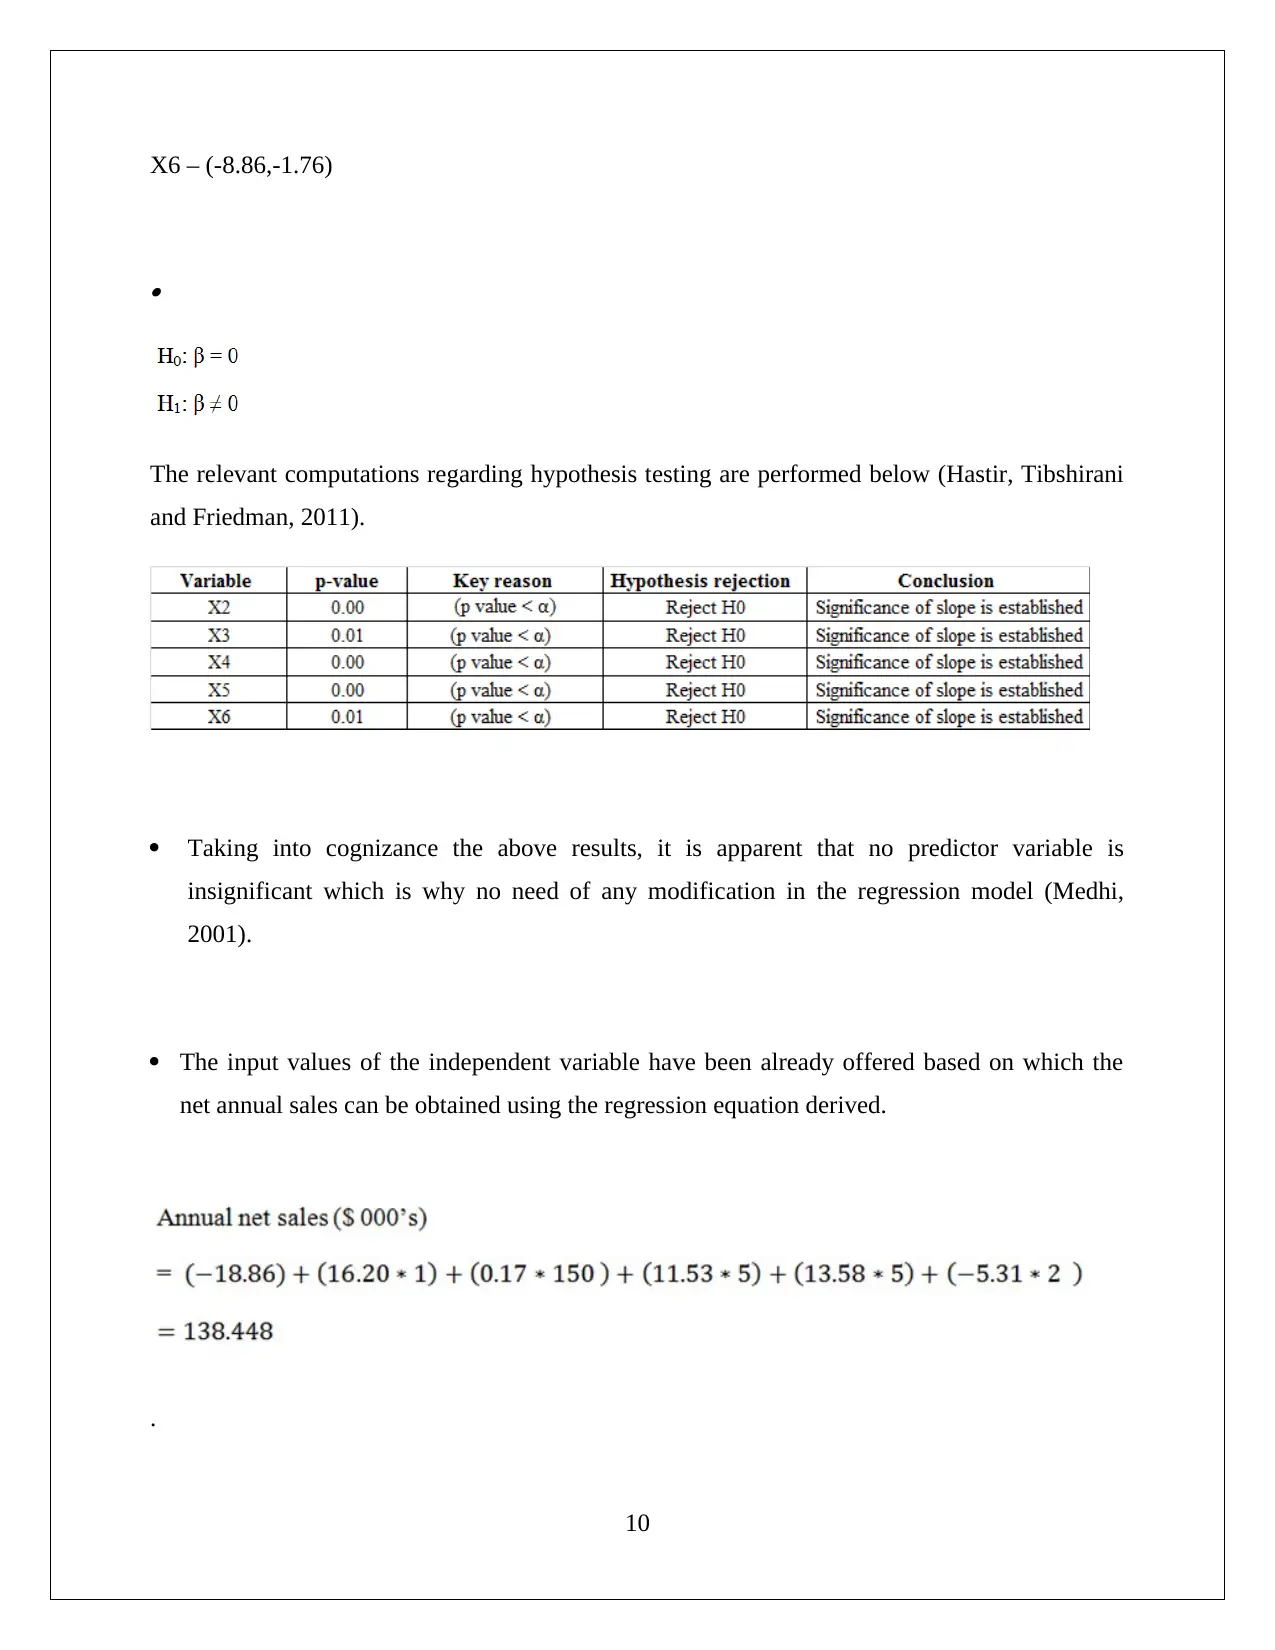
This assignment solution for HI6007 Statistics presents a comprehensive analysis of two tasks. Task 1 focuses on analyzing startup costs across different businesses using frequency distribution tables and histograms. It includes hypothesis testing using ANOVA to compare average startup costs, concluding with a statistically significant difference. Task 2 delves into regression analysis, examining the relationship between independent variables and net annual sales. The solution provides the regression equation, assesses the model's fit using the R-squared value, and performs hypothesis testing on the regression coefficients to determine statistical significance. The solution also interprets confidence intervals for predictor variables and concludes that no predictor variable is insignificant. The assignment uses various statistical methods, including ANOVA and regression, to draw meaningful conclusions from the data. The solution includes references to key statistical literature.
Document Page
HI6007 STATISTICS
Student Id
[Pick the date]
tabler-icon-diamond-filled.svg

Paraphrase This Document

Need a fresh take? Get an instant paraphrase of this document with our AI Paraphraser
Document Page
TASK 1
1) The tables below highlight the relevant computations required (Lehman and Romano, 2006):
1
Document Page
2) (a) The requisite distribution tables for frequency are shown as follows (Koch, 2013).
2
Document Page
(b) Histogram
3
tabler-icon-diamond-filled.svg

Paraphrase This Document

Need a fresh take? Get an instant paraphrase of this document with our AI Paraphraser
Document Page
4
Document Page
5
Document Page
3) Two significant observations derived from the above data are listed below.
The histogram clearly reflects that distribution of startup costs is not normal owing to
presence of tails on either side. This is also supported by the central tendency measures whose
value is non-coinciding (Eriksson and Kovalainen, 2015).
Also, there seems to be noticeable variation in the startup costs. Significant amongst them is
the cost related to pet shop which is quite less in comparison to other businesses (Lehman
and Romano, 2006)
4) H0: μX1= μX2= μX3= μX4= μX5= μX6
H1: One of the above average costs is different from the other
Suitable Test: ANOVA (one factor)
Reason for deployment: Comparison to be carried out amongst more than two variables
6
tabler-icon-diamond-filled.svg

Paraphrase This Document

Need a fresh take? Get an instant paraphrase of this document with our AI Paraphraser
Document Page
Observation: The p value (0.02) tends to be lower than the corresponding level of significance
(0.05)
Conclusion: Average costs for startup tend to differ in a statistically significant manner (Medhi,
2001).
TASK 2
The regression output from MS-Excel is as highlighted follows.
7
Document Page
Regression equation as derived from above output
The fit essentially measures the efficiency of the predictor (independent) variables at
accounting for possible changes in net annual sales or dependent variable. The requisite
parameter of consideration would be R2 or coefficient of determination. This value has been
computed in the model output and indicates a value very close to the theoretical maximum of
one and hence highlighting the good bit of the derived model from excel (Eriksson and
Kovalainen, 2015).

H0: β for all predictor variables is zero.
H1: β for atleast one predictor variable would be non-zero.
8
Document Page
As significance F lower than α, H0 rejection and H1 acceptance.
Therefore, a relation of statistical significance does exist between the dependent variables and
atleast one independent variable.
The following table provides the requisite interpretation (Lieberman, 2013).
The following output is useful in relation to confidence intervals (Lind, Marchal and Wathen,
2012).
Hence, X2 – (8.83, 23.57)
X3 – (0.05, 0.29)
X4 – (6.26, 16.79)
X5 – (9.90.17.26)
9
tabler-icon-diamond-filled.svg

Paraphrase This Document

Need a fresh take? Get an instant paraphrase of this document with our AI Paraphraser
Document Page
X6 – (-8.86,-1.76)

The relevant computations regarding hypothesis testing are performed below (Hastir, Tibshirani
and Friedman, 2011).
Taking into cognizance the above results, it is apparent that no predictor variable is
insignificant which is why no need of any modification in the regression model (Medhi,
2001).
The input values of the independent variable have been already offered based on which the
net annual sales can be obtained using the regression equation derived.
.
10
Document Page
Reference
Eriksson, P. and Kovalainen, A. (2015) Quantitative methods in business research. 3rd edn.
London: Sage Publications.
Hastie, T., Tibshirani, R. and Friedman, J. (2011) The Elements of Statistical Learning. 4th
edn. New York: Springer Publications.
Koch, K.R. (2013) Parameter Estimation and Hypothesis Testing in Linear Models. 2nd edn.
London: Springer Science & Business Media.
Lehman, L. E. and Romano, P. J. (2006) Testing Statistical Hypotheses. 3rd edn. Berlin :
Springer Science & Business Media.
Lieberman, F. J., Nag, B., Hiller, F.S. and Basu, P. (2013) Introduction To Operations Research.
5th edn. New Delhi: Tata McGraw Hill Publishers.
Lind, A.D., Marchal, G.W. and Wathen, A.S. (2012) Statistical Techniques in Business and
Economics. 15th edn. New York : McGraw-Hill/Irwin.
Medhi, J. (2001) Statistical Methods: An Introductory Text. 4th edn. Sydney: New Age
International.
Taylor, K. J. and Cihon, C. (2004) Statistical Techniques for Data Analysis. 2nd edn.
Melbourne: CRC Press. (Taylor and Cihon, 2004)
11
chevron_up_icon
1 out of 12
circle_padding
hide_on_mobile
zoom_out_icon
[object Object]