Regression Analysis and Statistical Tests Homework Solution

Verified

Added on  2022/08/11

|8
|699
|21
Homework Assignment
AI Summary
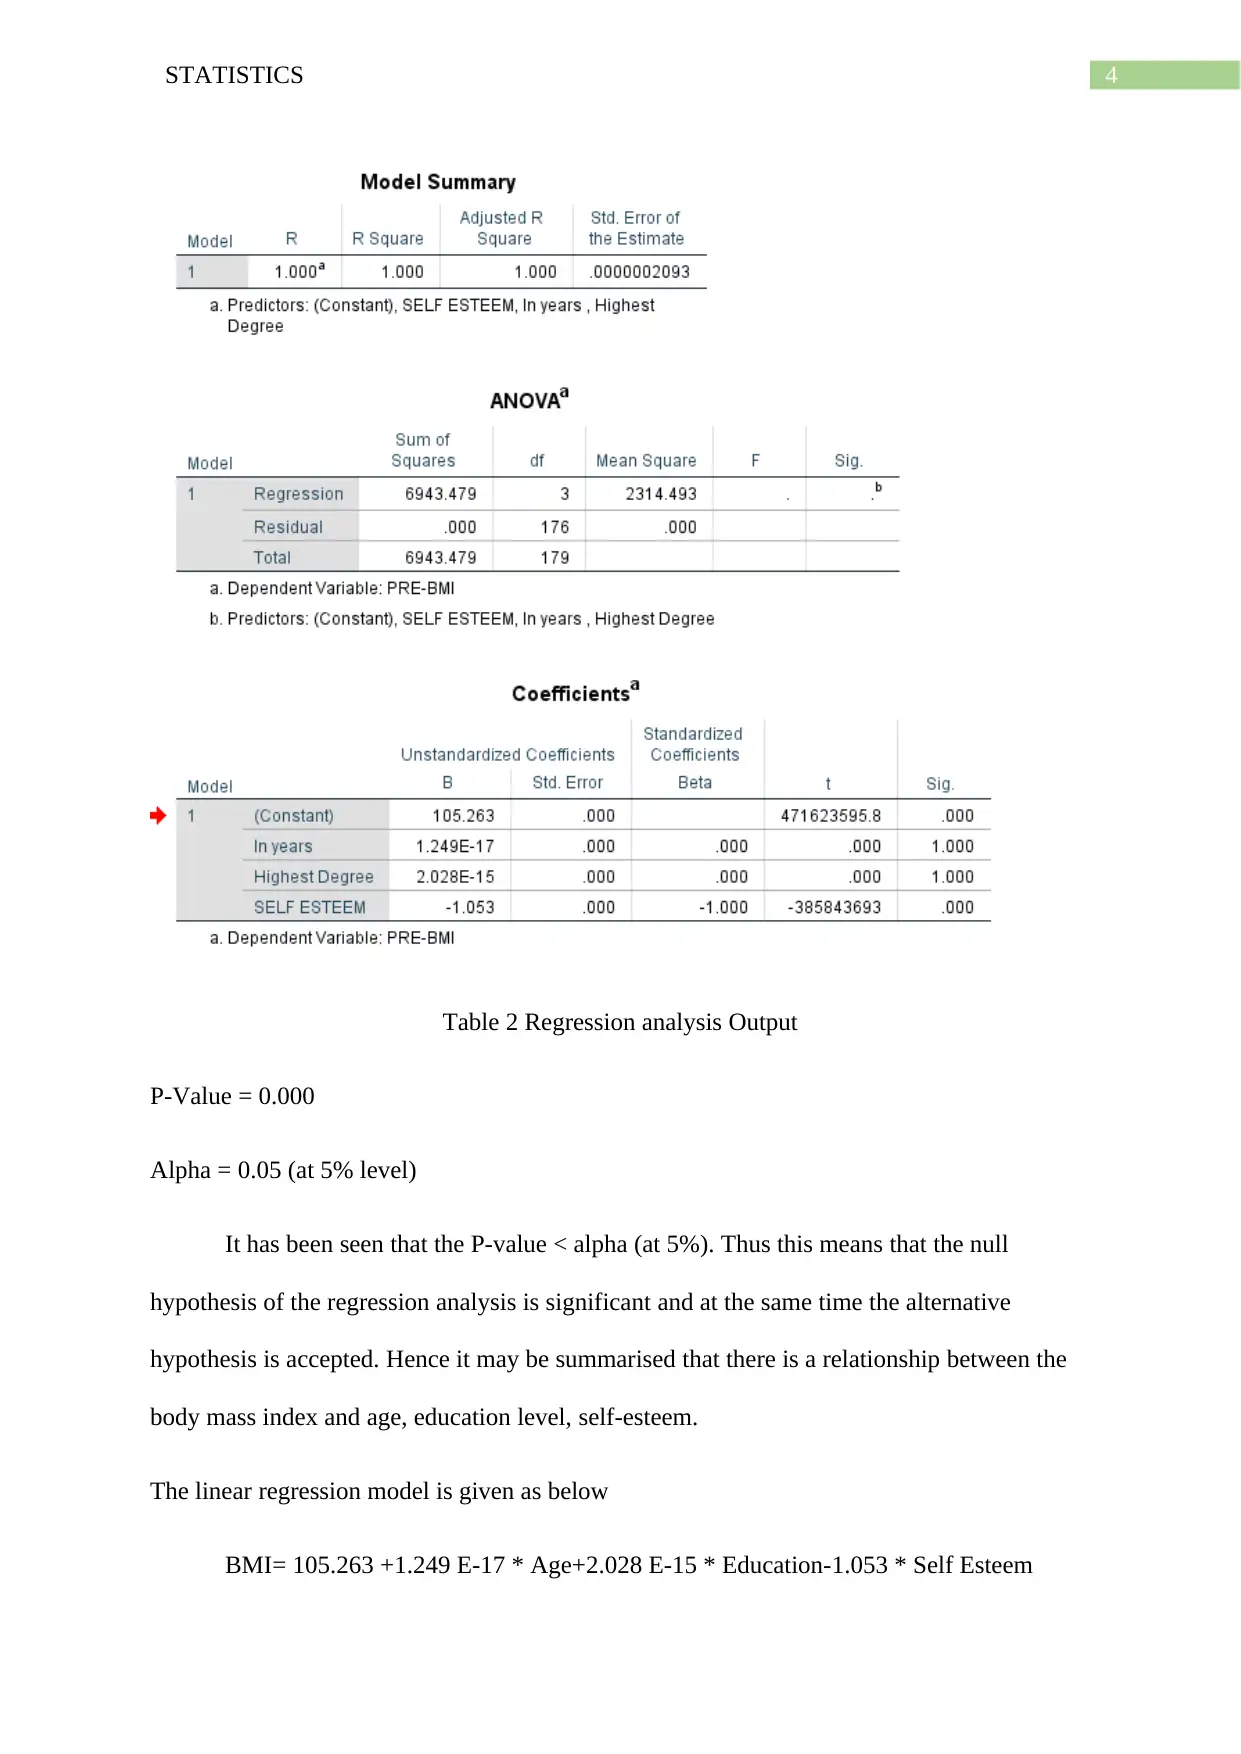
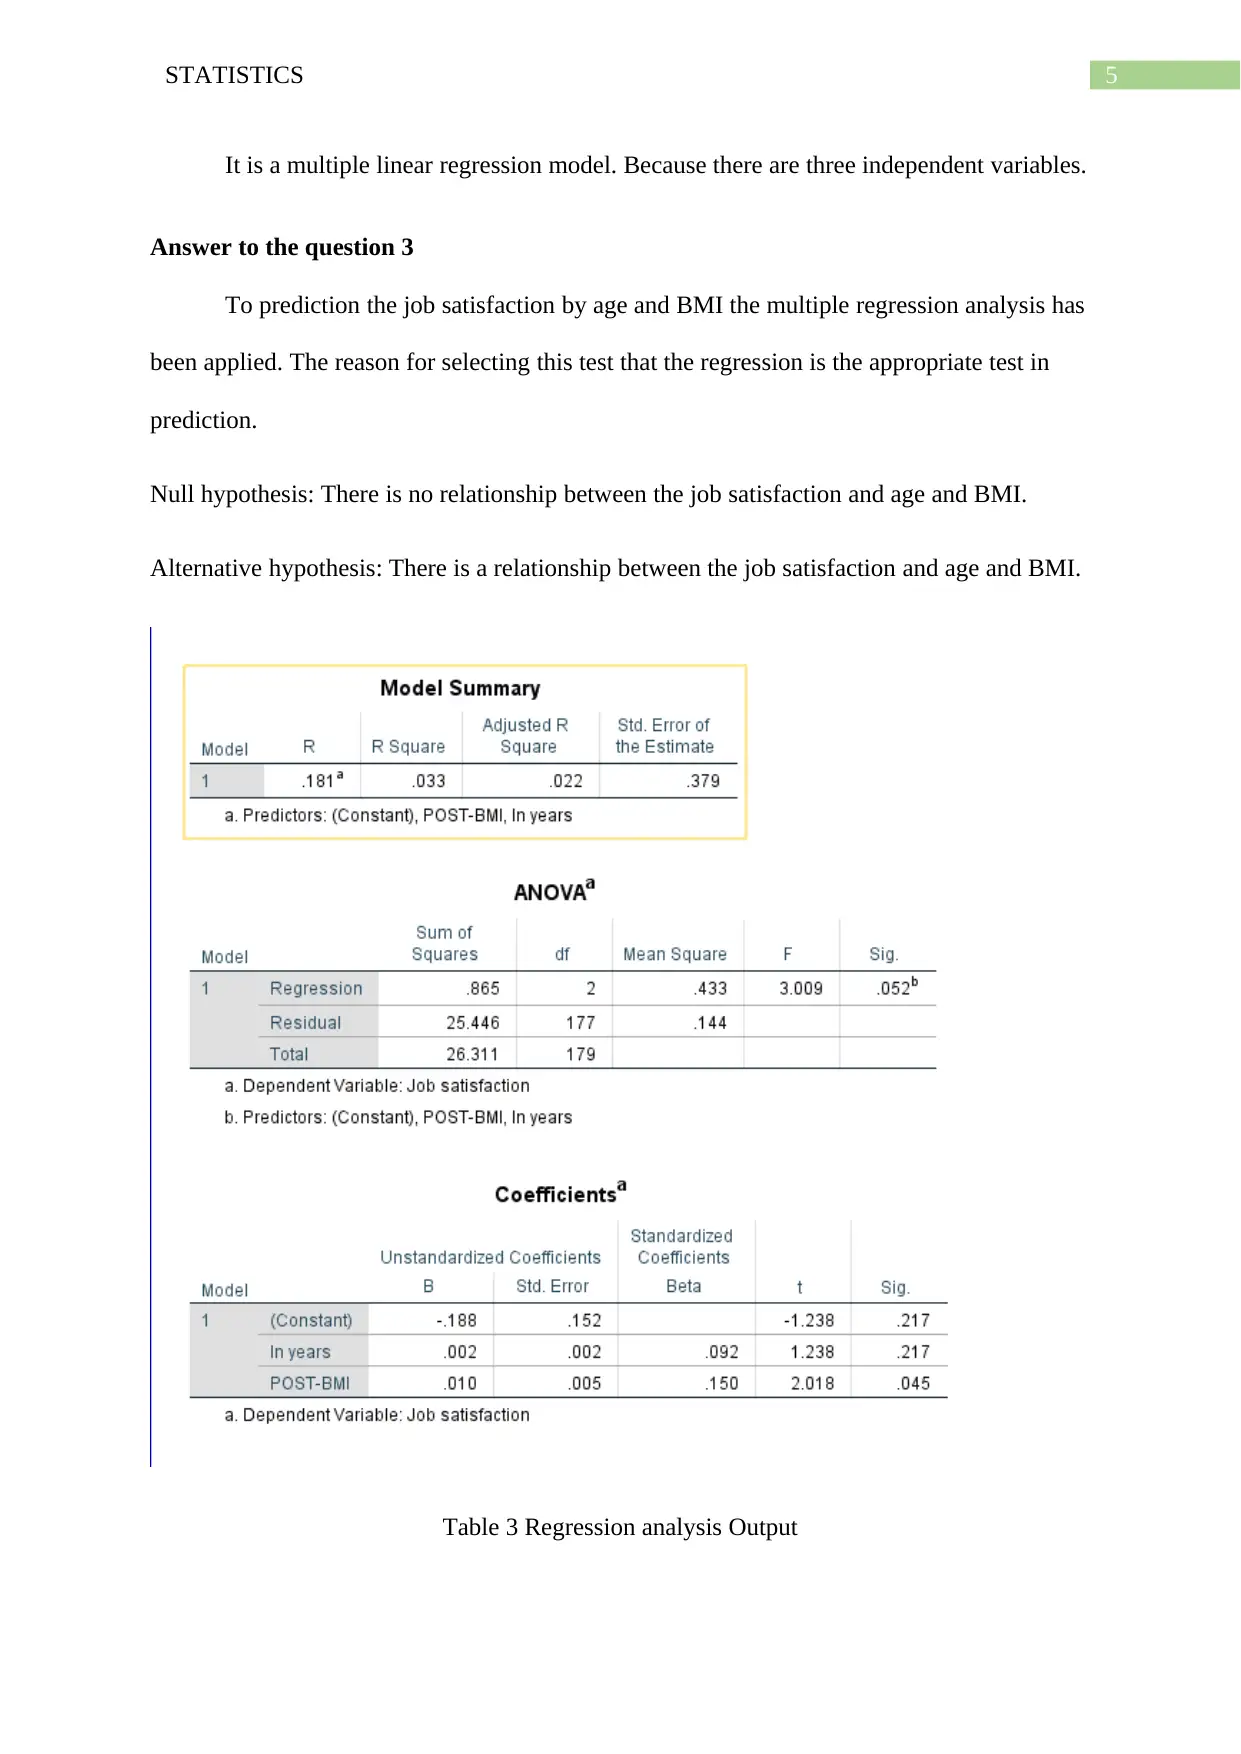
This document presents a comprehensive solution to a regression analysis assignment, addressing three research questions using statistical methods. The assignment utilizes data analysis techniques to determine relationships between variables such as BMI, self-esteem, age, and education level. Each question is approached with a clearly defined null and alternative hypothesis, followed by the selection and application of appropriate statistical tests, specifically regression analysis. The document provides detailed outputs, including p-values and interpretations, to determine the significance of the findings. The first analysis examines the predictive power of BMI on self-esteem using a simple linear regression model. The second analysis explores multiple linear regression to predict BMI based on age, education level, and self-esteem. The third analysis investigates the relationship between job satisfaction, age, and BMI using multiple regression. Each section includes a summary of the findings, determining whether to accept or reject the null hypothesis. The document concludes with a bibliography of relevant sources.
Document Page
Running head: STATISTICS
Statistics
Name of the Student:
Name of the University:
Author note:
tabler-icon-diamond-filled.svg

Paraphrase This Document

Need a fresh take? Get an instant paraphrase of this document with our AI Paraphraser
Document Page
1STATISTICS
Table of Contents
Answer to the question 1............................................................................................................2
Answer to the question 2............................................................................................................3
Answer to the question 3............................................................................................................5
Bibliography...............................................................................................................................7
Document Page
2STATISTICS
Answer to the question 1
To prediction the Self-Esteem by body mass index (BMI) the regression analysis has
been applied. The reason for selecting this test is that the regression is the appropriate test in
prediction.
Null hypothesis: There is no relationship between the body mass index and Self-Esteem.
Alternative hypothesis: There is a relationship between the body mass index and Self-Esteem.
Table 1 Regression analysis Output
P-Value = 0.000
Alpha = 0.05 (at 5% level)
Document Page
3STATISTICS
It has been seen that the P-value < alpha (at 5%). Thus this means that the null
hypothesis of the regression analysis is significant and at the same time the alternative
hypothesis is accepted. Hence it may be summarised that there is a relationship between the
body mass index and Self-Esteem.
The linear regression model is given as below
Self-esteem = 100 - 0.950 * Pre BMI
It is a simple linear regression model.
Answer to the question 2
To prediction the body mass index (BMI) by age, education level, self-esteem the
multiple regression analysis has been applied. The reason for selecting this test that the
regression is the appropriate test in prediction.
Null hypothesis: There is no relationship between the body mass index and age, education
level, self-esteem.
Alternative hypothesis: There is a relationship between the body mass index and age,
education level, self-esteem.
tabler-icon-diamond-filled.svg

Paraphrase This Document

Need a fresh take? Get an instant paraphrase of this document with our AI Paraphraser
Document Page
4STATISTICS
Table 2 Regression analysis Output
P-Value = 0.000
Alpha = 0.05 (at 5% level)
It has been seen that the P-value < alpha (at 5%). Thus this means that the null
hypothesis of the regression analysis is significant and at the same time the alternative
hypothesis is accepted. Hence it may be summarised that there is a relationship between the
body mass index and age, education level, self-esteem.
The linear regression model is given as below
BMI= 105.263 +1.249 E-17 * Age+2.028 E-15 * Education-1.053 * Self Esteem
Document Page
5STATISTICS
It is a multiple linear regression model. Because there are three independent variables.
Answer to the question 3
To prediction the job satisfaction by age and BMI the multiple regression analysis has
been applied. The reason for selecting this test that the regression is the appropriate test in
prediction.
Null hypothesis: There is no relationship between the job satisfaction and age and BMI.
Alternative hypothesis: There is a relationship between the job satisfaction and age and BMI.
Table 3 Regression analysis Output
Document Page
6STATISTICS
P-Value = 0.052
Alpha = 0.05 (at 5% level)
It has been seen that the P-value > alpha (at 5%). Thus this means that the null
hypothesis of the regression analysis is accepted and at the same time the alternative
hypothesis is not accepted. Hence it may be summarised that there is no relationship between
the job satisfaction and age and BMI.
The linear regression model is given as below
Job satisfaction = -0.188 +0.002 * Age + 0.010* BMI
It is a multiple linear regression model. Because there are two independent variables.
tabler-icon-diamond-filled.svg

Paraphrase This Document

Need a fresh take? Get an instant paraphrase of this document with our AI Paraphraser
Document Page
7STATISTICS
Bibliography
Cameron, A. C., & Trivedi, P. K. (2013). Regression analysis of count data (Vol. 53).
Cambridge university press.
Chatterjee, S., & Hadi, A. S. (2015). Regression analysis by example. John Wiley & Sons.
Gunst, R. F. (2018). Regression analysis and its application: a data-oriented approach.
Routledge.
Kleinbaum, D. G., Kupper, L. L., Nizam, A., & Rosenberg, E. S. (2013). Applied regression
analysis and other multivariable methods. Nelson Education.
chevron_up_icon
1 out of 8
circle_padding
hide_on_mobile
zoom_out_icon
[object Object]