BBUnderStat Week 7 Exercises: Regression Analysis Homework Solution
VerifiedAdded on 2023/01/03
|6
|307
|34
Homework Assignment
AI Summary
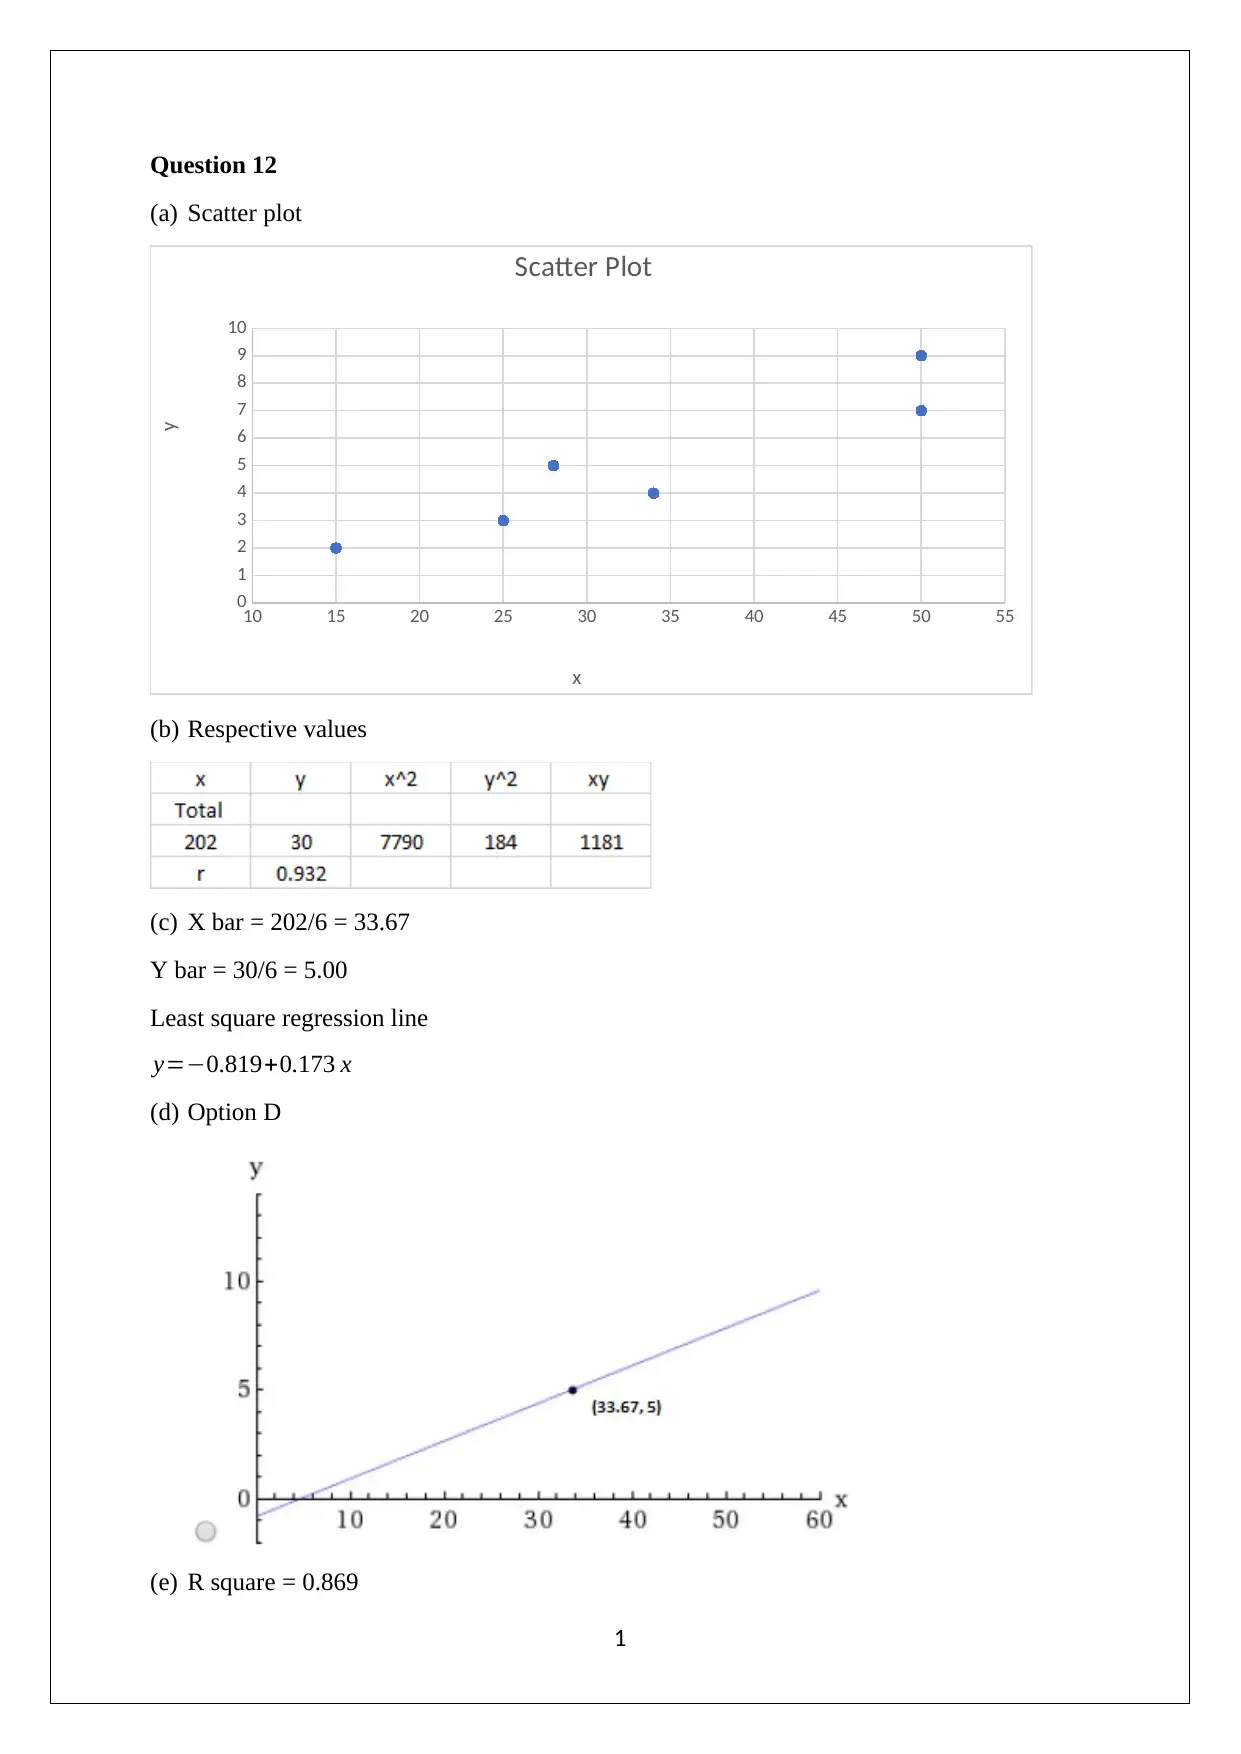
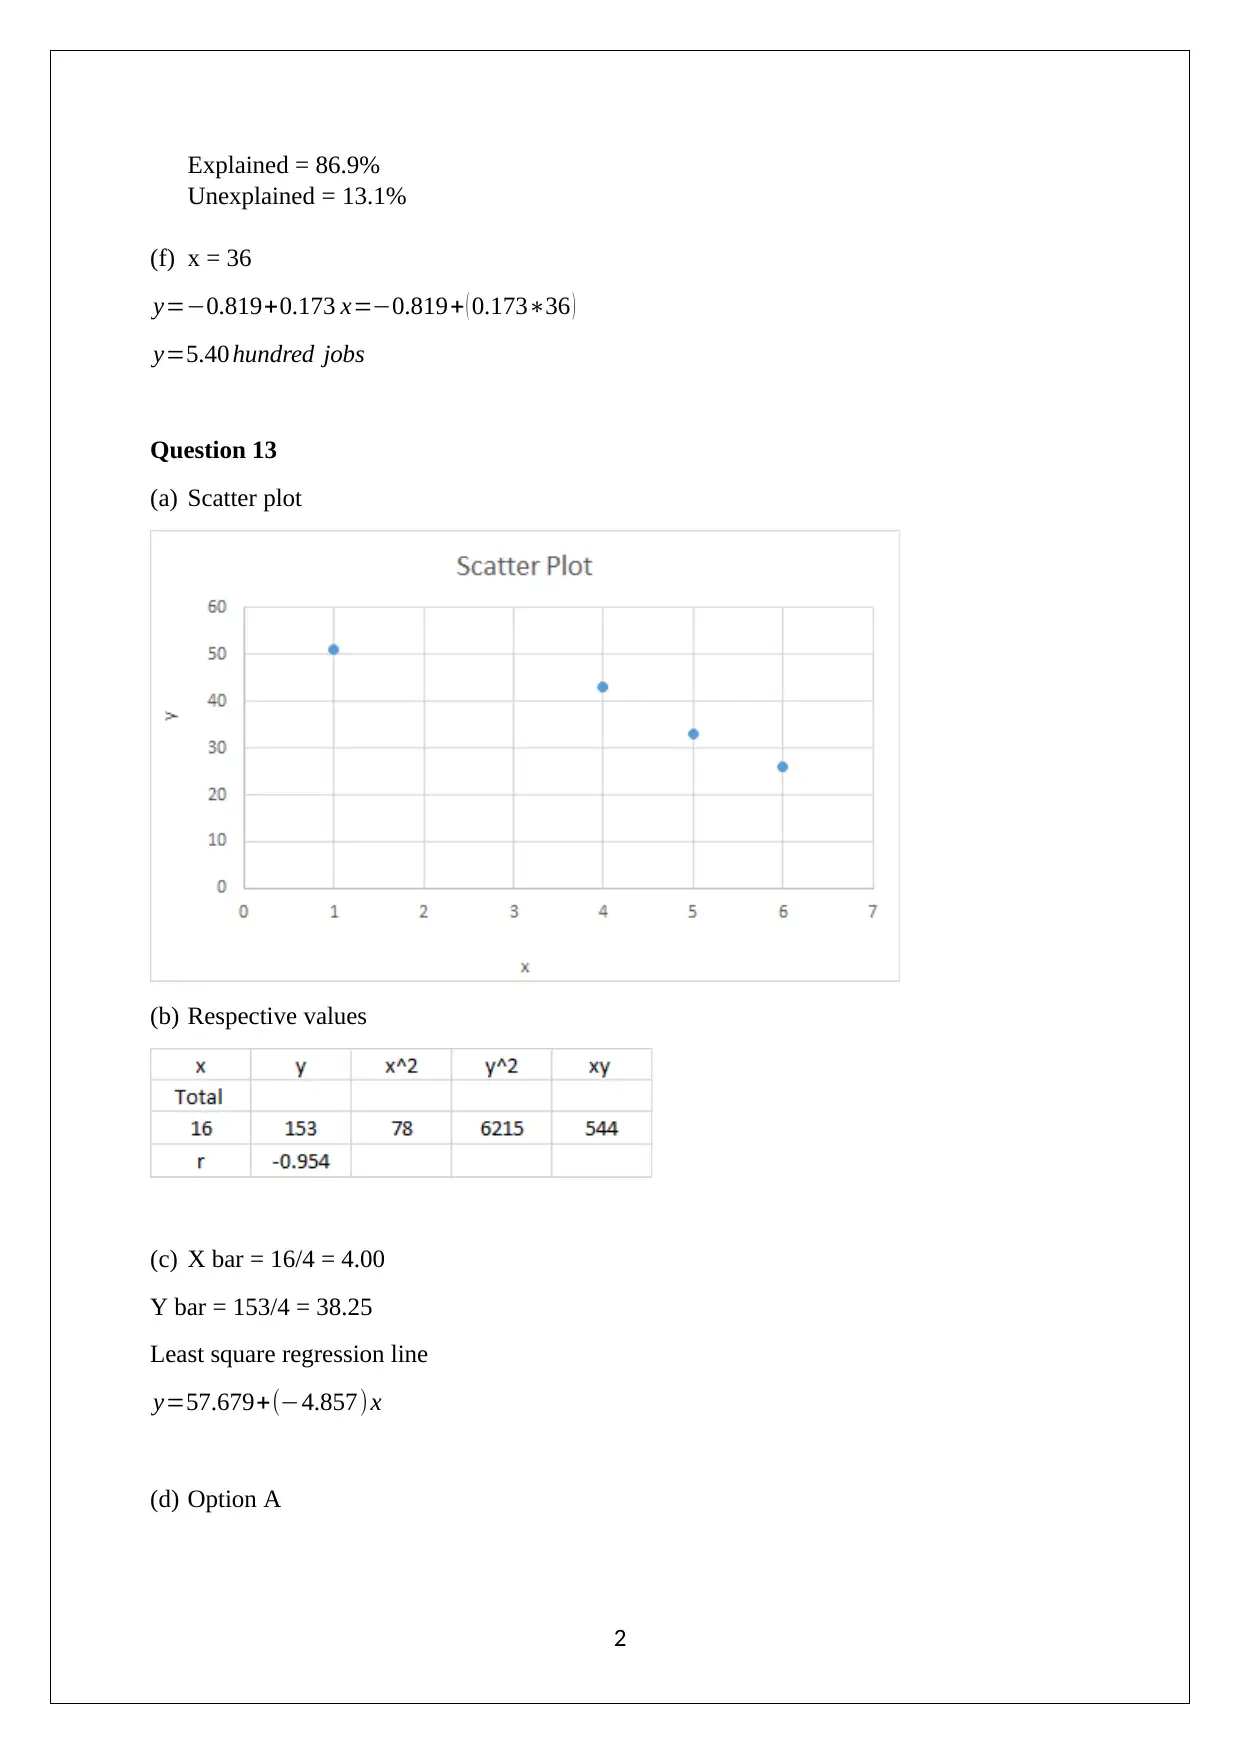
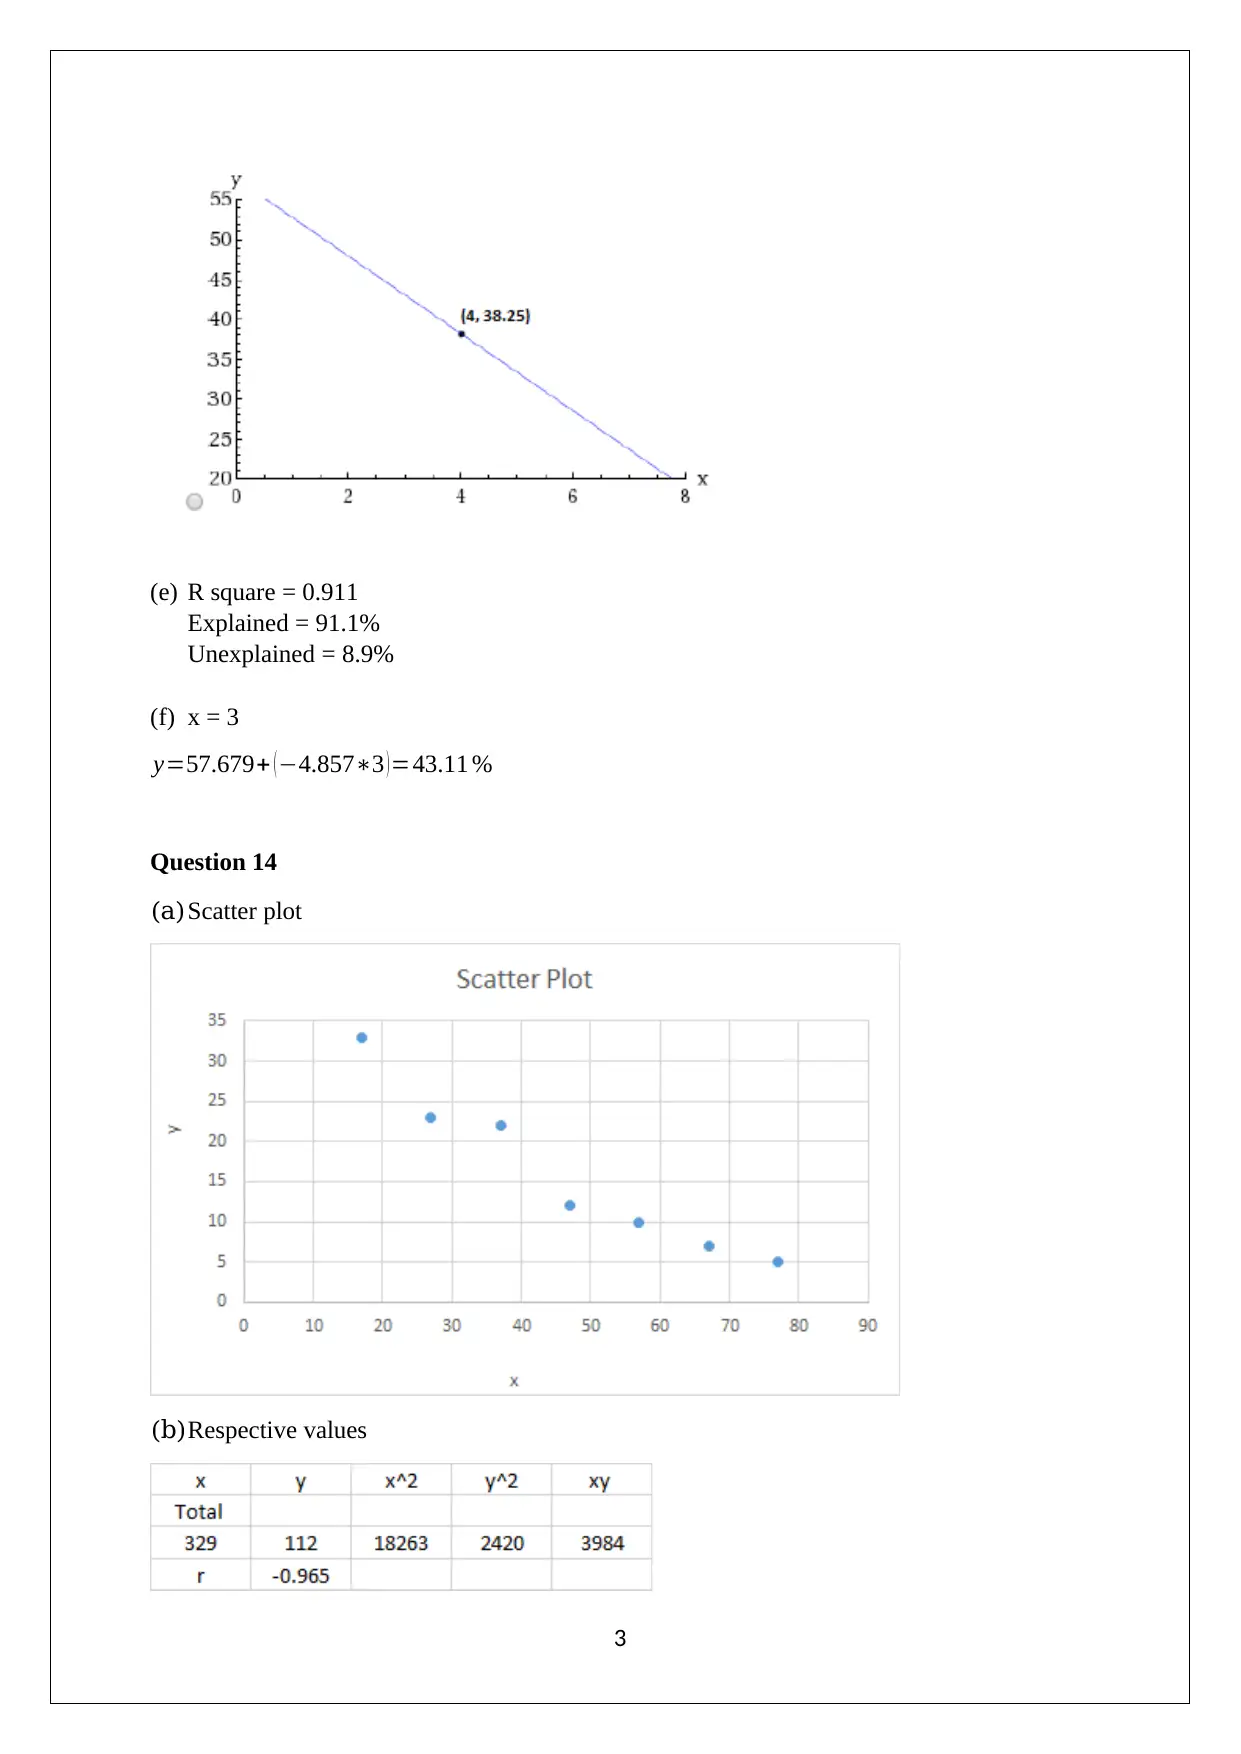
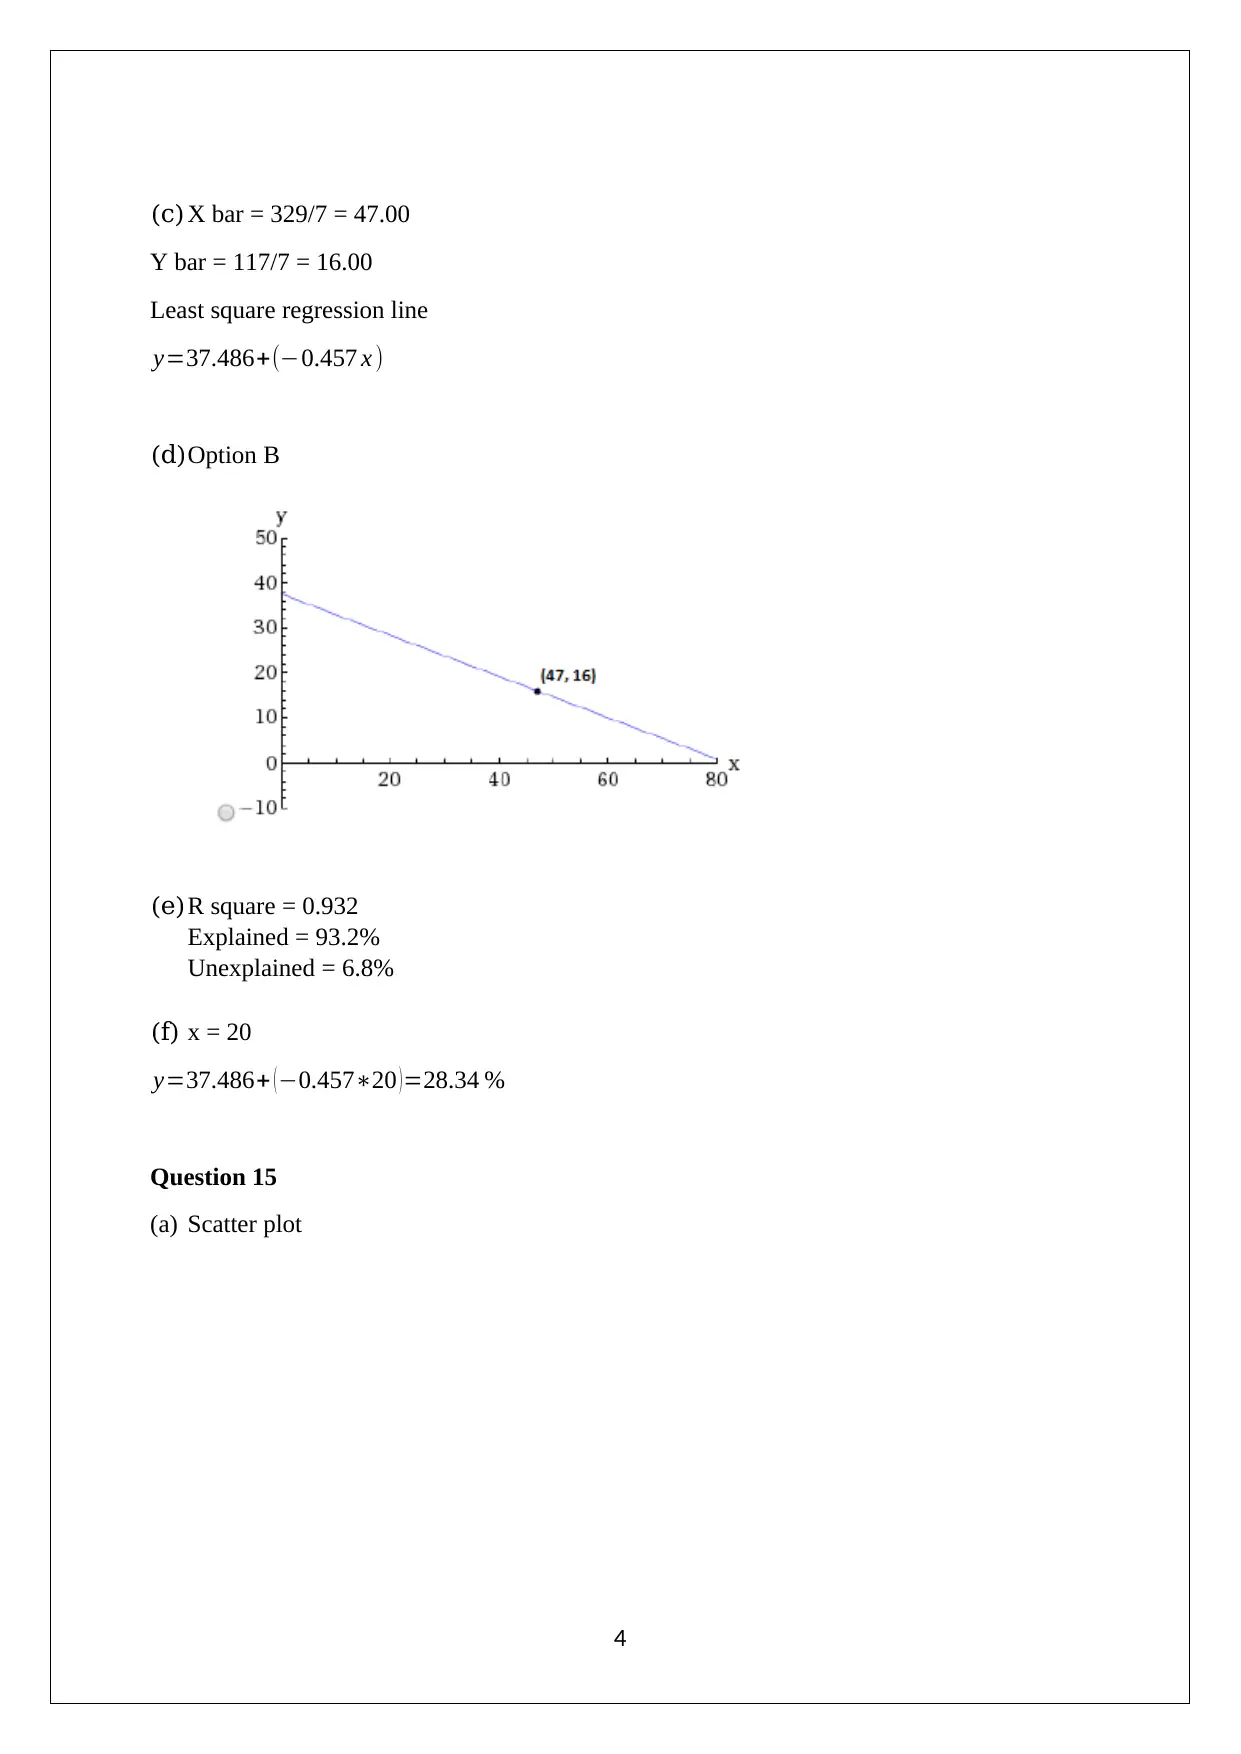
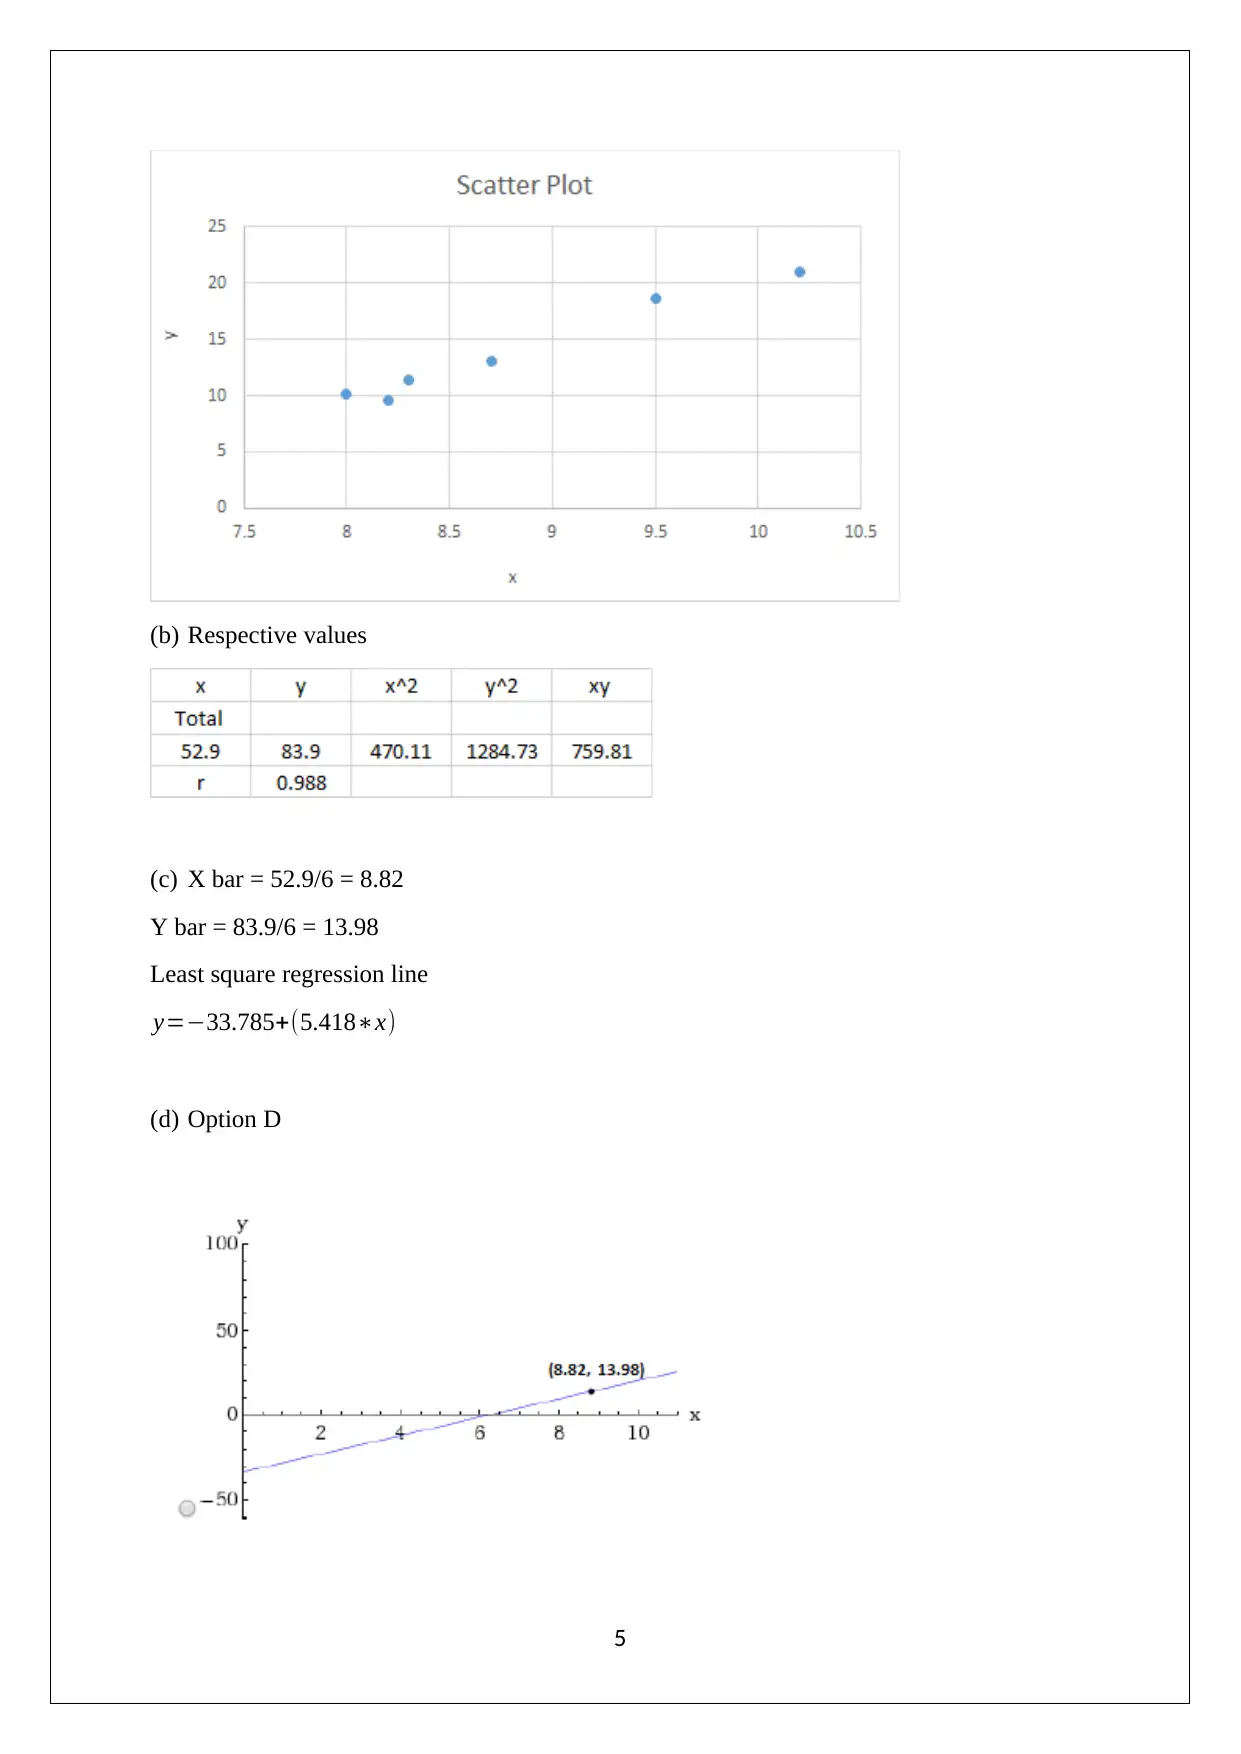
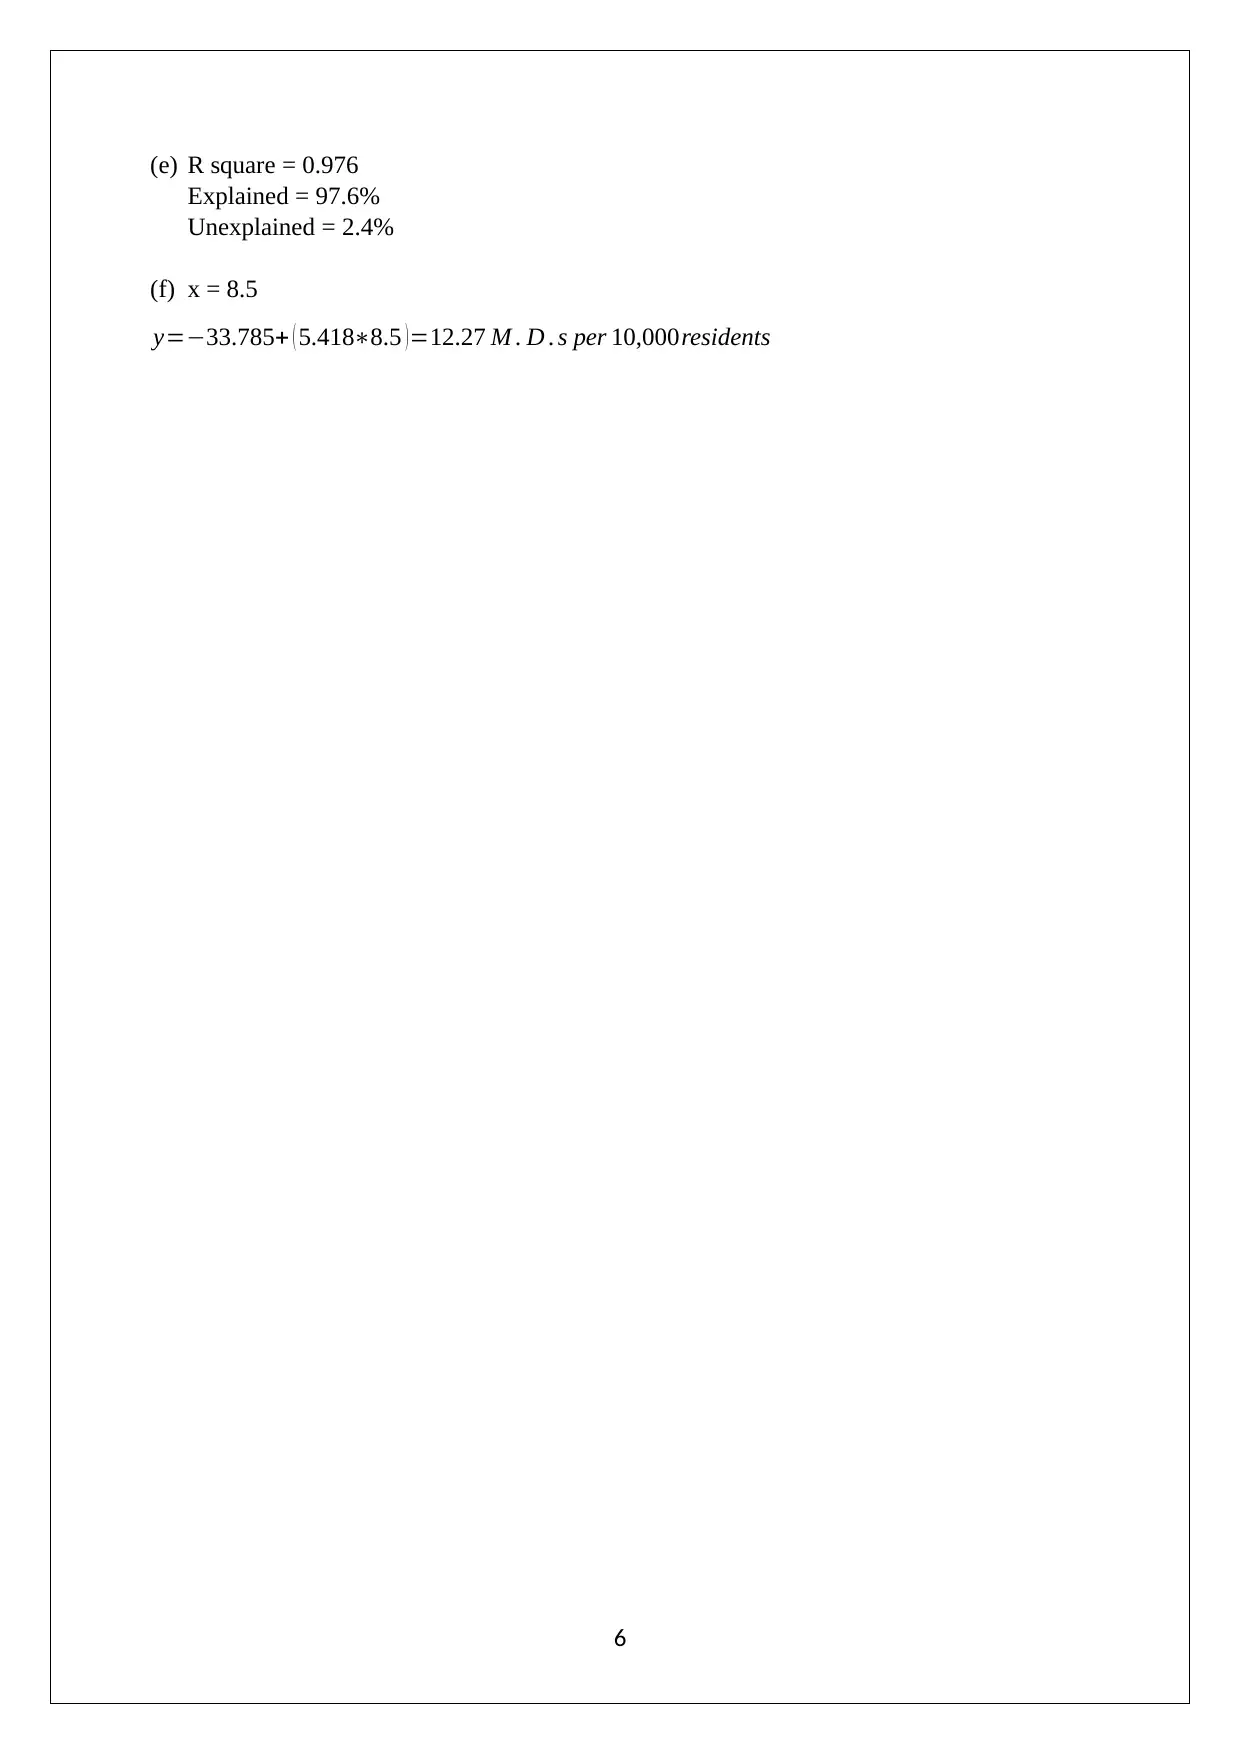
This document presents a complete solution to a statistics homework assignment focusing on regression analysis, as part of the BBUnderStat course. The assignment involves analyzing data related to the Denver job market, using concepts such as scatter plots, least squares regression lines, and correlation coefficients. The solution includes calculations for the sample means (x̄ and ȳ), the equation of the least-squares line, and the coefficient of determination (R-squared) for four different datasets. Each question's solution includes a scatter plot, the respective values, and the calculation of the least squares regression line. The document also provides interpretations of the R-squared values, explaining the explained and unexplained variance. Finally, the solution uses the regression equation to predict the value of y for a given value of x.
1 out of 6
Related Documents


Your All-in-One AI-Powered Toolkit for Academic Success.
+13062052269
info@desklib.com
Available 24*7 on WhatsApp / Email
![[object Object]](/_next/static/media/star-bottom.7253800d.svg)
Copyright © 2020–2026 A2Z Services. All Rights Reserved. Developed and managed by ZUCOL.