Statistics for Management Report - CPI, RPI, and Inflation Analysis
VerifiedAdded on 2020/10/23
|20
|4724
|57
Report
AI Summary
This report presents a comprehensive statistical analysis, focusing on Consumer Price Index (CPI), Retail Price Index (RPI), and inflation rates over a ten-year period. It includes data collection, graphical representations, and comparative analysis of CPI and RPI, along with the computation of annual inflation rates. The report delves into the importance of inflation in the economy, exploring its impact on purchasing power and investment. Further analysis involves the use of ogive charts for median hourly earnings and quartiles, and calculations of mean and standard deviation. The study also applies paired t-tests to assess statistical significance and constructs confidence intervals. The report concludes with a comparative analysis of various economic indicators, providing a holistic view of statistical methods and their application in economic analysis.
STATISTICS FOR
MANAGEMENT
MANAGEMENT
Paraphrase This Document
Need a fresh take? Get an instant paraphrase of this document with our AI Paraphraser
Table of Contents
INTRODUCTION...........................................................................................................................1
ACTIVITY 1....................................................................................................................................1
A) Collecting the data with regards to CPI and RPI for the last ten years..................................1
B) Producing graphical representation from the presented data ................................................3
.....................................................................................................................................................4
C) Analysing Retail Price Index (RPI) vs Consumer price Index (CPI).....................................5
D) Computation of annual inflation by application of CPI.........................................................5
E) Importance of inflation rate in the economy..........................................................................6
ACTIVITY 2....................................................................................................................................7
1. Using ogive chart for median hourly earnings and quartiles..................................................7
2. Calculating mean and standard deviation for carrying out hourly earnings of employees.....9
Standard deviation.....................................................................................................................10
...................................................................................................................................................10
B) Comparing two different regions with relation to earnings.................................................10
ACTIVITY 3..................................................................................................................................11
A. Paired t test at 5% significant level......................................................................................11
B. Paired t test-usual conditions ...............................................................................................11
C. Construction of 99% construction level for reduction of the mean....................................12
ACTIVITY 4..................................................................................................................................13
A. Presenting the data of CPI , RPI and CPIH in graph format...............................................13
B. Producing a Ogive chart for cumulative% of the staff vs hourly earnings..........................14
CONCLUSION..............................................................................................................................15
REFERENCES..............................................................................................................................16
INTRODUCTION
Statistics is a branch of data which effectively uses complex data in effective manner and
then resolves the same with the help of mathematical tools in effectual way. Statistical methods
such as mean, median, mode, standard deviation are important methods for attaining the results
in the best manner possible. It can be said that business may be able to attain clarity with
reference to performance being provided by statistical methods which transforms complex data
into understandable manner. Statistics is used in fields such as operations, production, quality
assurance and initiating financial analysis in effectual manner. Present report deals with making
analysis of last ten years data with reference to RPI and CPI. Moreover, various activities are
being ascertained in which statistical methods are implemented for resolving questions and
recommendation to clients will be provided. On the other hand, significance of inflation rate will
be addressed in the file. While, report will cover hourly earnings of workers in different regions
of UK. At the significance level of 95 % interval will be computed for assessing old system and
new system in effective manner. Moreover, for better representation of data in understandable
manner, graphs have been presented. Thus, statistical methods will be applied for attaining
results quite effectually.
ACTIVITY 1
A) Collecting the data with regards to CPI and RPI for the last ten years
Retail Price Index (RPI)
The RPI is a measure which is used by ONS (Office for National Statistics) of UK for
effectively measuring change in sample cost having representative of retail items and goods in
effective manner (James, 2018). The RPI is much utilised by government of UK to measure
changes of buying basket of products which is in relation to inflationary situation in the UK. This
means that retail buying capacity measure is used by government so as to analyse how much
inflation is caused by retail segment and is driving force for measuring inflation in the economy.
For accomplishing this, index is computed for the fix period which provides clarity with
reference to buying basket of commodities in the best manner possible (Quinlan, Babin, Carr and
Griffin, 2019).
The goods and commodities which are found under this category are petrol, diesel, food
items, fare for buses, household commodities up to a major extent. The weights are provided to
1
⊘ This is a preview!⊘
Do you want full access?
Subscribe today to unlock all pages.
Trusted by 1+ million students worldwide
the items on the basis of necessity which highlights that goods such as household items are
provided higher weights and of tobacco is provided lower weight. Thus, it can be said that RPI is
an important part of the statistical measure for analysing inflation in the economy of UK.
Consumer price Index (CPI)
The CPI is another useful measure for effectively ascertaining inflation in the economy. It
is termed as a measure examining weighted average of prices of consumer goods and services.
The basket of commodities and services include transportation, food items and medical care
(Ubøe, 2017). It is effectively computed by incorporating price changes for each of commodity
in pre-defined basket of goods and services and as a result, average is taken of them. It can be
said that changes in CPI are utilised for assessing price changes that are associated with standard
cost of living. CPI is important element and driving force for making analysis of deflation and
inflation in the economy.
It is one of the important part as an economic indicator and used for measuring
effectiveness of formulating economic policy government. CPI is helpful in getting idea about
price changes in economy and as a result, crucial economic decision-making can be done in the
best manner possible (Rivera and Groleau, 2018). CPI is a broader term which includes and is
applied to major parts such as food and beverages, apparel, housing, transportation, medical care,
recreation, education and communication and other types of items and services in effective
manner. This means that both CPI and RPI are important measures for carrying out inflation
which exists in the economy.
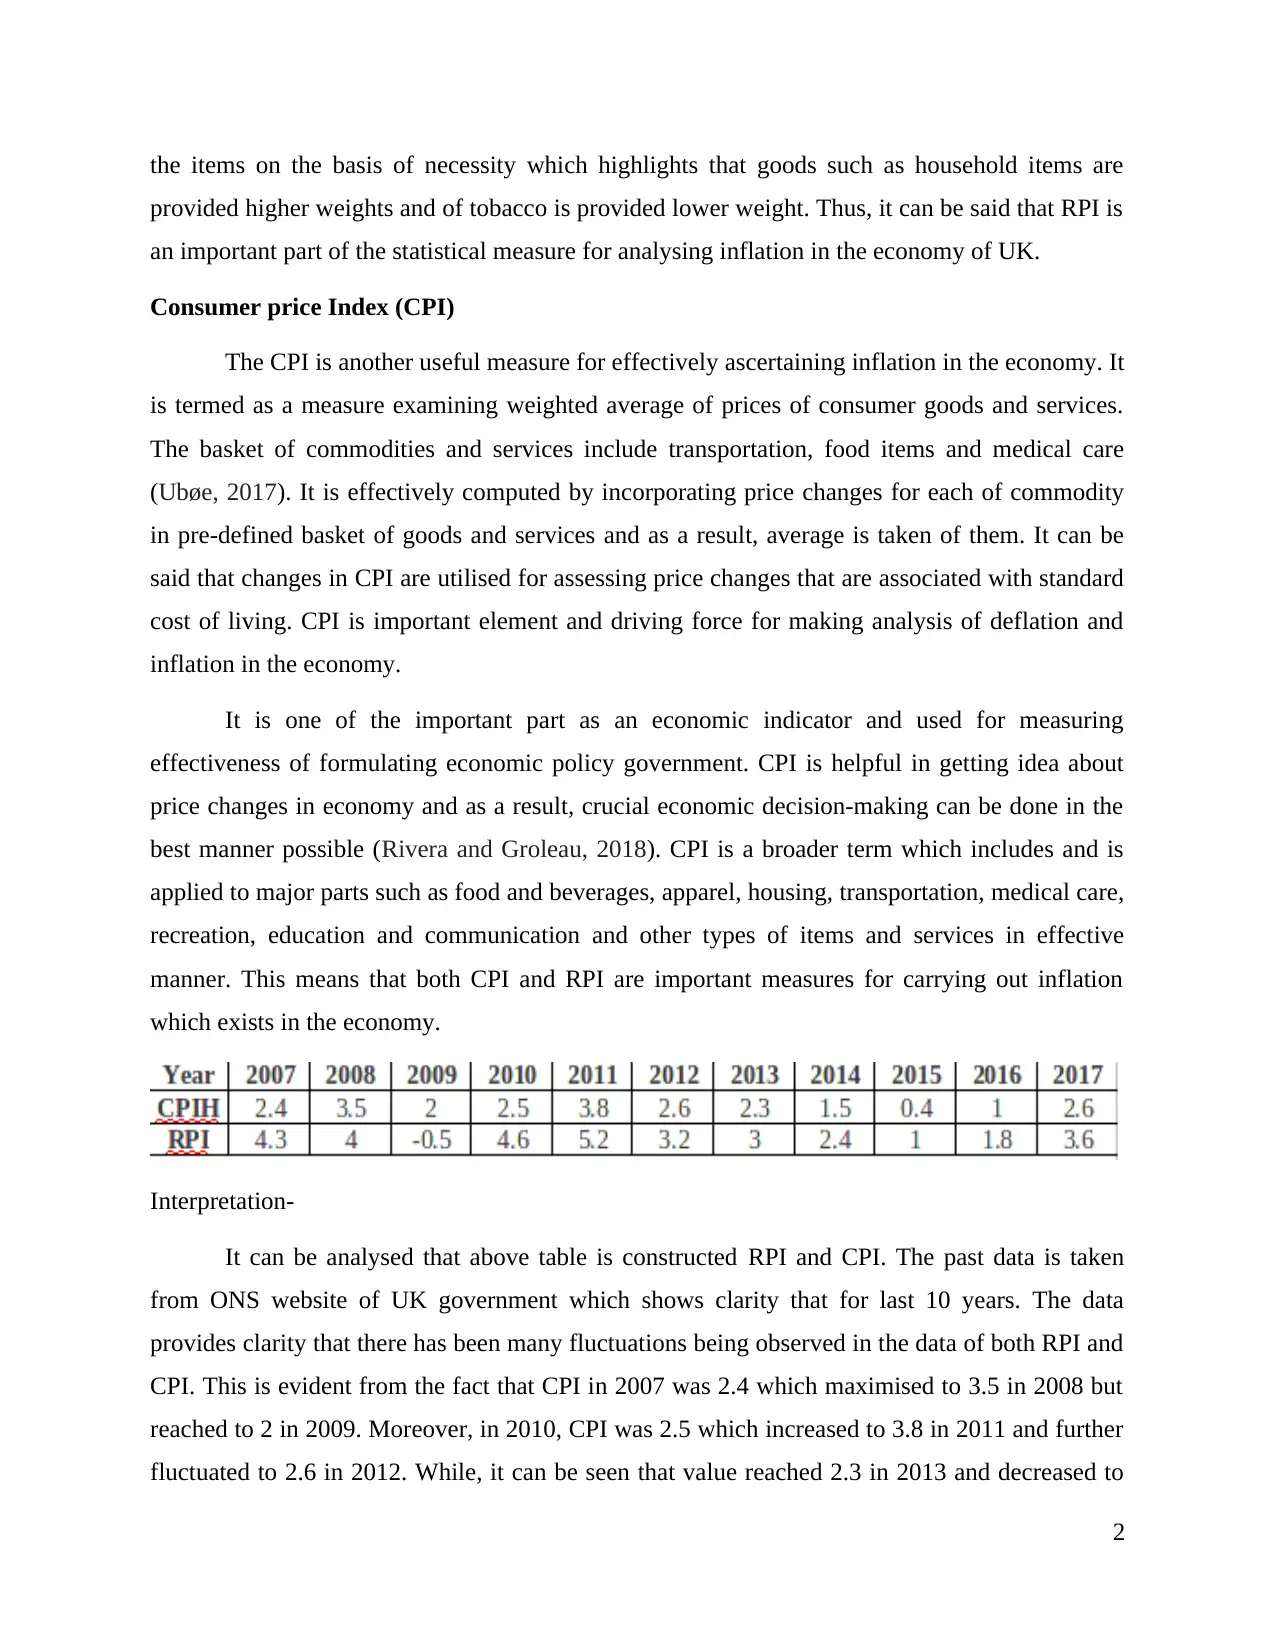
Interpretation-
It can be analysed that above table is constructed RPI and CPI. The past data is taken
from ONS website of UK government which shows clarity that for last 10 years. The data
provides clarity that there has been many fluctuations being observed in the data of both RPI and
CPI. This is evident from the fact that CPI in 2007 was 2.4 which maximised to 3.5 in 2008 but
reached to 2 in 2009. Moreover, in 2010, CPI was 2.5 which increased to 3.8 in 2011 and further
fluctuated to 2.6 in 2012. While, it can be seen that value reached 2.3 in 2013 and decreased to
2
provided higher weights and of tobacco is provided lower weight. Thus, it can be said that RPI is
an important part of the statistical measure for analysing inflation in the economy of UK.
Consumer price Index (CPI)
The CPI is another useful measure for effectively ascertaining inflation in the economy. It
is termed as a measure examining weighted average of prices of consumer goods and services.
The basket of commodities and services include transportation, food items and medical care
(Ubøe, 2017). It is effectively computed by incorporating price changes for each of commodity
in pre-defined basket of goods and services and as a result, average is taken of them. It can be
said that changes in CPI are utilised for assessing price changes that are associated with standard
cost of living. CPI is important element and driving force for making analysis of deflation and
inflation in the economy.
It is one of the important part as an economic indicator and used for measuring
effectiveness of formulating economic policy government. CPI is helpful in getting idea about
price changes in economy and as a result, crucial economic decision-making can be done in the
best manner possible (Rivera and Groleau, 2018). CPI is a broader term which includes and is
applied to major parts such as food and beverages, apparel, housing, transportation, medical care,
recreation, education and communication and other types of items and services in effective
manner. This means that both CPI and RPI are important measures for carrying out inflation
which exists in the economy.
Interpretation-
It can be analysed that above table is constructed RPI and CPI. The past data is taken
from ONS website of UK government which shows clarity that for last 10 years. The data
provides clarity that there has been many fluctuations being observed in the data of both RPI and
CPI. This is evident from the fact that CPI in 2007 was 2.4 which maximised to 3.5 in 2008 but
reached to 2 in 2009. Moreover, in 2010, CPI was 2.5 which increased to 3.8 in 2011 and further
fluctuated to 2.6 in 2012. While, it can be seen that value reached 2.3 in 2013 and decreased to
2
Paraphrase This Document
Need a fresh take? Get an instant paraphrase of this document with our AI Paraphraser
1.5 in 2014. It can be analysed that figure of CPI reached 0.4 in 2015 and in next year to 1 and
lastly 2.6 was attained in 2017.
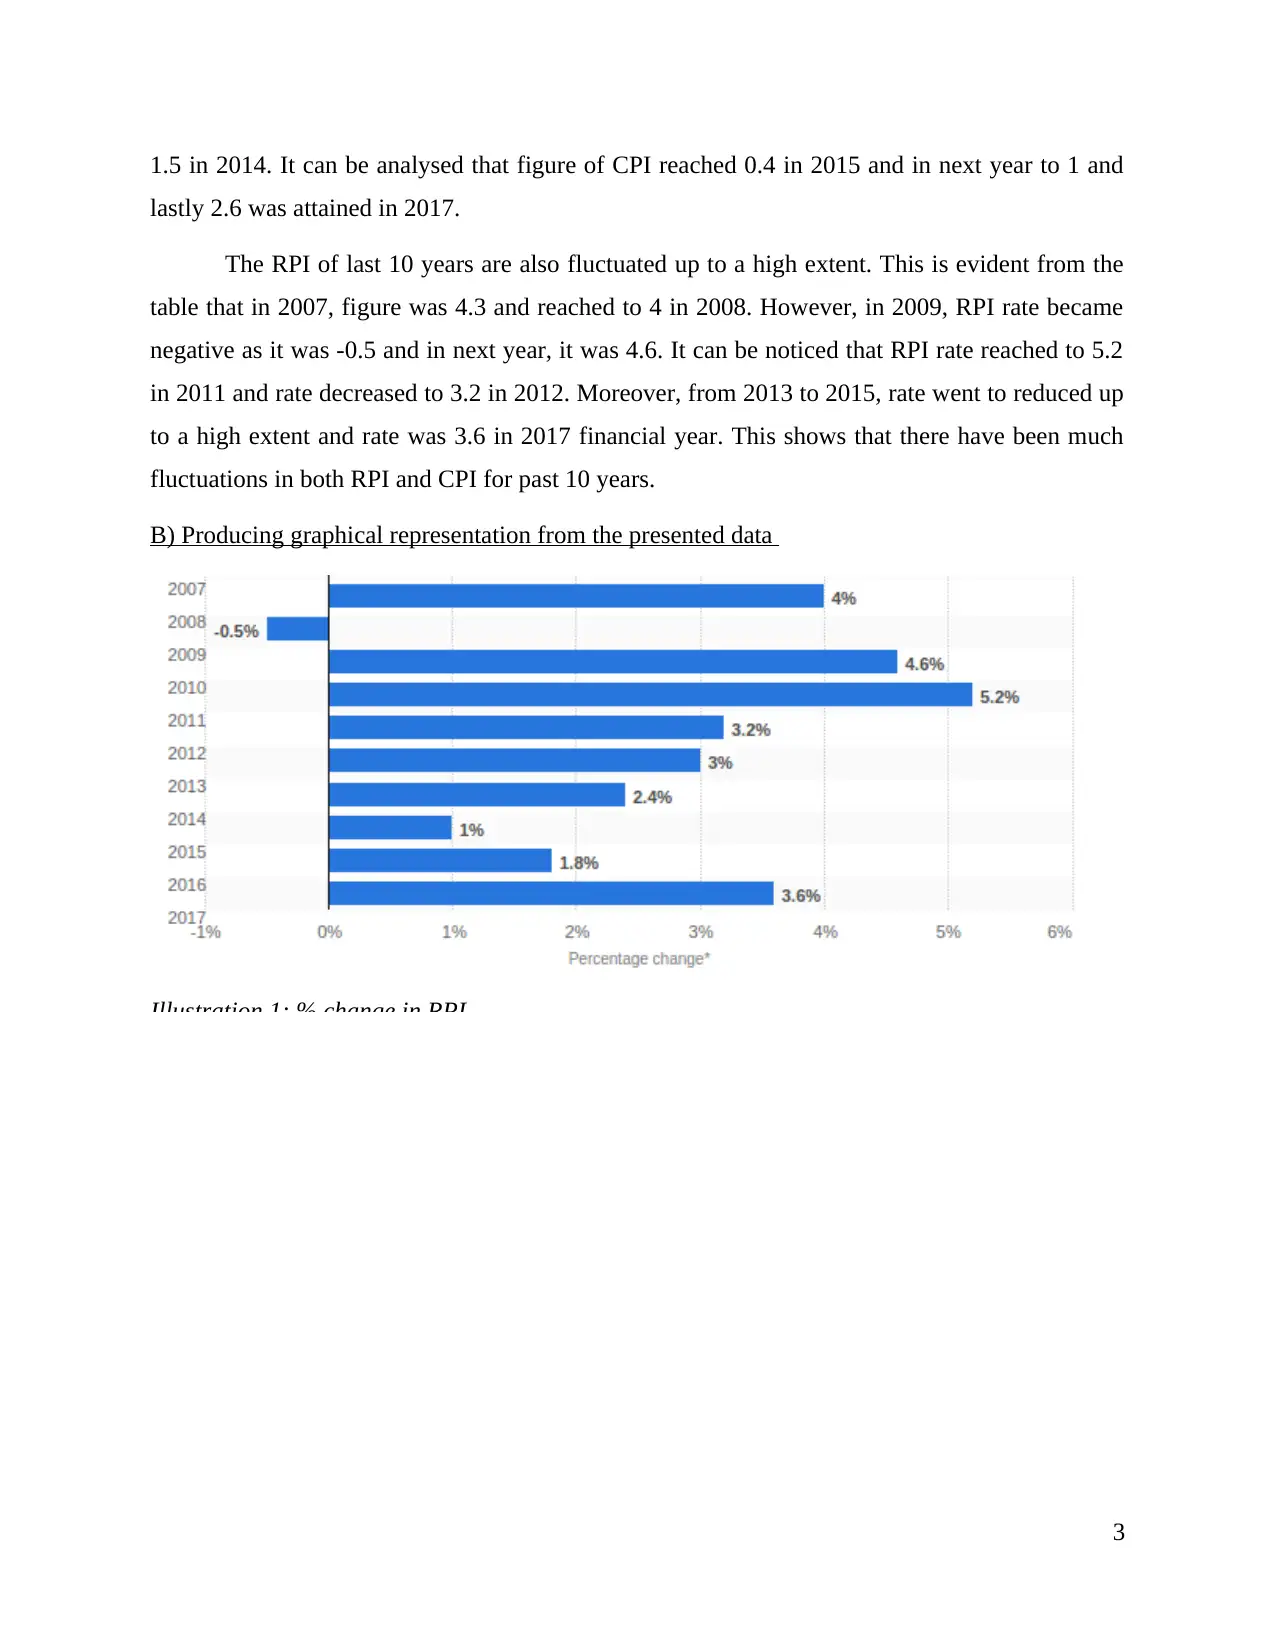
The RPI of last 10 years are also fluctuated up to a high extent. This is evident from the
table that in 2007, figure was 4.3 and reached to 4 in 2008. However, in 2009, RPI rate became
negative as it was -0.5 and in next year, it was 4.6. It can be noticed that RPI rate reached to 5.2
in 2011 and rate decreased to 3.2 in 2012. Moreover, from 2013 to 2015, rate went to reduced up
to a high extent and rate was 3.6 in 2017 financial year. This shows that there have been much
fluctuations in both RPI and CPI for past 10 years.
B) Producing graphical representation from the presented data
Illustration 1: % change in RPI
3
lastly 2.6 was attained in 2017.
The RPI of last 10 years are also fluctuated up to a high extent. This is evident from the
table that in 2007, figure was 4.3 and reached to 4 in 2008. However, in 2009, RPI rate became
negative as it was -0.5 and in next year, it was 4.6. It can be noticed that RPI rate reached to 5.2
in 2011 and rate decreased to 3.2 in 2012. Moreover, from 2013 to 2015, rate went to reduced up
to a high extent and rate was 3.6 in 2017 financial year. This shows that there have been much
fluctuations in both RPI and CPI for past 10 years.
B) Producing graphical representation from the presented data
Illustration 1: % change in RPI
3
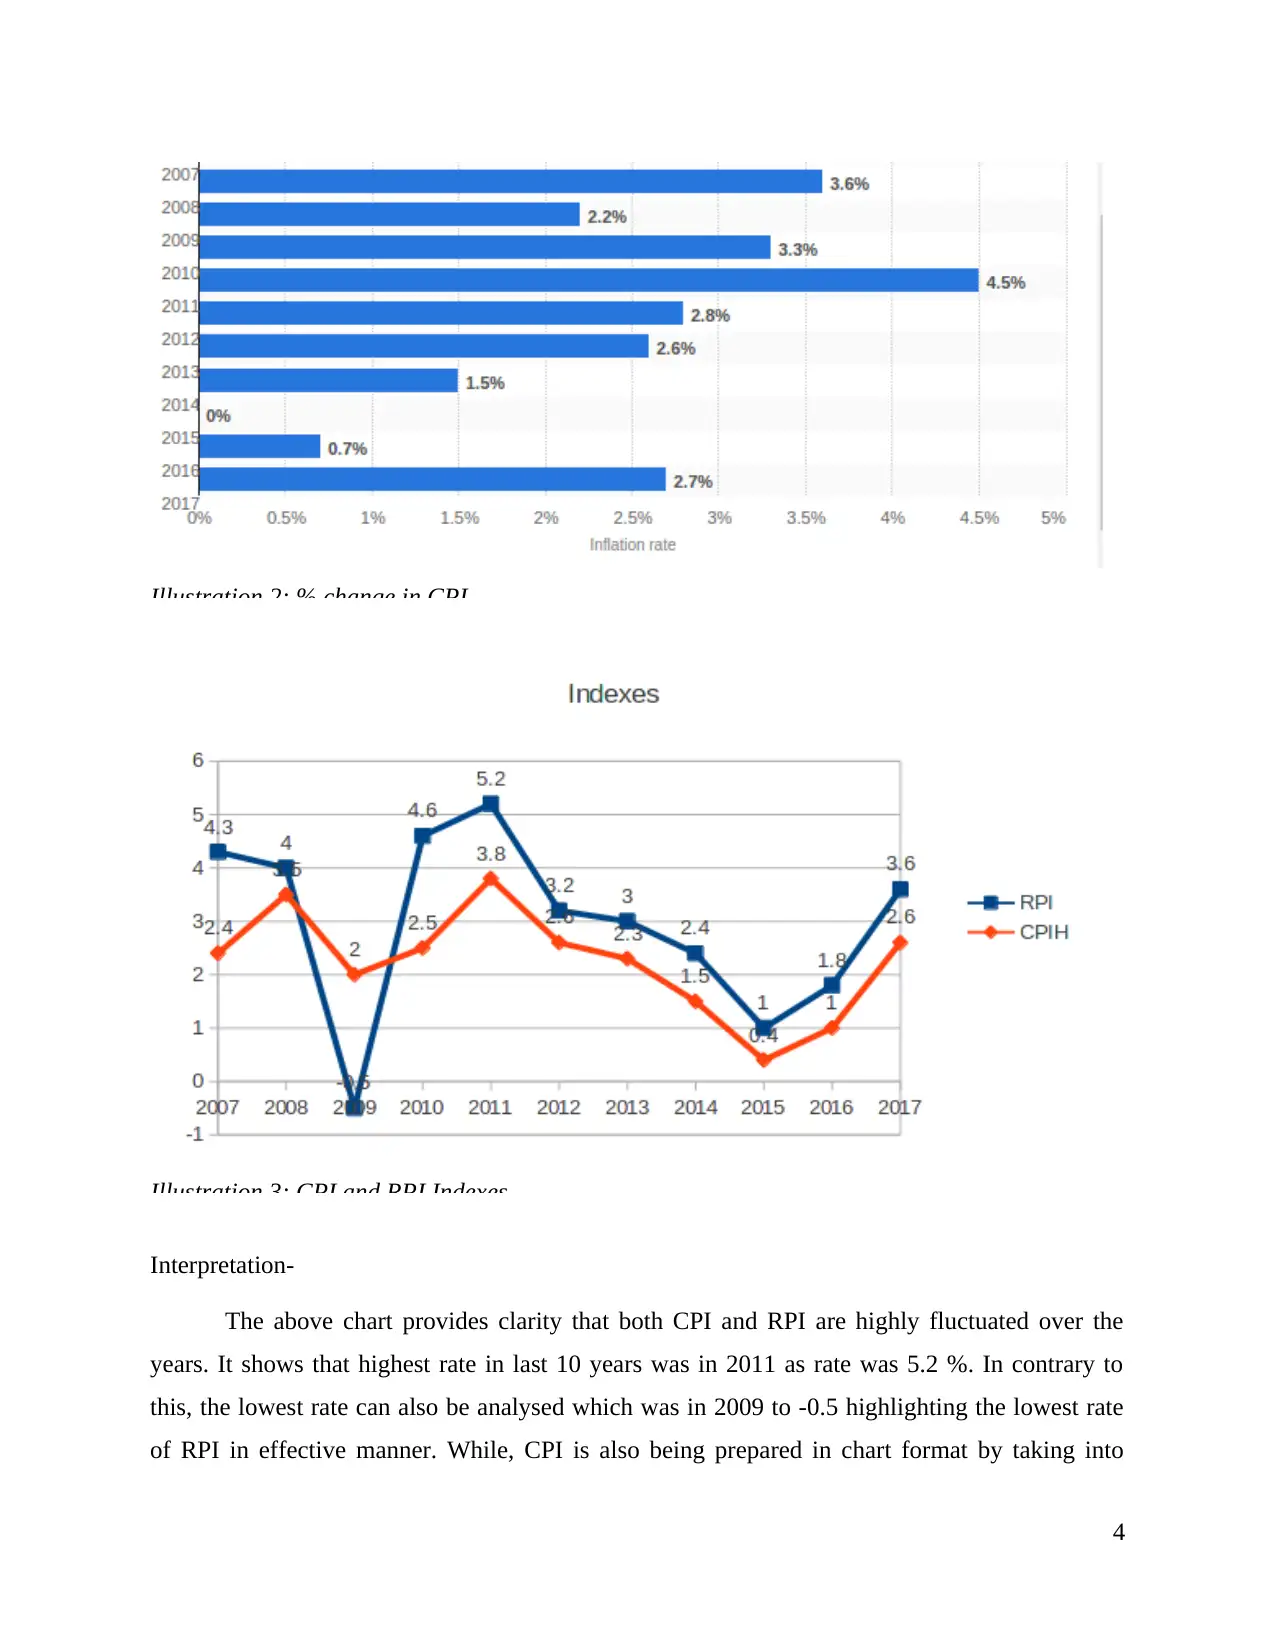
Illustration 2: % change in CPI
Illustration 3: CPI and RPI Indexes
Interpretation-
The above chart provides clarity that both CPI and RPI are highly fluctuated over the
years. It shows that highest rate in last 10 years was in 2011 as rate was 5.2 %. In contrary to
this, the lowest rate can also be analysed which was in 2009 to -0.5 highlighting the lowest rate
of RPI in effective manner. While, CPI is also being prepared in chart format by taking into
4
⊘ This is a preview!⊘
Do you want full access?
Subscribe today to unlock all pages.
Trusted by 1+ million students worldwide
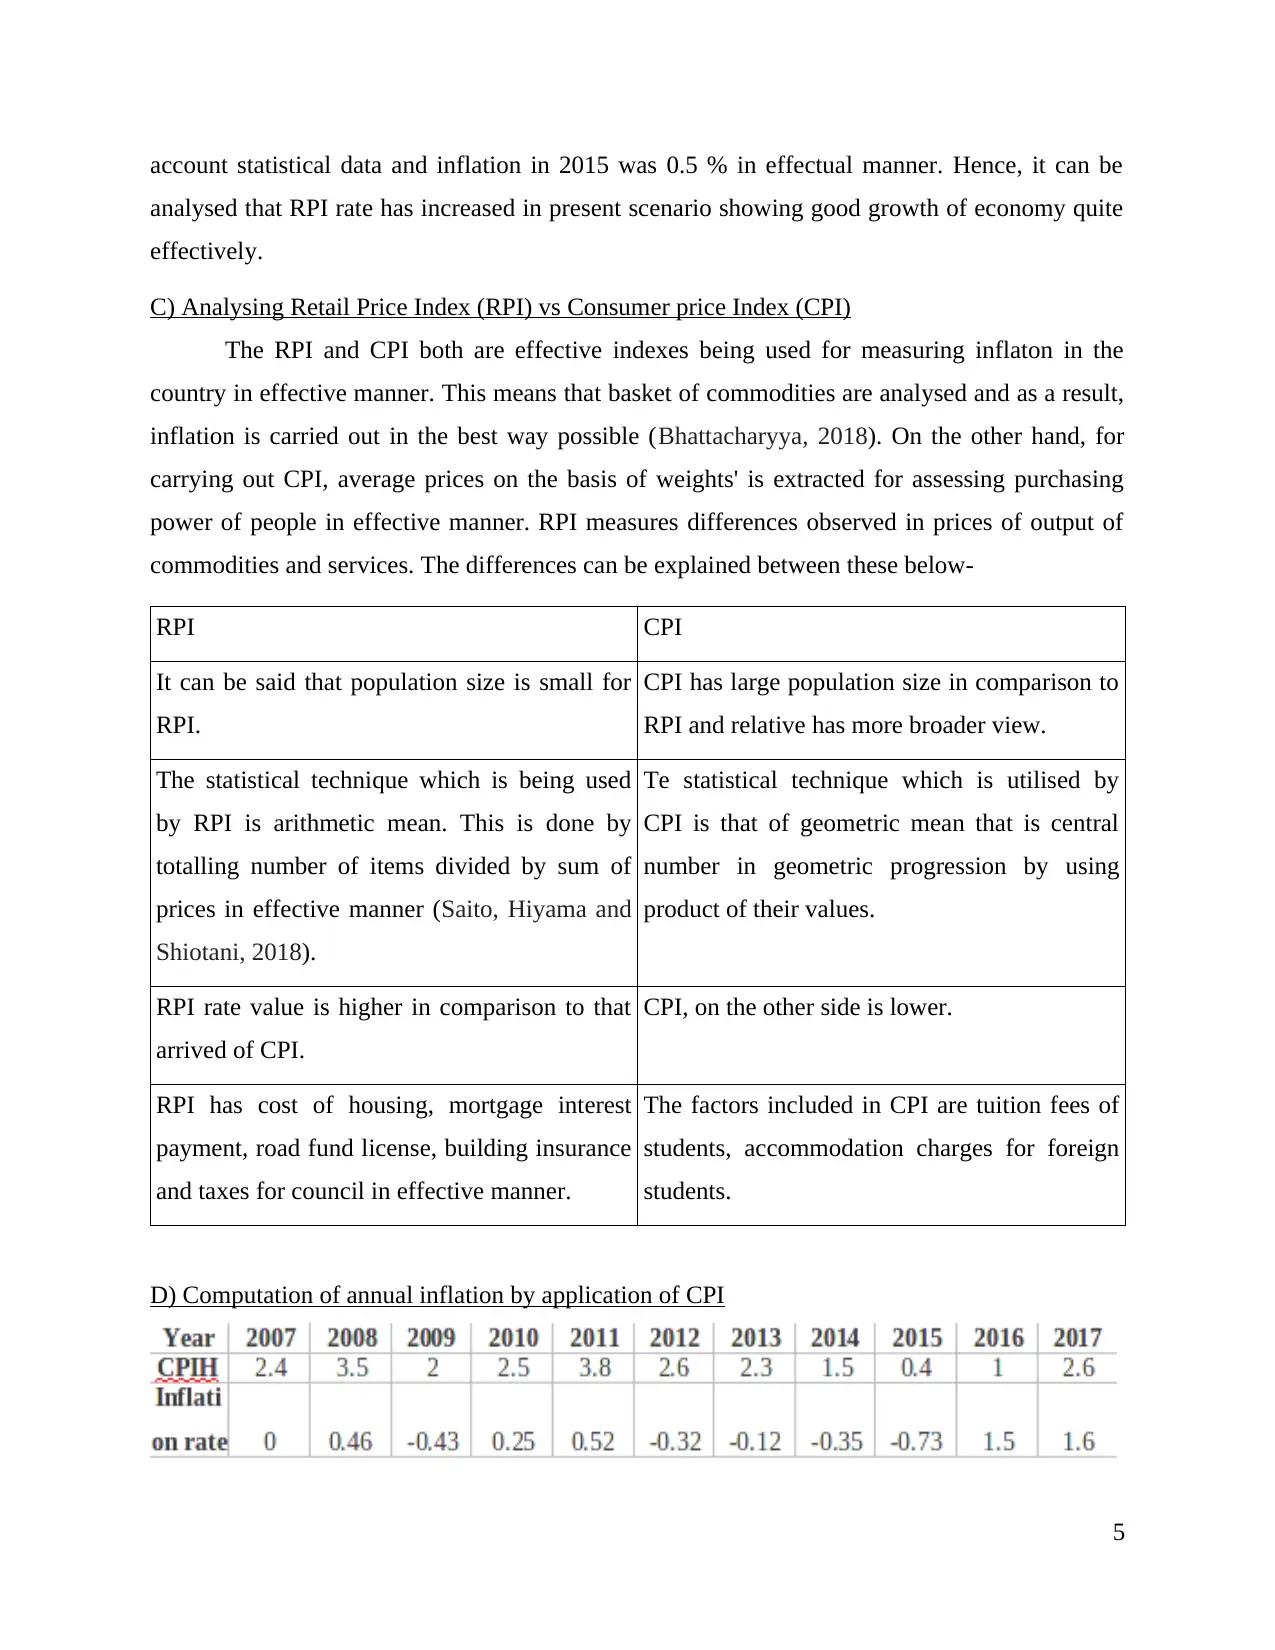
account statistical data and inflation in 2015 was 0.5 % in effectual manner. Hence, it can be
analysed that RPI rate has increased in present scenario showing good growth of economy quite
effectively.
C) Analysing Retail Price Index (RPI) vs Consumer price Index (CPI)
The RPI and CPI both are effective indexes being used for measuring inflaton in the
country in effective manner. This means that basket of commodities are analysed and as a result,
inflation is carried out in the best way possible (Bhattacharyya, 2018). On the other hand, for
carrying out CPI, average prices on the basis of weights' is extracted for assessing purchasing
power of people in effective manner. RPI measures differences observed in prices of output of
commodities and services. The differences can be explained between these below-
RPI CPI
It can be said that population size is small for
RPI.
CPI has large population size in comparison to
RPI and relative has more broader view.
The statistical technique which is being used
by RPI is arithmetic mean. This is done by
totalling number of items divided by sum of
prices in effective manner (Saito, Hiyama and
Shiotani, 2018).
Te statistical technique which is utilised by
CPI is that of geometric mean that is central
number in geometric progression by using
product of their values.
RPI rate value is higher in comparison to that
arrived of CPI.
CPI, on the other side is lower.
RPI has cost of housing, mortgage interest
payment, road fund license, building insurance
and taxes for council in effective manner.
The factors included in CPI are tuition fees of
students, accommodation charges for foreign
students.
D) Computation of annual inflation by application of CPI
5
Paraphrase This Document
Need a fresh take? Get an instant paraphrase of this document with our AI Paraphraser
Interpretation-
It can be interpreted from above table that annual inflation rate has been calculated from
the data of last 10 years of RPI and CPI in effective manner. It shows that payment results are
termed as inappropriate as inflation rate is minimising in terms of negative inflation which falls
within the period of 2012-2015 in effective manner. The figure was -0.32 in 2012 which reached
to -0.12 in 2013 and further it was -0.35 in next year and leading to maximise to -0.73 in 2015.
This shows that fluctuations in terms of inflation rate has changed up to a major extent. On the
other side, RPI has also fluctuated over the years. It can be said that rising inflation i.e. in
positive value is not good for economy as it will have direct impact on purchasing power of
people and high price of goods will not be bought by it. This will also lead to financial instability
in economy.
E) Importance of inflation rate in the economy
Inflation in general term means sudden increase in general price level of goods and
services in the economy. Moreover, it can be analysed that increment in general prices and
reason behind change is associated which is required for economy for controlling prices and as a
result, measures are taken for reducing prices. On the other hand, it can be analysed that increase
in inflation causes reduction in purchasing power of people and as a result, economy is impacted
up to a high extent (Lai, Zhu and Williams, 2017). Moreover, high rate of inflation leads to
divestment as following reasons are listed-
Uncertainties in behaviour-
The increasing rate of inflation leads to more volatility in prices and as such, uncertain
behaviour of price and cost in the future course of action prevails. It has a direct impact as
divestment in economy leads to instability in financial and economical way and demand of goods
minimises as well.
Uncertain inflation situation-
The deflationary fiscal policy plays crucial role and inappropriate adjustments made
directly leads to elevation in interest rate of economy. Hence, inflationary situations in the
country will maximise up to major extent (Carroll and White, 2017).
6
It can be analysed that inflation is highly significant in the country as all borrowings and
lending are redirected to people and spending level or purchasing power of people of UK will be
enhanced in a better way when inflation gets controlled.
ACTIVITY 2
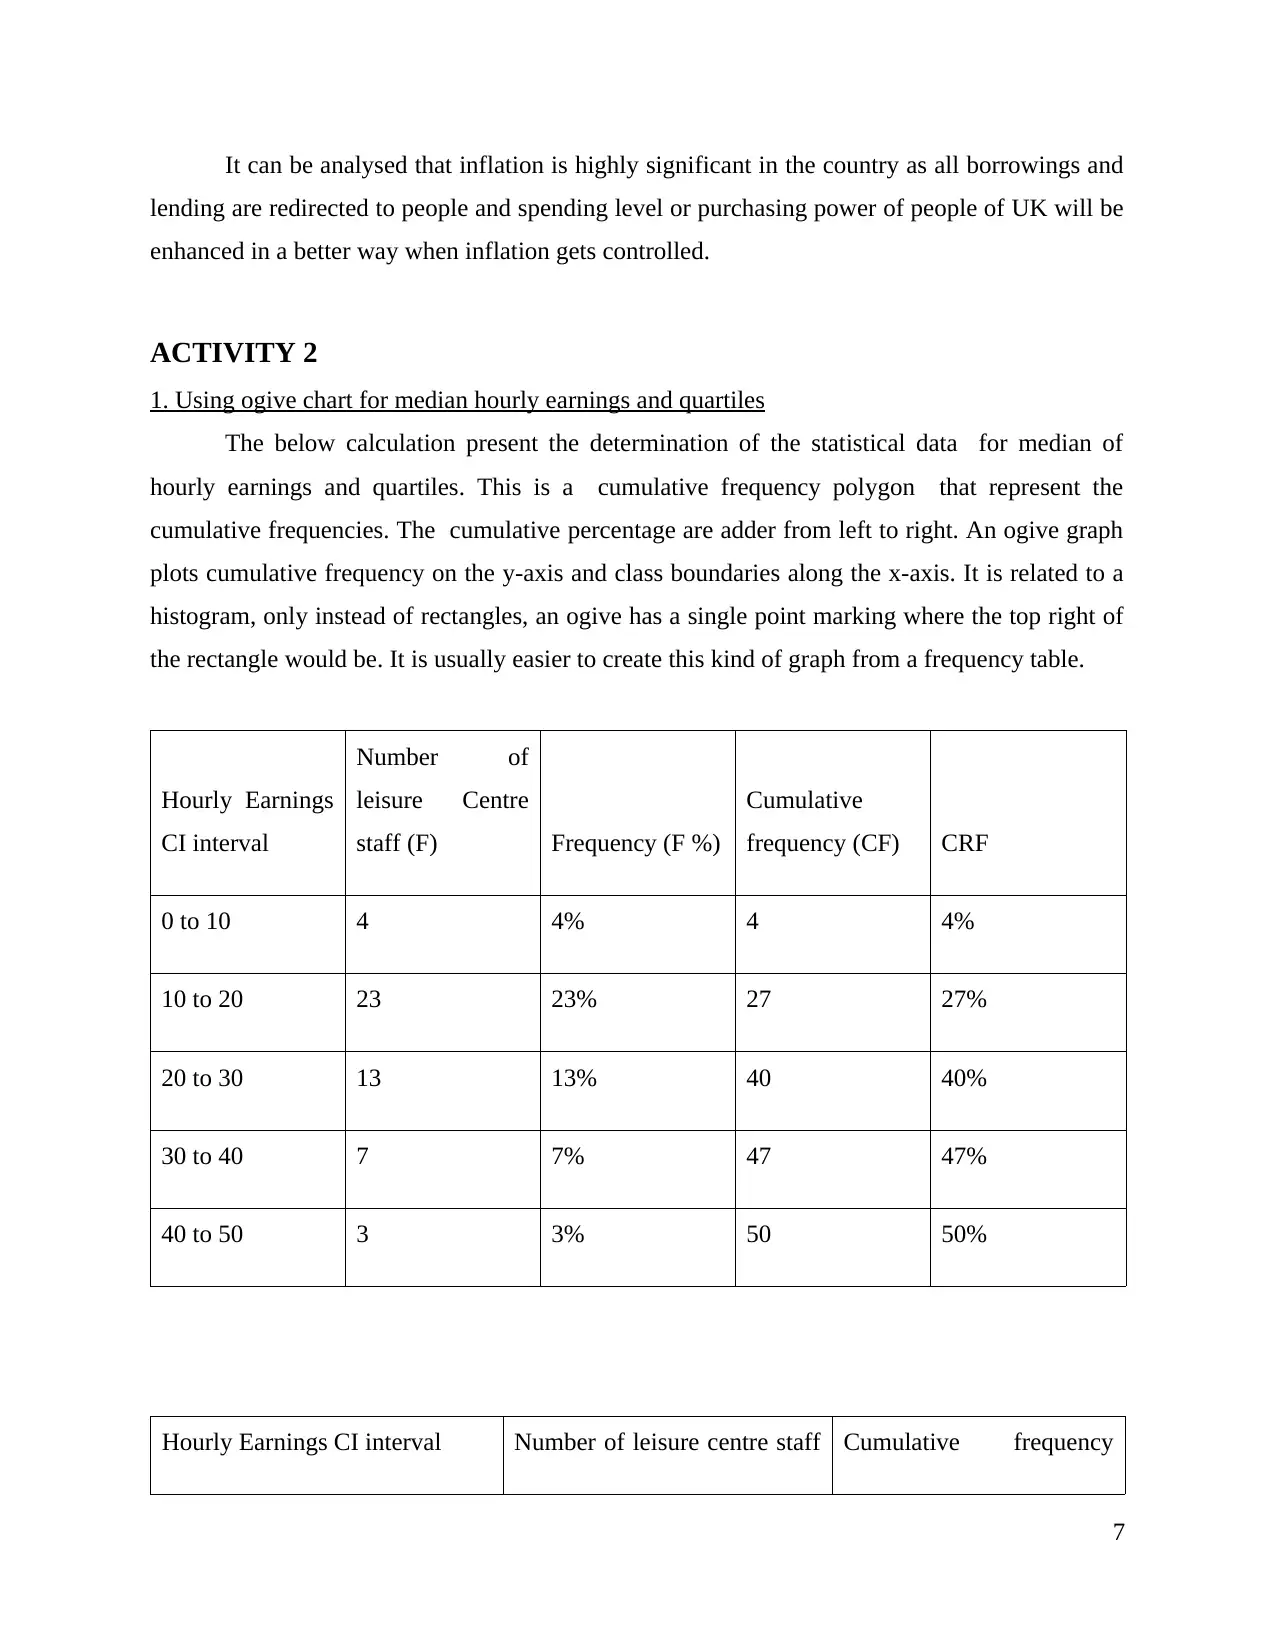
1. Using ogive chart for median hourly earnings and quartiles
The below calculation present the determination of the statistical data for median of
hourly earnings and quartiles. This is a cumulative frequency polygon that represent the
cumulative frequencies. The cumulative percentage are adder from left to right. An ogive graph
plots cumulative frequency on the y-axis and class boundaries along the x-axis. It is related to a
histogram, only instead of rectangles, an ogive has a single point marking where the top right of
the rectangle would be. It is usually easier to create this kind of graph from a frequency table.
Hourly Earnings
CI interval
Number of
leisure Centre
staff (F) Frequency (F %)
Cumulative
frequency (CF) CRF
0 to 10 4 4% 4 4%
10 to 20 23 23% 27 27%
20 to 30 13 13% 40 40%
30 to 40 7 7% 47 47%
40 to 50 3 3% 50 50%
Hourly Earnings CI interval Number of leisure centre staff Cumulative frequency
7
lending are redirected to people and spending level or purchasing power of people of UK will be
enhanced in a better way when inflation gets controlled.
ACTIVITY 2
1. Using ogive chart for median hourly earnings and quartiles
The below calculation present the determination of the statistical data for median of
hourly earnings and quartiles. This is a cumulative frequency polygon that represent the
cumulative frequencies. The cumulative percentage are adder from left to right. An ogive graph
plots cumulative frequency on the y-axis and class boundaries along the x-axis. It is related to a
histogram, only instead of rectangles, an ogive has a single point marking where the top right of
the rectangle would be. It is usually easier to create this kind of graph from a frequency table.
Hourly Earnings
CI interval
Number of
leisure Centre
staff (F) Frequency (F %)
Cumulative
frequency (CF) CRF
0 to 10 4 4% 4 4%
10 to 20 23 23% 27 27%
20 to 30 13 13% 40 40%
30 to 40 7 7% 47 47%
40 to 50 3 3% 50 50%
Hourly Earnings CI interval Number of leisure centre staff Cumulative frequency
7
⊘ This is a preview!⊘
Do you want full access?
Subscribe today to unlock all pages.
Trusted by 1+ million students worldwide
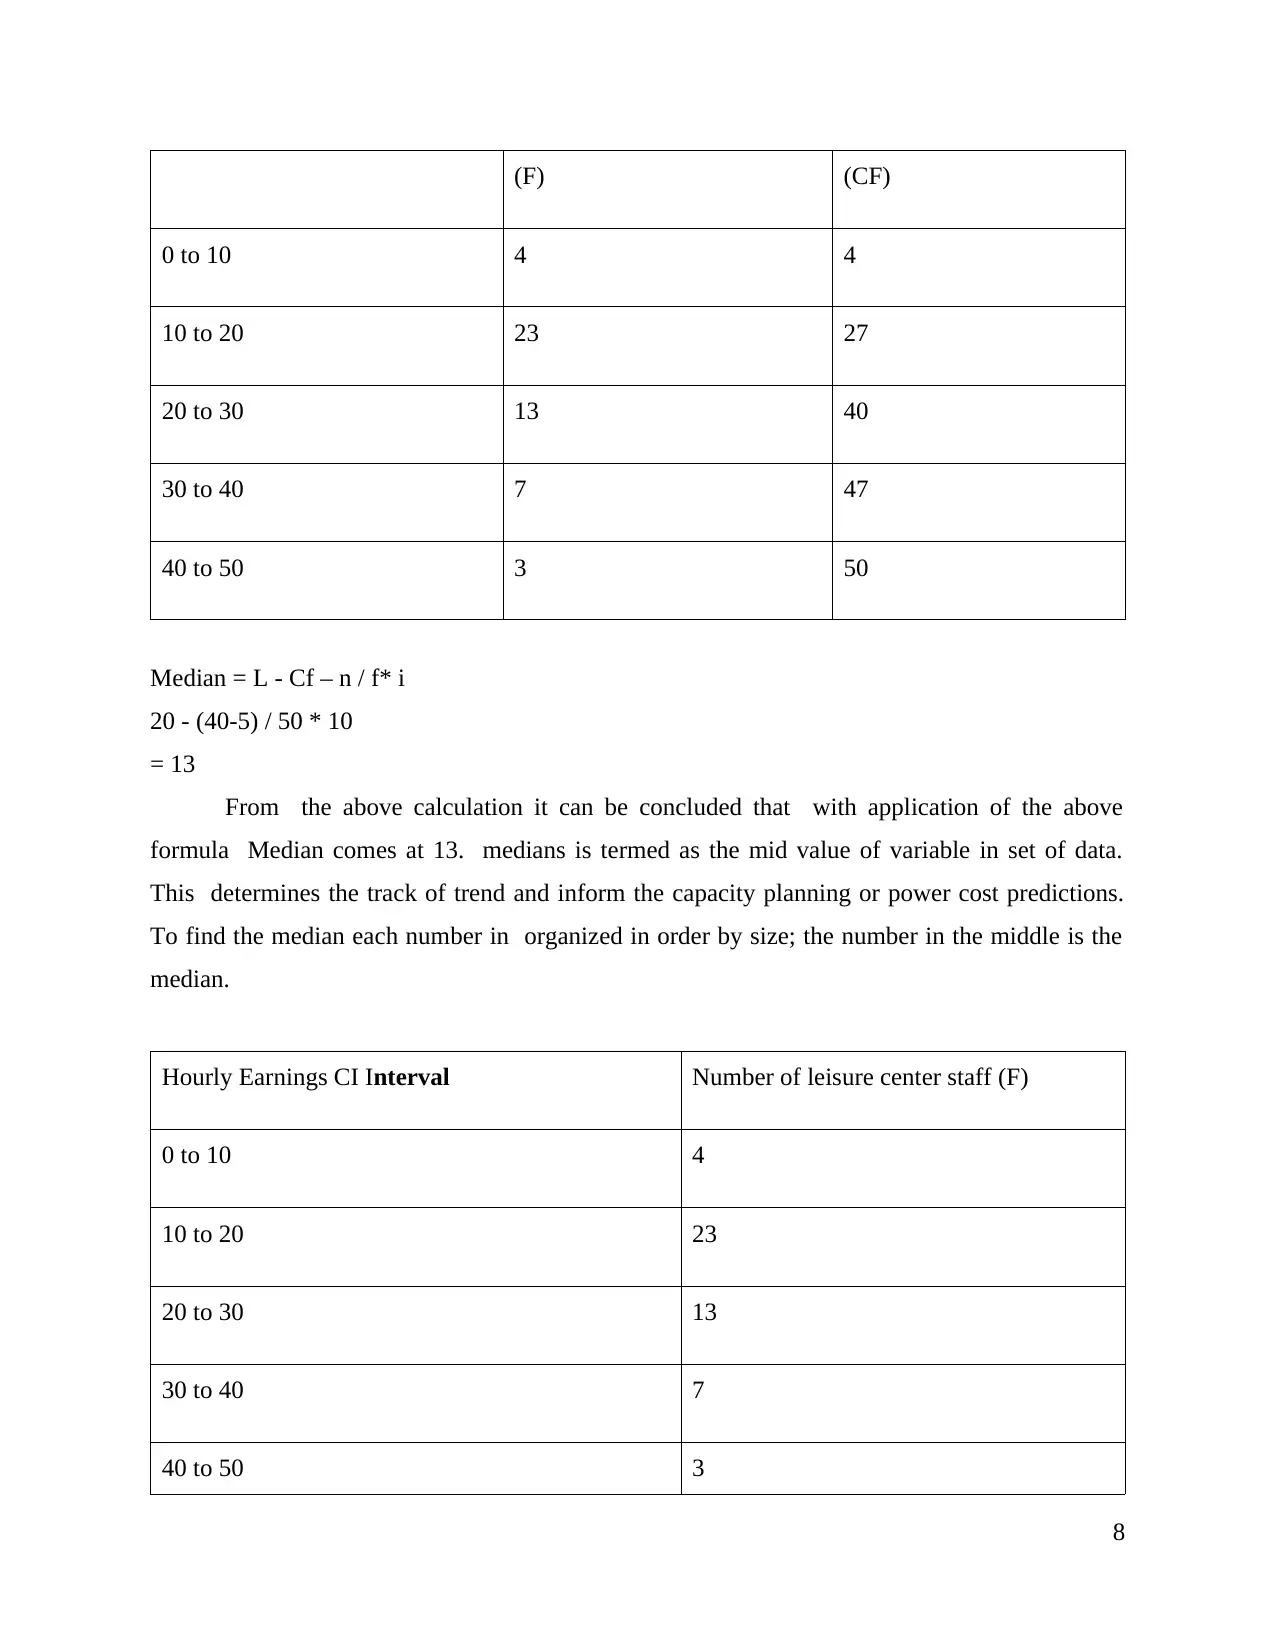
(F) (CF)
0 to 10 4 4
10 to 20 23 27
20 to 30 13 40
30 to 40 7 47
40 to 50 3 50
Median = L - Cf – n / f* i
20 - (40-5) / 50 * 10
= 13
From the above calculation it can be concluded that with application of the above
formula Median comes at 13. medians is termed as the mid value of variable in set of data.
This determines the track of trend and inform the capacity planning or power cost predictions.
To find the median each number in organized in order by size; the number in the middle is the
median.
Hourly Earnings CI Interval Number of leisure center staff (F)
0 to 10 4
10 to 20 23
20 to 30 13
30 to 40 7
40 to 50 3
8
Paraphrase This Document
Need a fresh take? Get an instant paraphrase of this document with our AI Paraphraser
Particulars Figures
Quartile 1 3
Quartile 2 3
Quartile 3 3
Interpretation: From the above report it can be interpreted that median and quartiles
with reference to ogive chart where median is calculated as 13. which come in the range of
cumulative frequency of 10-20. all three quartiles are calculated at the same range of 3. This is
statistical term which helps in giving description with multipole provisions on its observations in
different interval.
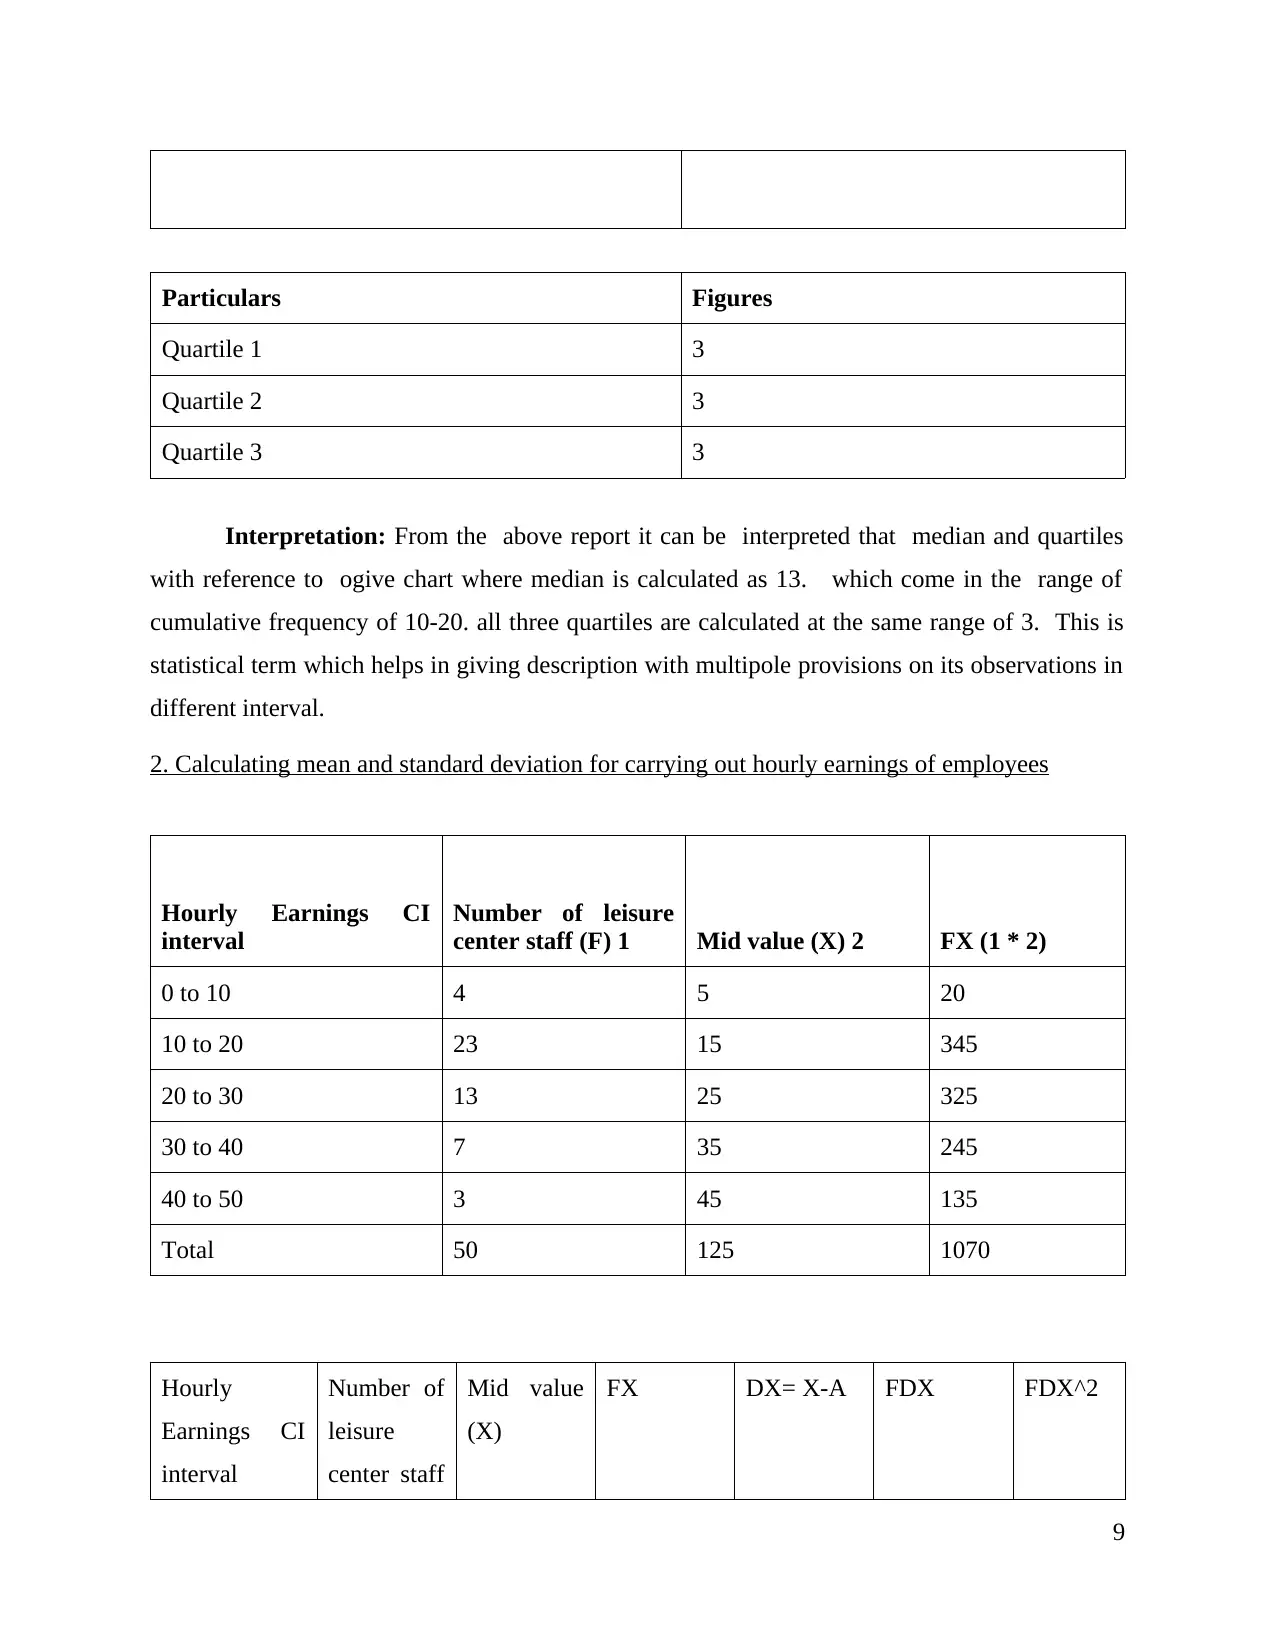
2. Calculating mean and standard deviation for carrying out hourly earnings of employees
Hourly Earnings CI
interval
Number of leisure
center staff (F) 1 Mid value (X) 2 FX (1 * 2)
0 to 10 4 5 20
10 to 20 23 15 345
20 to 30 13 25 325
30 to 40 7 35 245
40 to 50 3 45 135
Total 50 125 1070
Hourly
Earnings CI
interval
Number of
leisure
center staff
Mid value
(X)
FX DX= X-A FDX FDX^2
9
Quartile 1 3
Quartile 2 3
Quartile 3 3
Interpretation: From the above report it can be interpreted that median and quartiles
with reference to ogive chart where median is calculated as 13. which come in the range of
cumulative frequency of 10-20. all three quartiles are calculated at the same range of 3. This is
statistical term which helps in giving description with multipole provisions on its observations in
different interval.
2. Calculating mean and standard deviation for carrying out hourly earnings of employees
Hourly Earnings CI
interval
Number of leisure
center staff (F) 1 Mid value (X) 2 FX (1 * 2)
0 to 10 4 5 20
10 to 20 23 15 345
20 to 30 13 25 325
30 to 40 7 35 245
40 to 50 3 45 135
Total 50 125 1070
Hourly
Earnings CI
interval
Number of
leisure
center staff
Mid value
(X)
FX DX= X-A FDX FDX^2
9
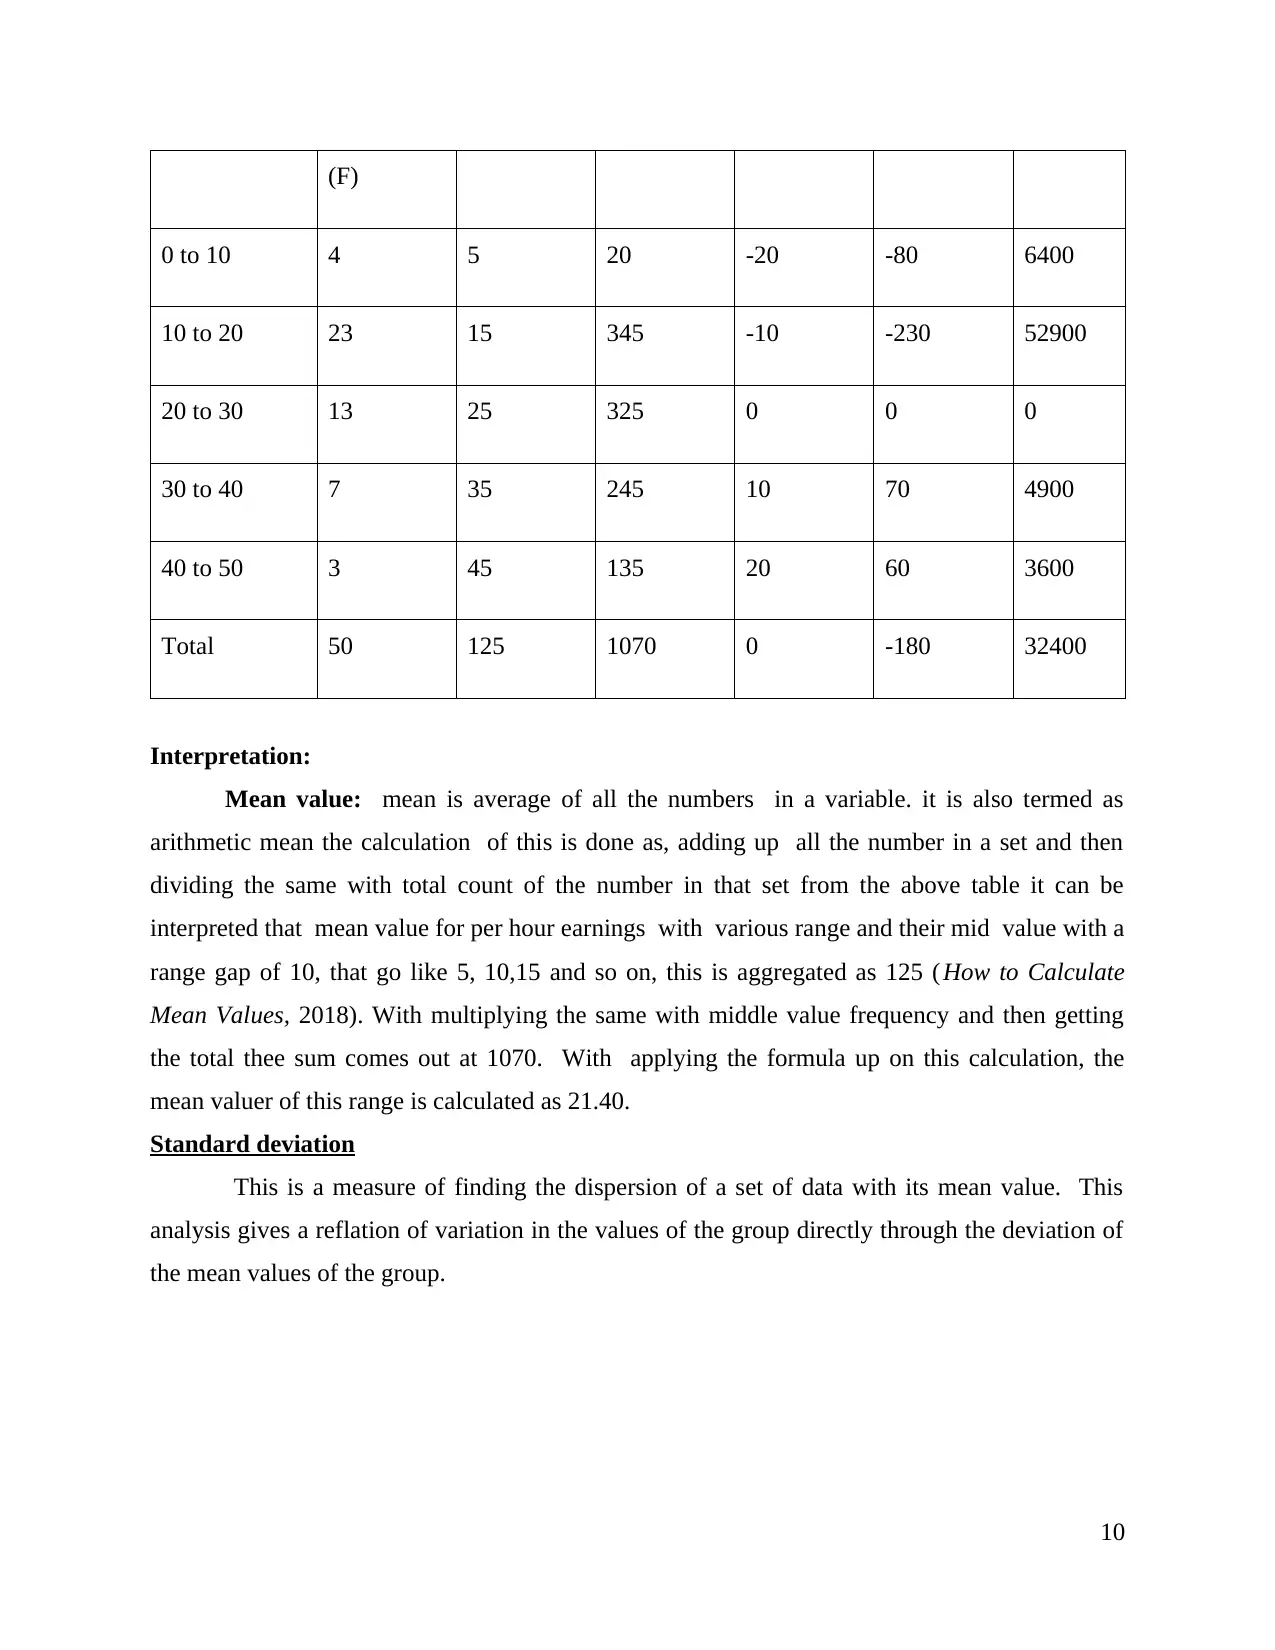
(F)
0 to 10 4 5 20 -20 -80 6400
10 to 20 23 15 345 -10 -230 52900
20 to 30 13 25 325 0 0 0
30 to 40 7 35 245 10 70 4900
40 to 50 3 45 135 20 60 3600
Total 50 125 1070 0 -180 32400
Interpretation:
Mean value: mean is average of all the numbers in a variable. it is also termed as
arithmetic mean the calculation of this is done as, adding up all the number in a set and then
dividing the same with total count of the number in that set from the above table it can be
interpreted that mean value for per hour earnings with various range and their mid value with a
range gap of 10, that go like 5, 10,15 and so on, this is aggregated as 125 ( How to Calculate
Mean Values, 2018). With multiplying the same with middle value frequency and then getting
the total thee sum comes out at 1070. With applying the formula up on this calculation, the
mean valuer of this range is calculated as 21.40.
Standard deviation
This is a measure of finding the dispersion of a set of data with its mean value. This
analysis gives a reflation of variation in the values of the group directly through the deviation of
the mean values of the group.
10
⊘ This is a preview!⊘
Do you want full access?
Subscribe today to unlock all pages.
Trusted by 1+ million students worldwide
1 out of 20
Related Documents


Your All-in-One AI-Powered Toolkit for Academic Success.
+13062052269
info@desklib.com
Available 24*7 on WhatsApp / Email
![[object Object]](/_next/static/media/star-bottom.7253800d.svg)
Unlock your academic potential
Copyright © 2020–2026 A2Z Services. All Rights Reserved. Developed and managed by ZUCOL.