Statistics for Management: Public, Private Sector & Inventory Report

Verified

Added on  2020/11/12

|17
|2799
|454
Report
AI Summary
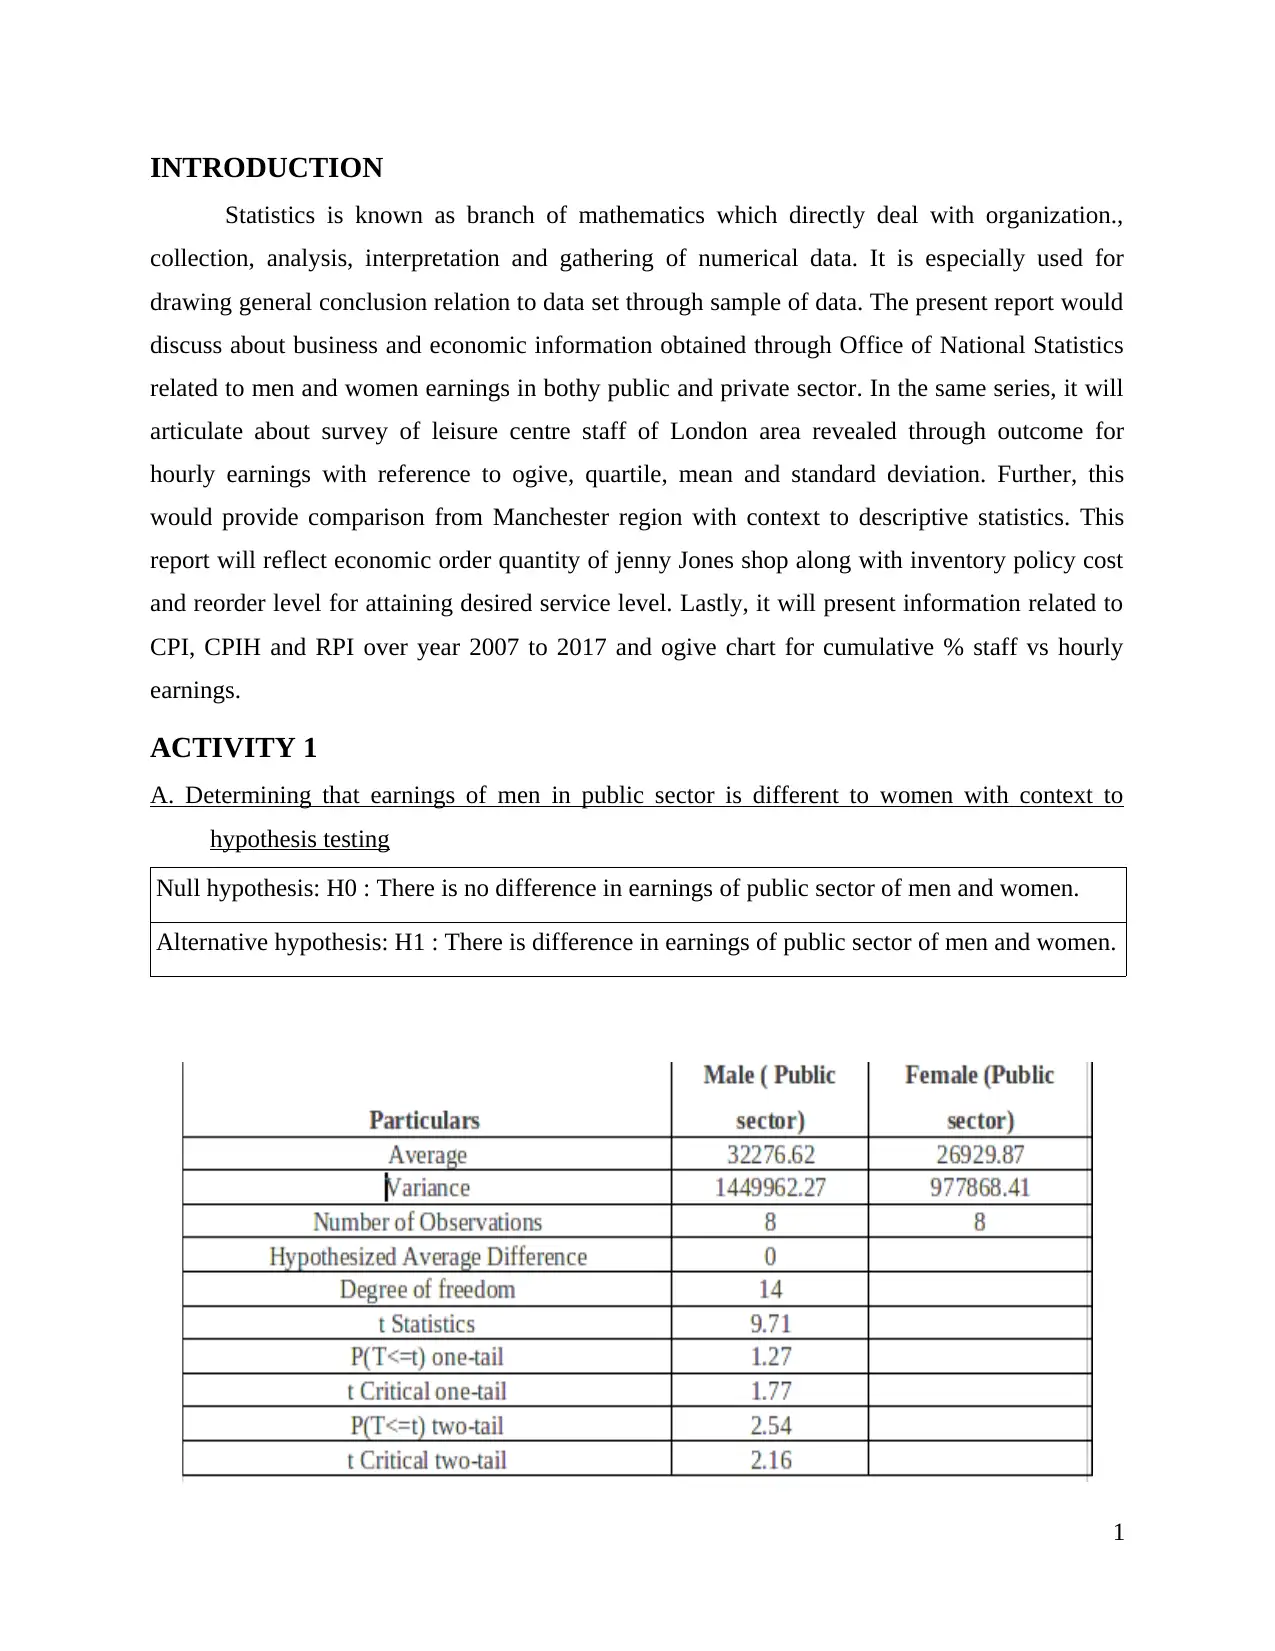
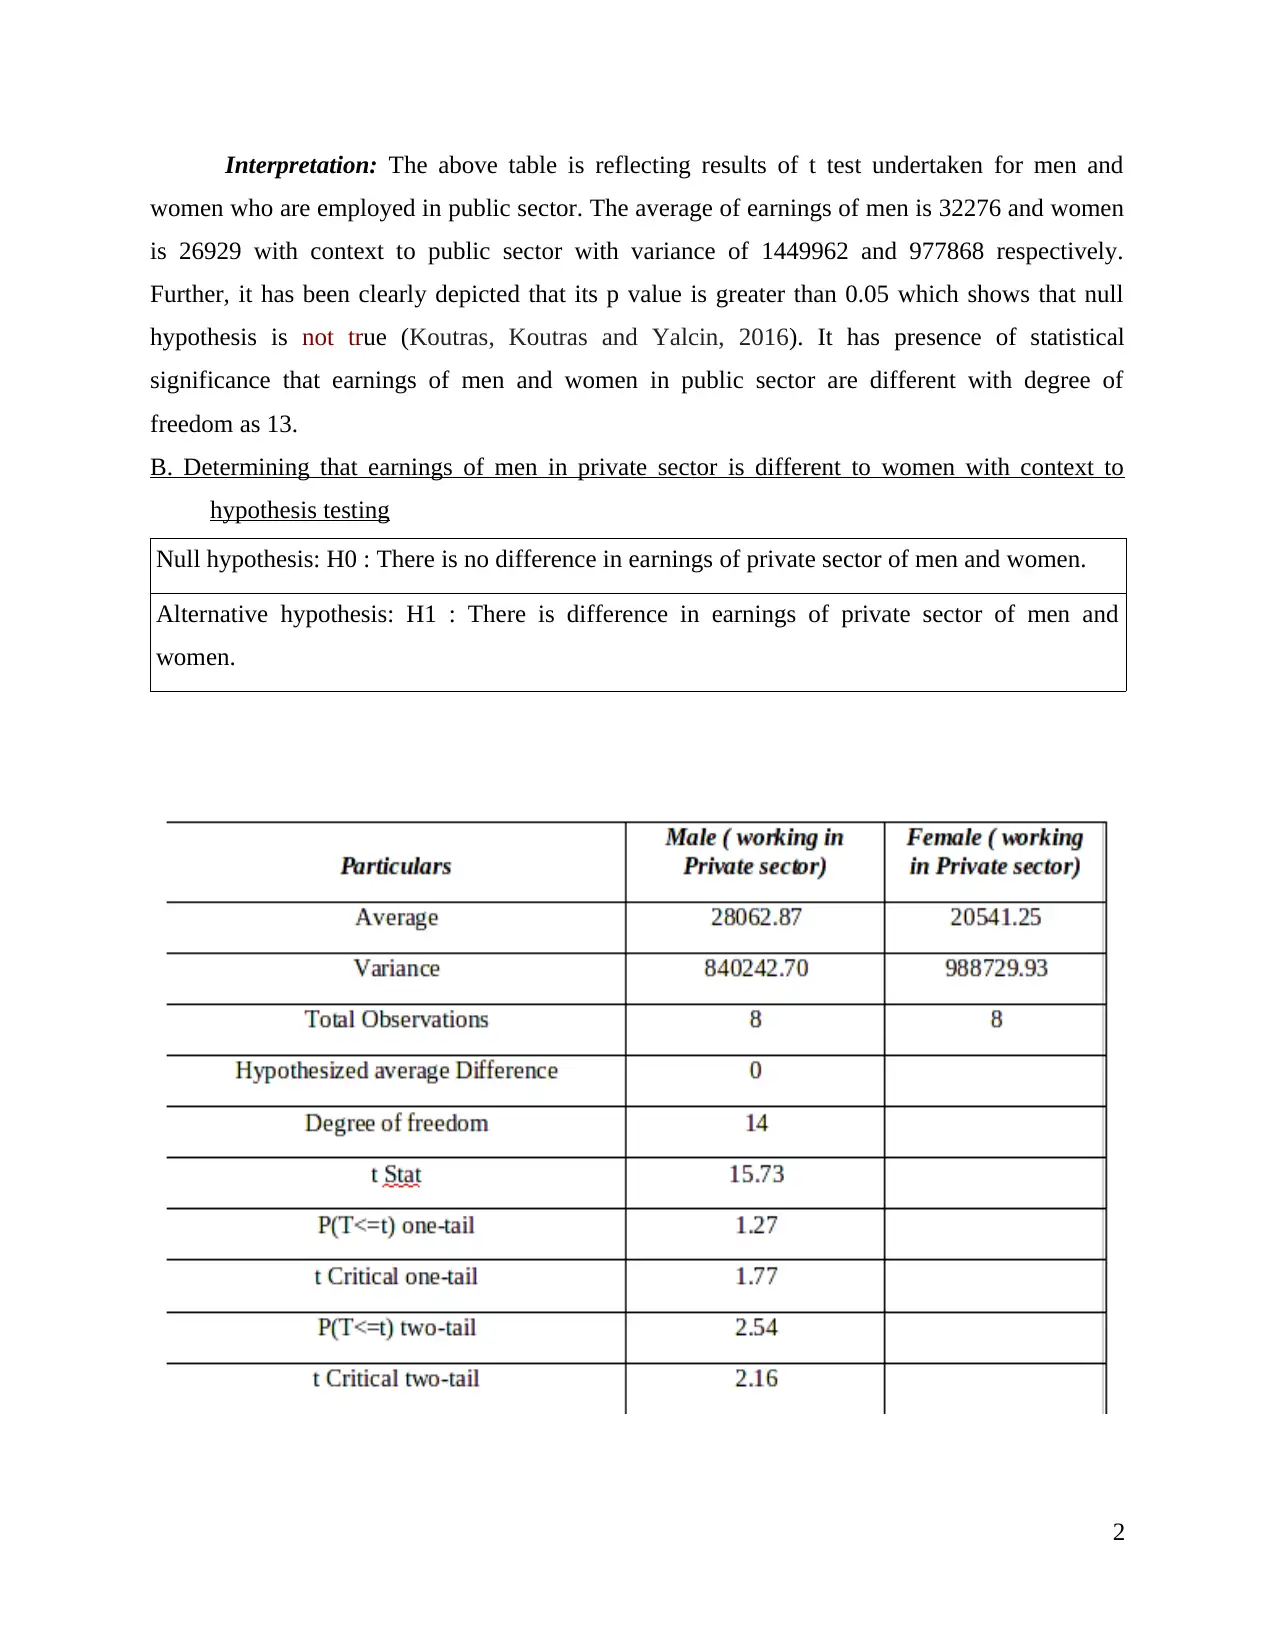
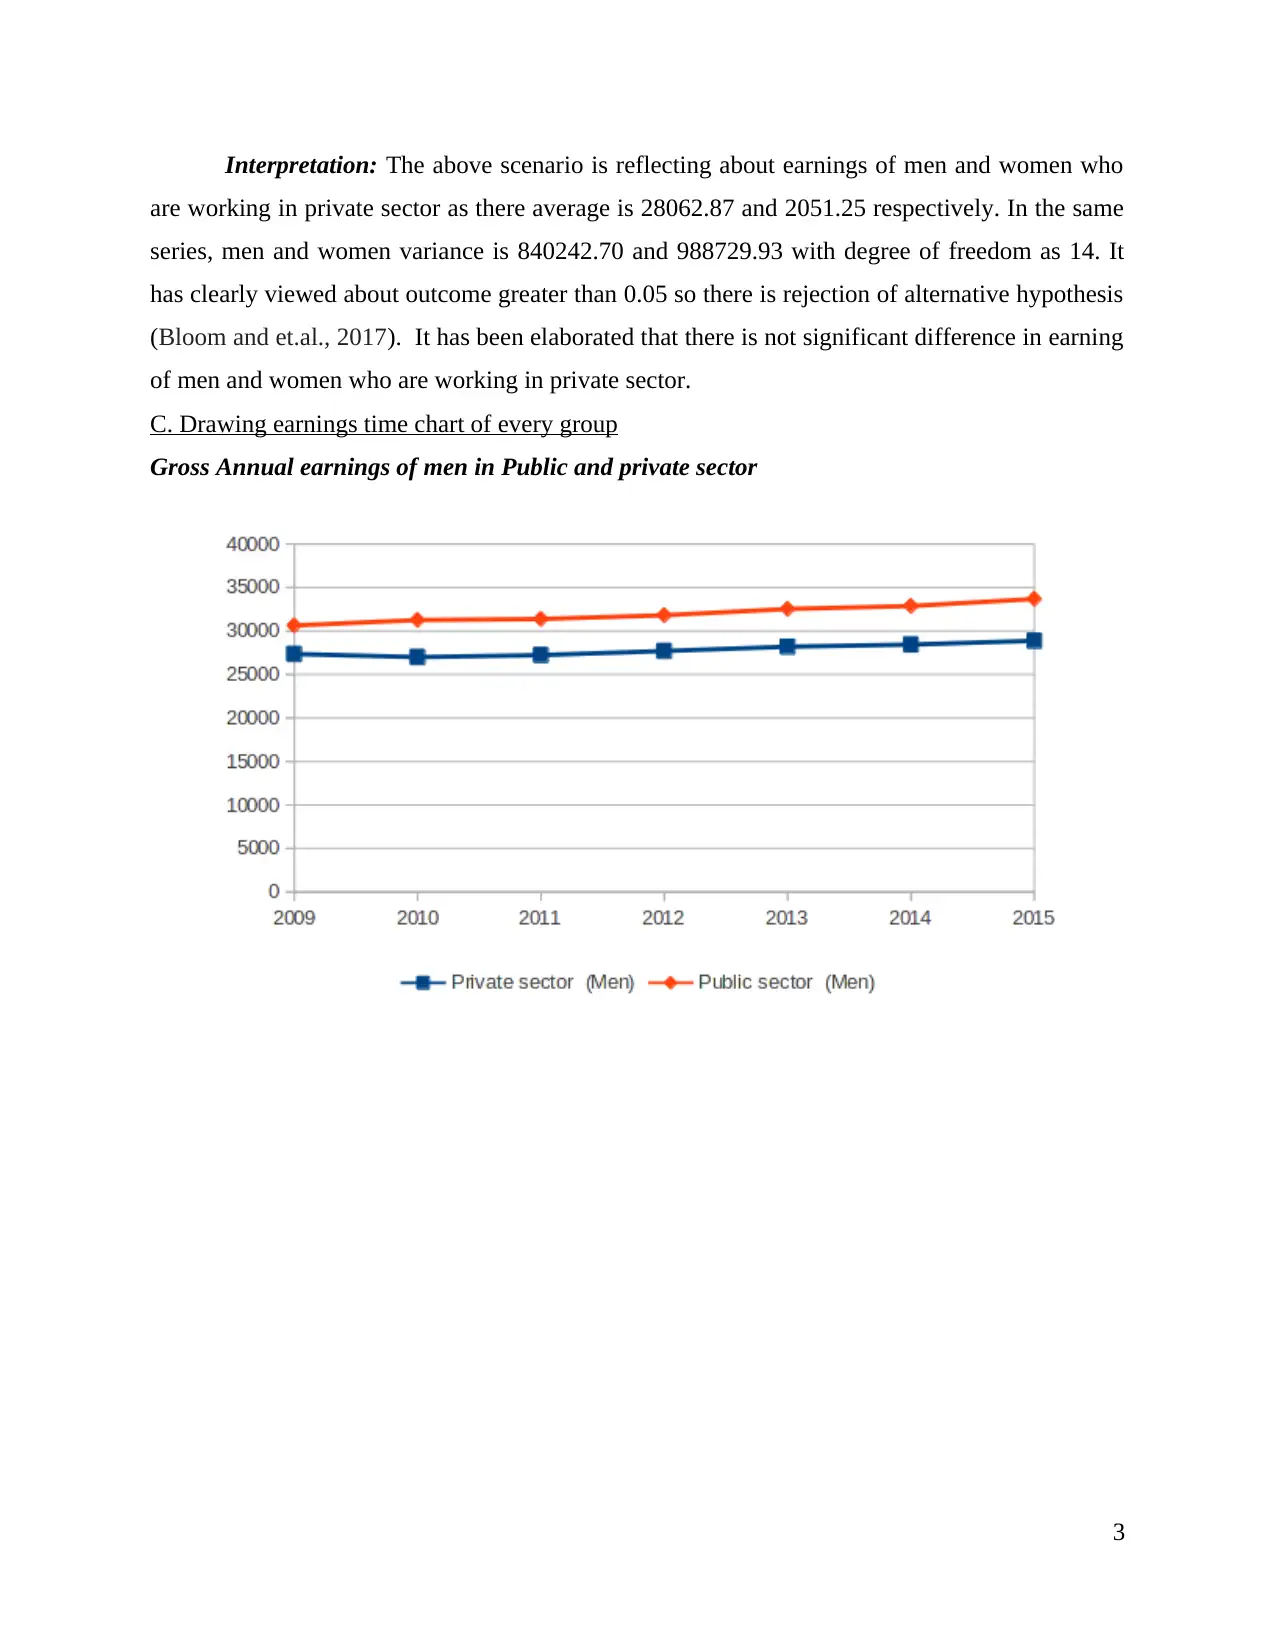
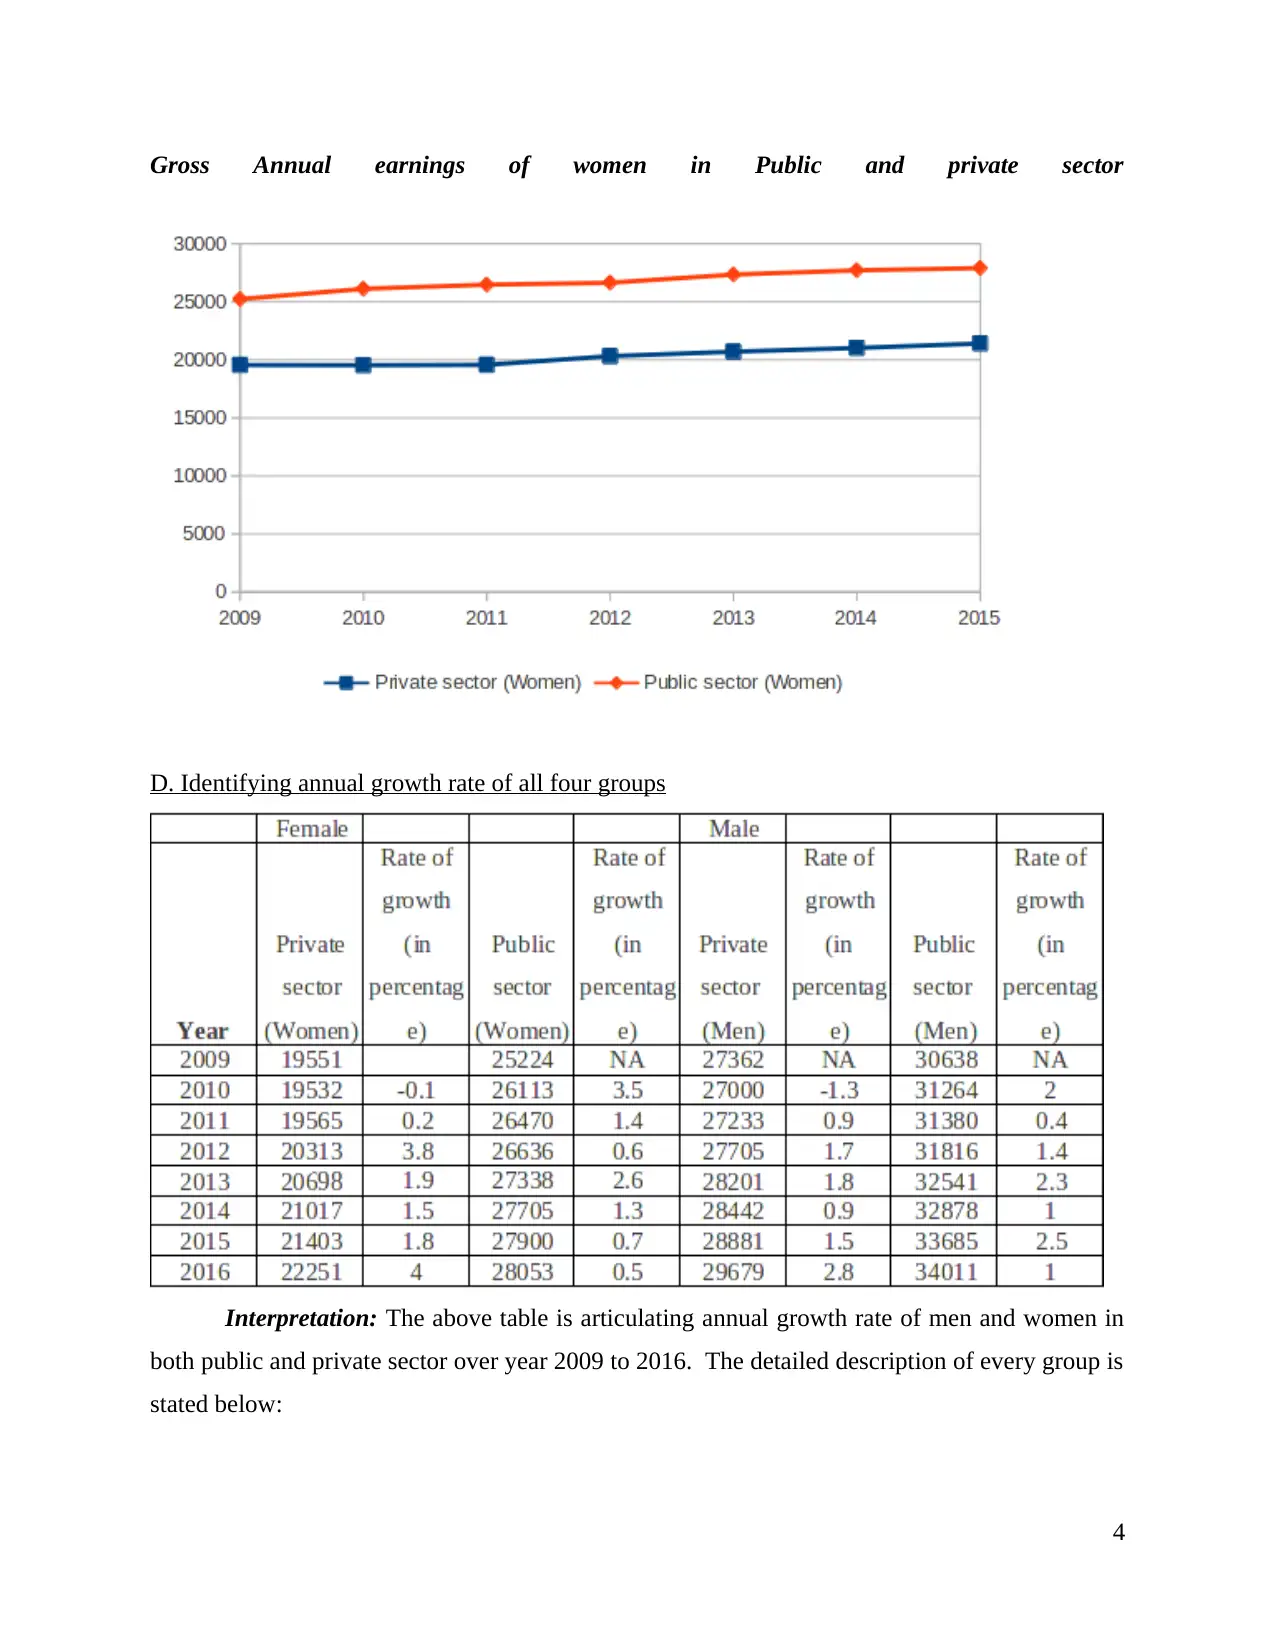
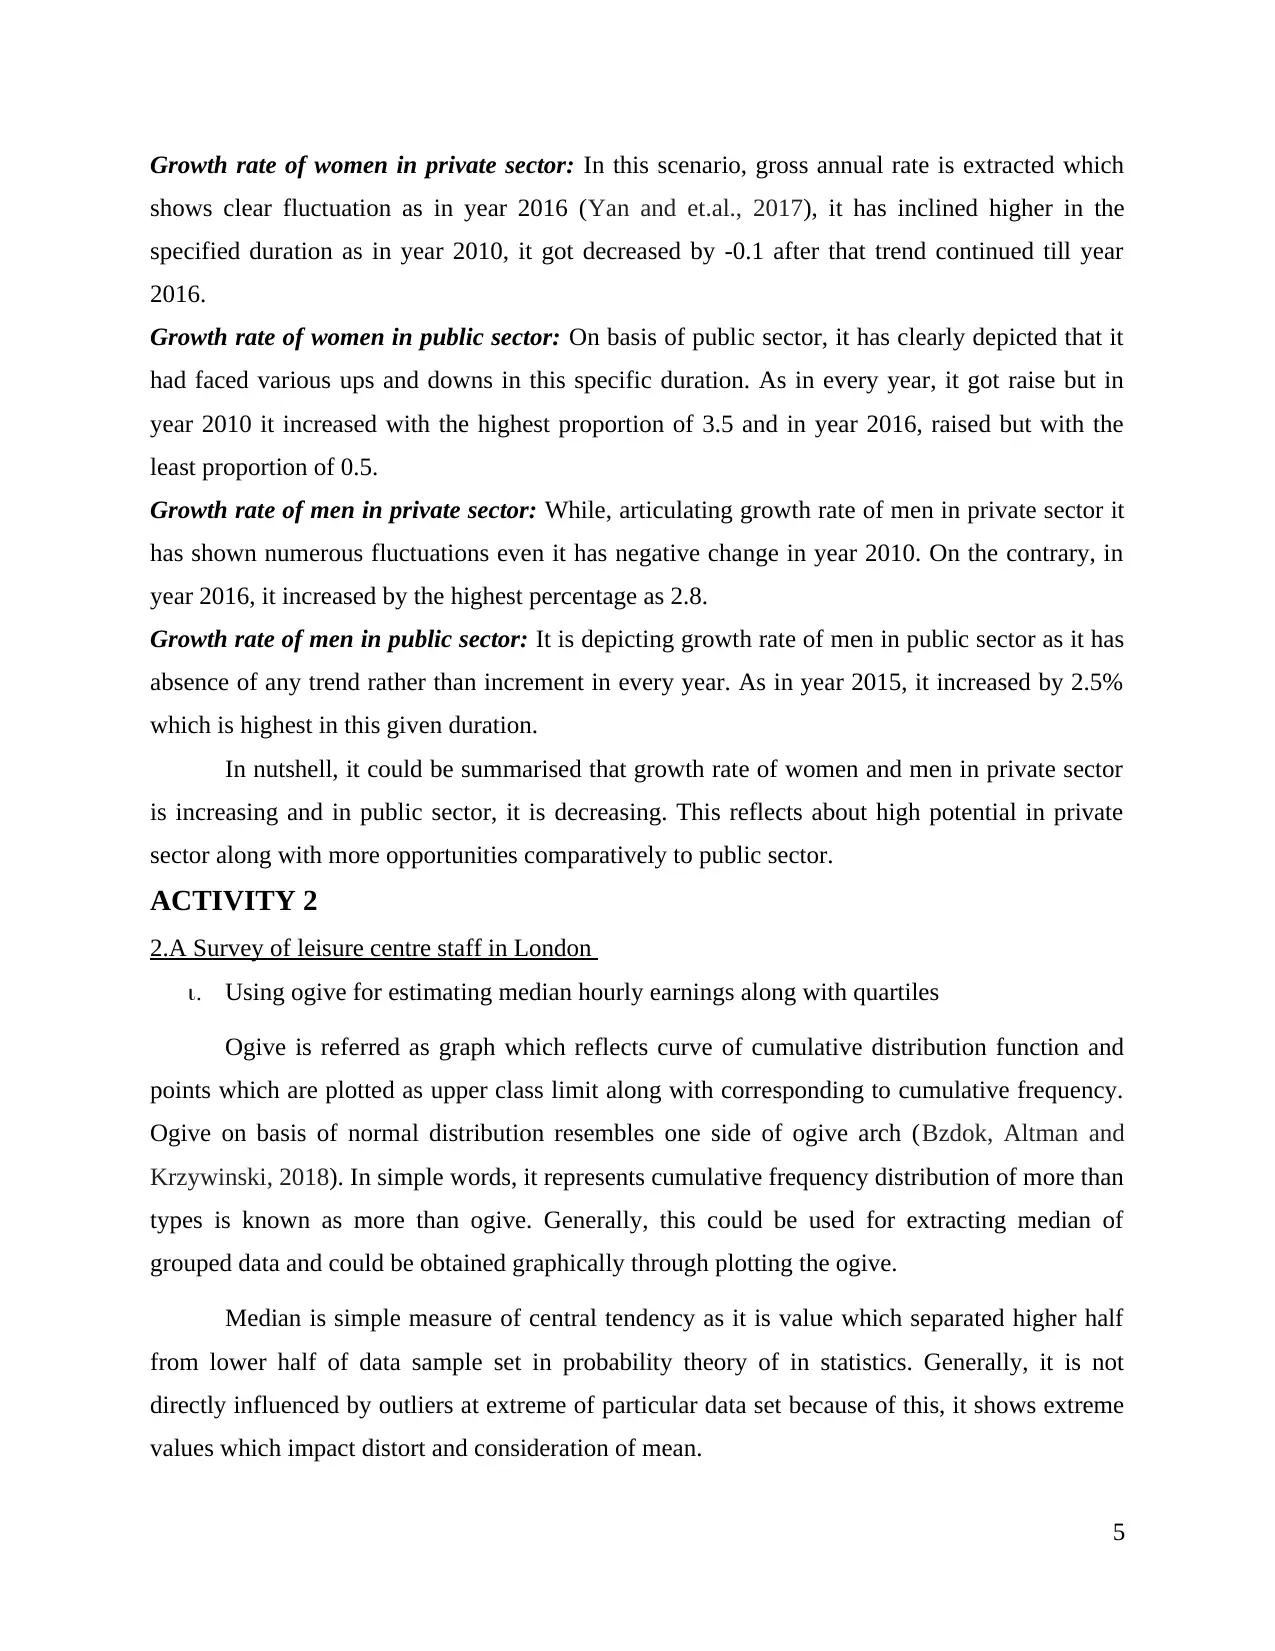
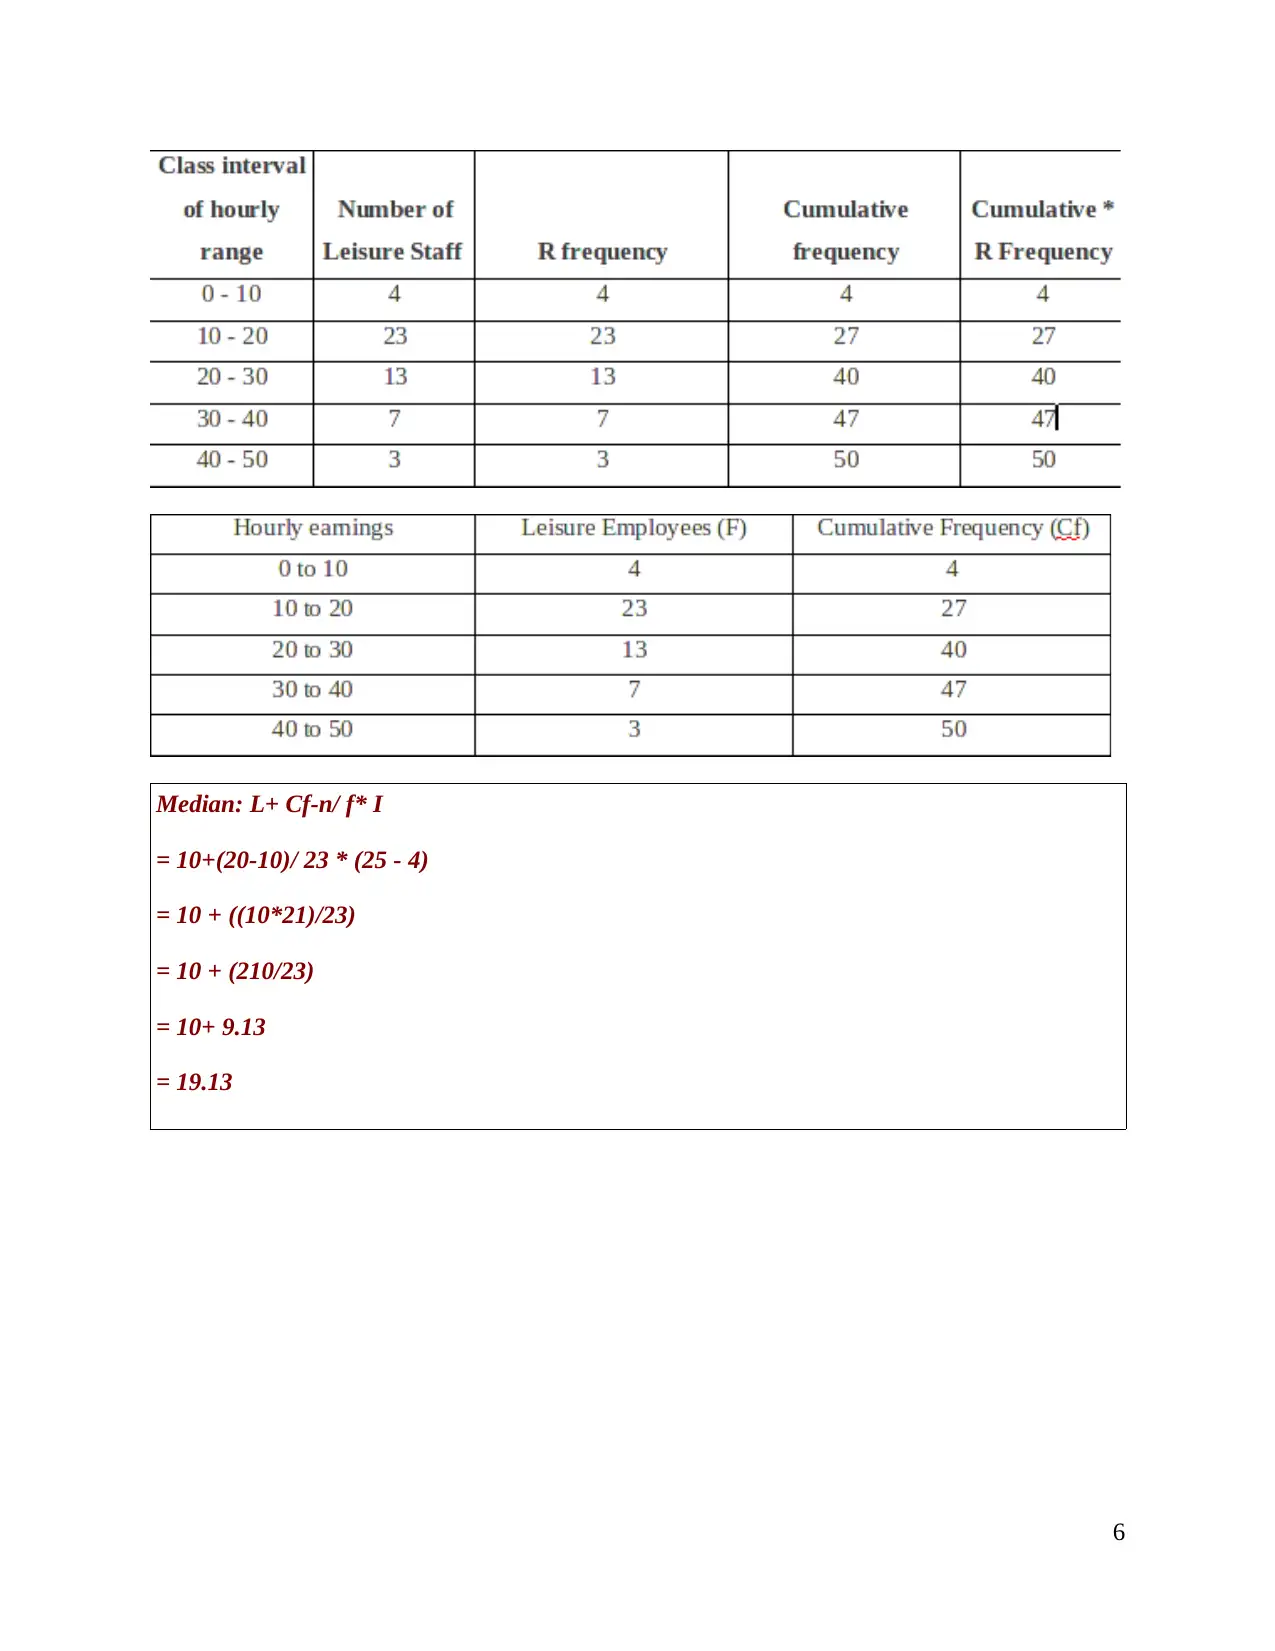
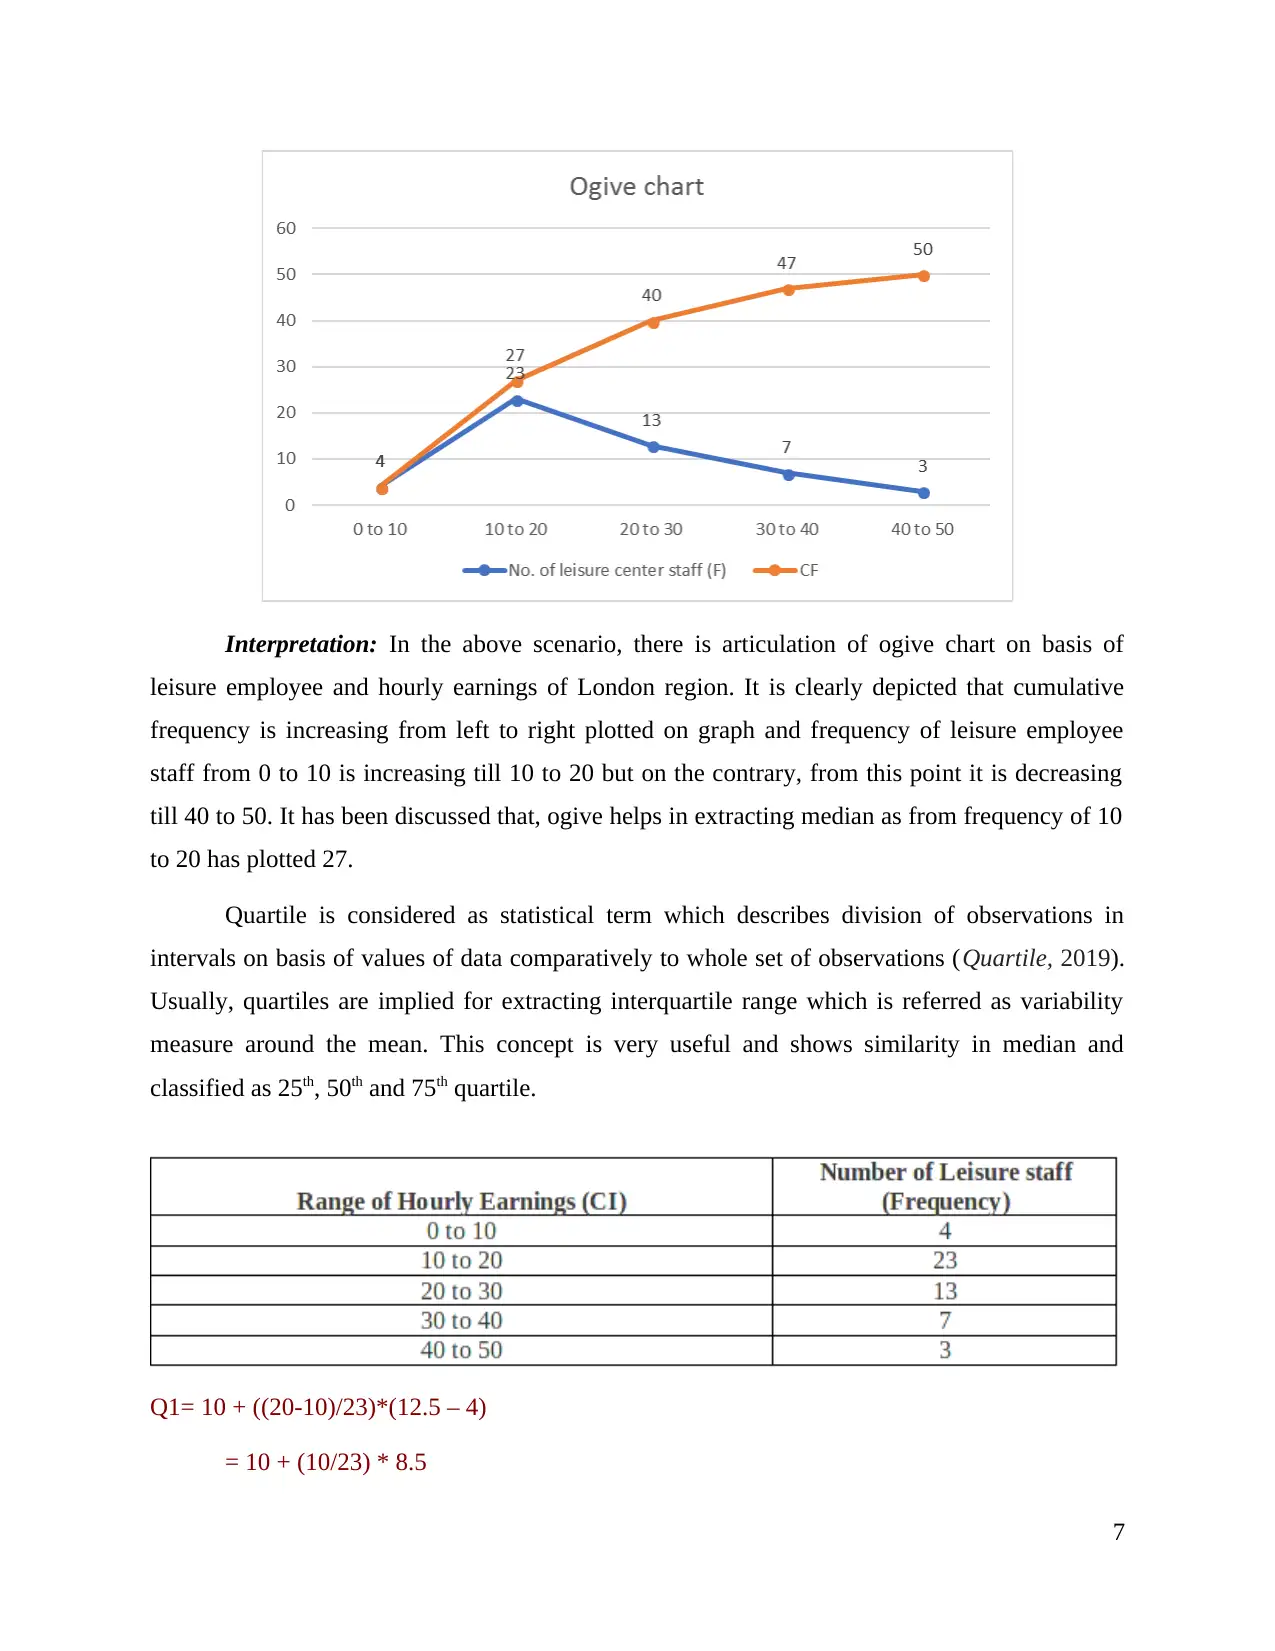
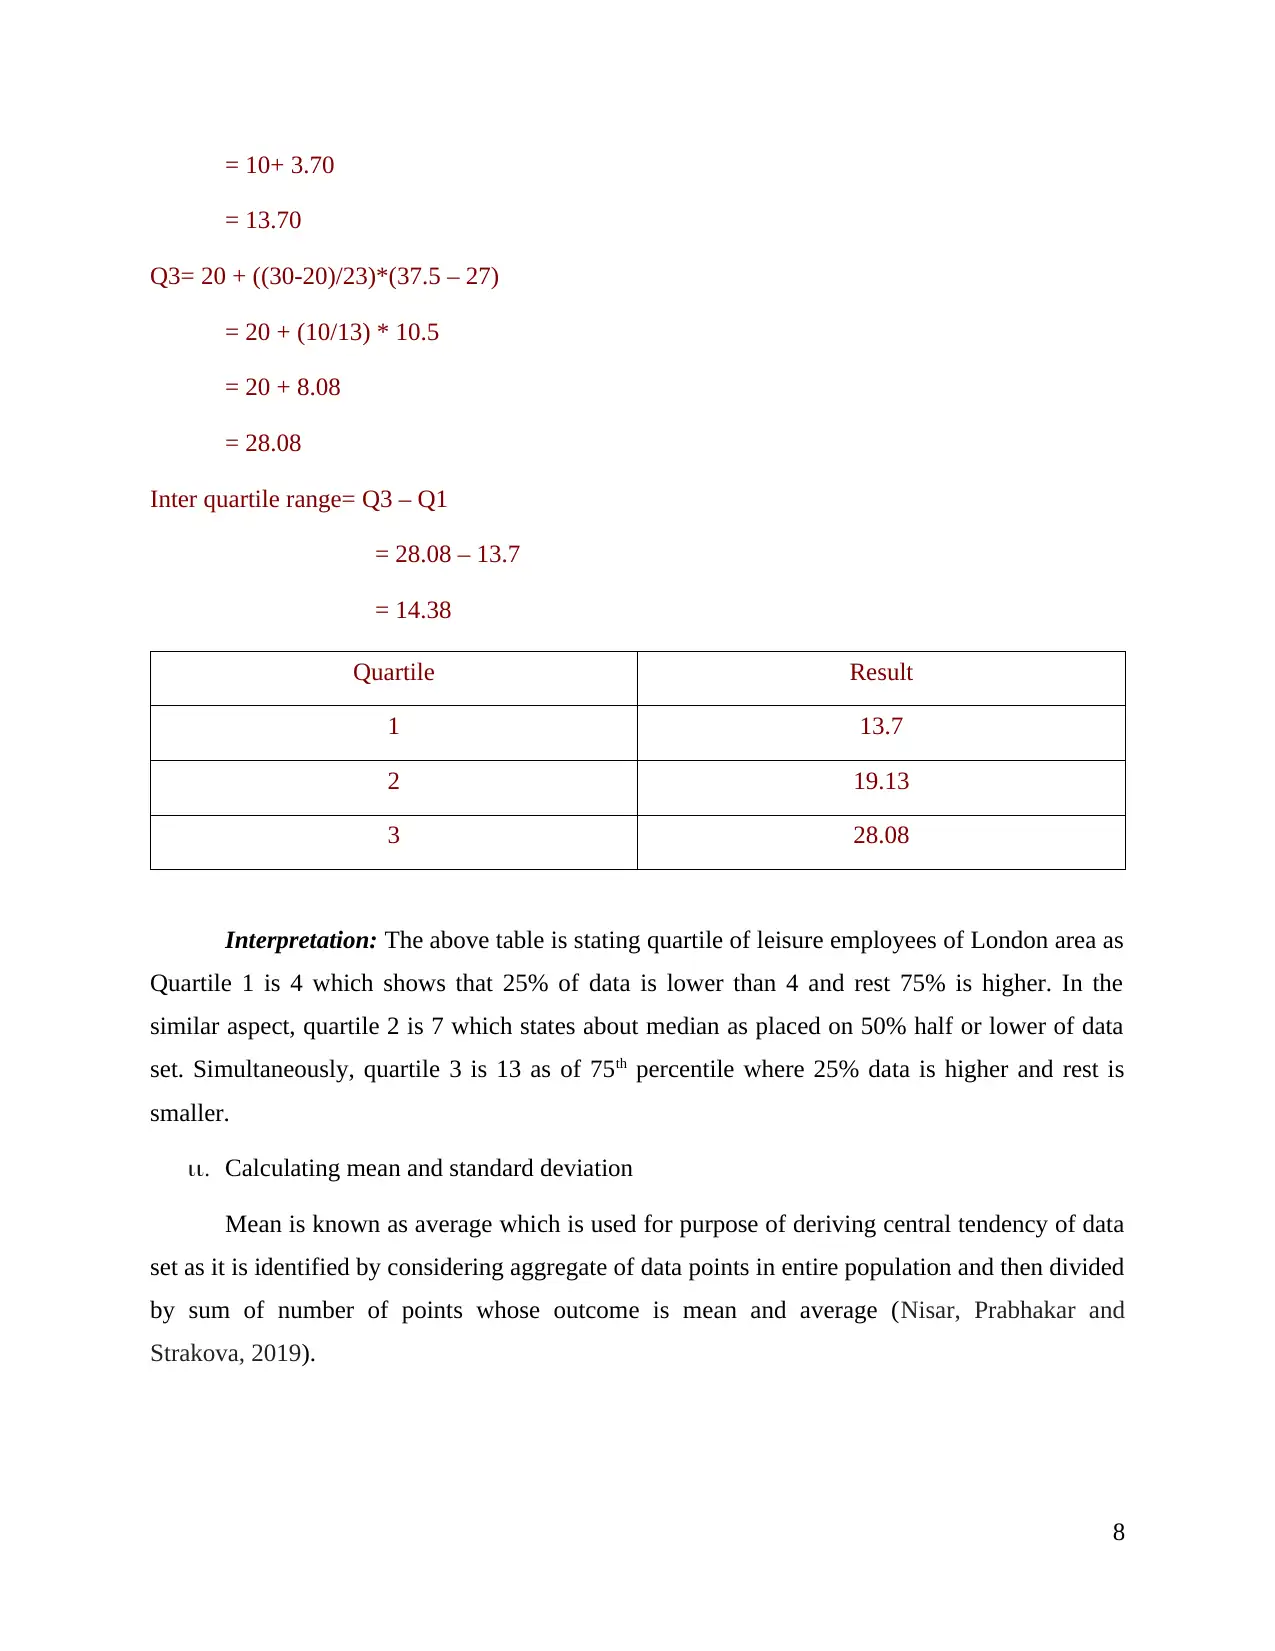
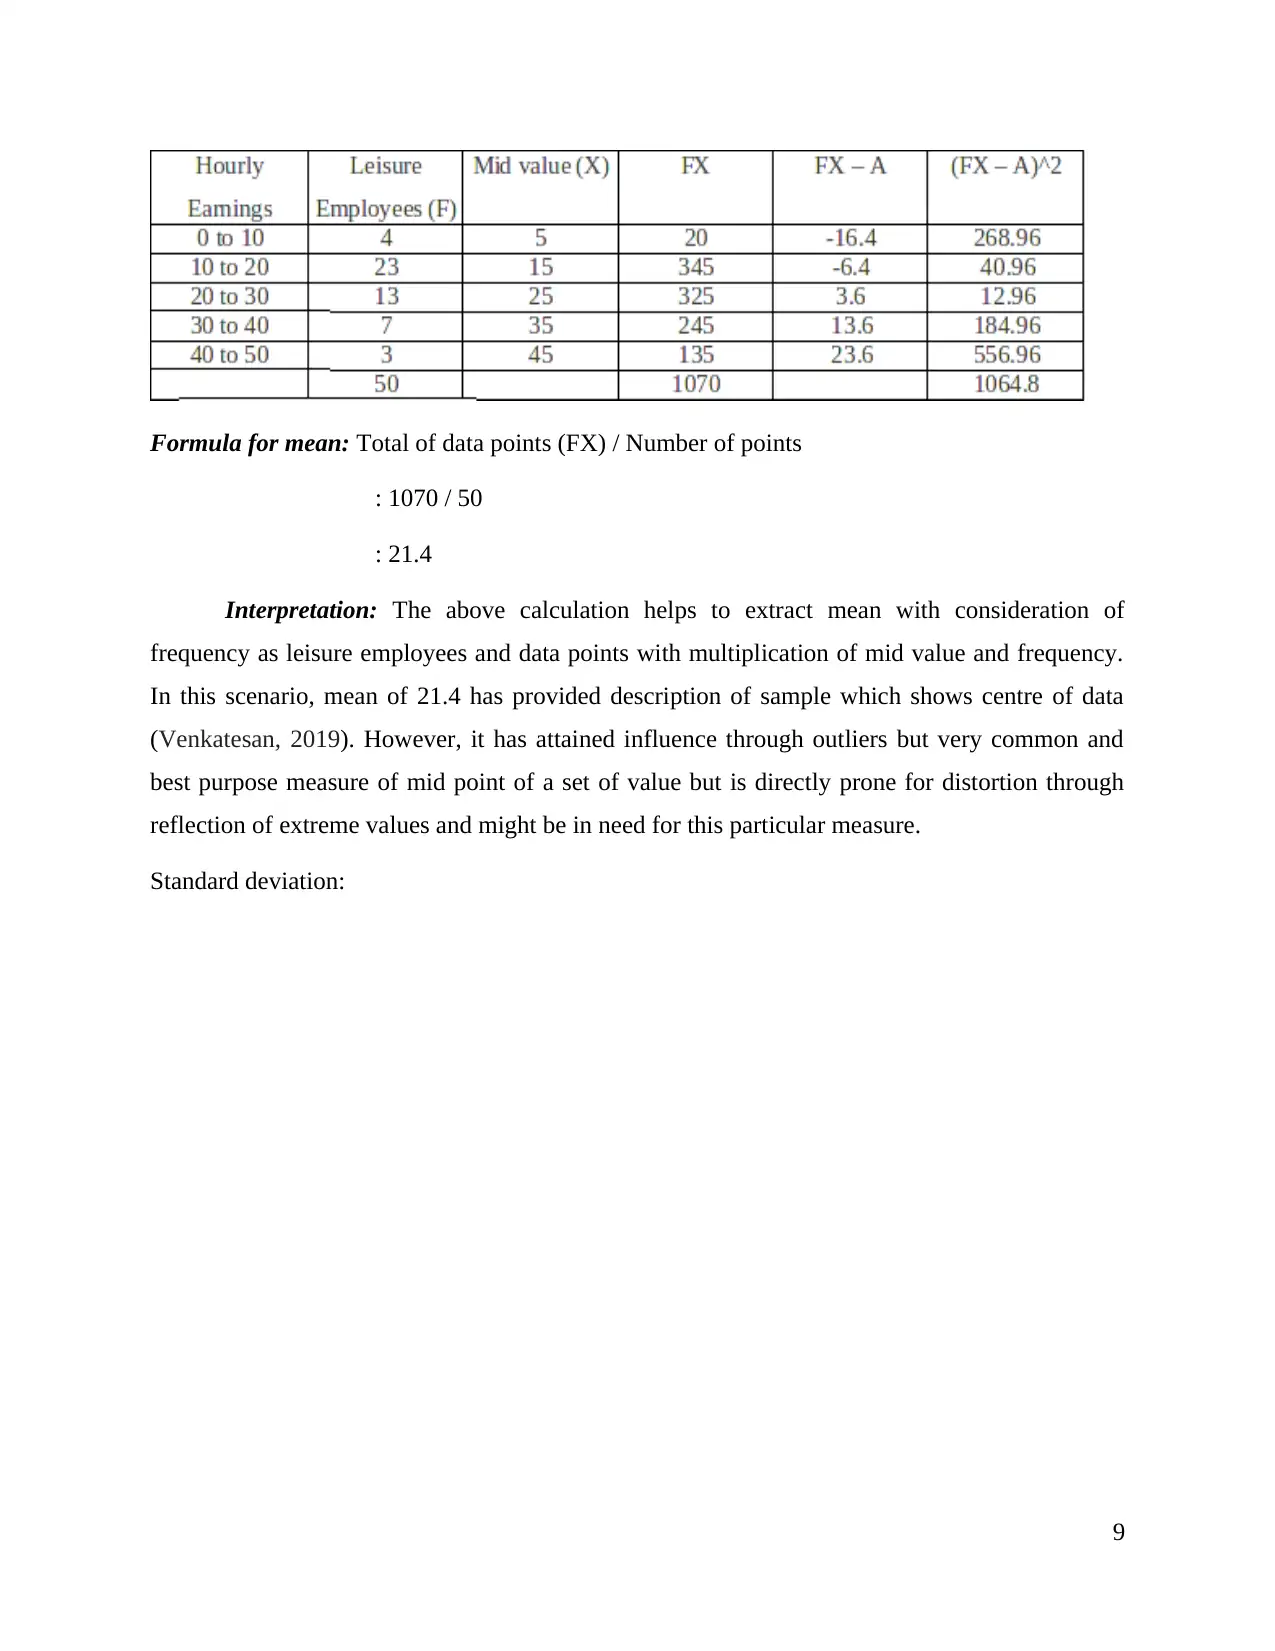
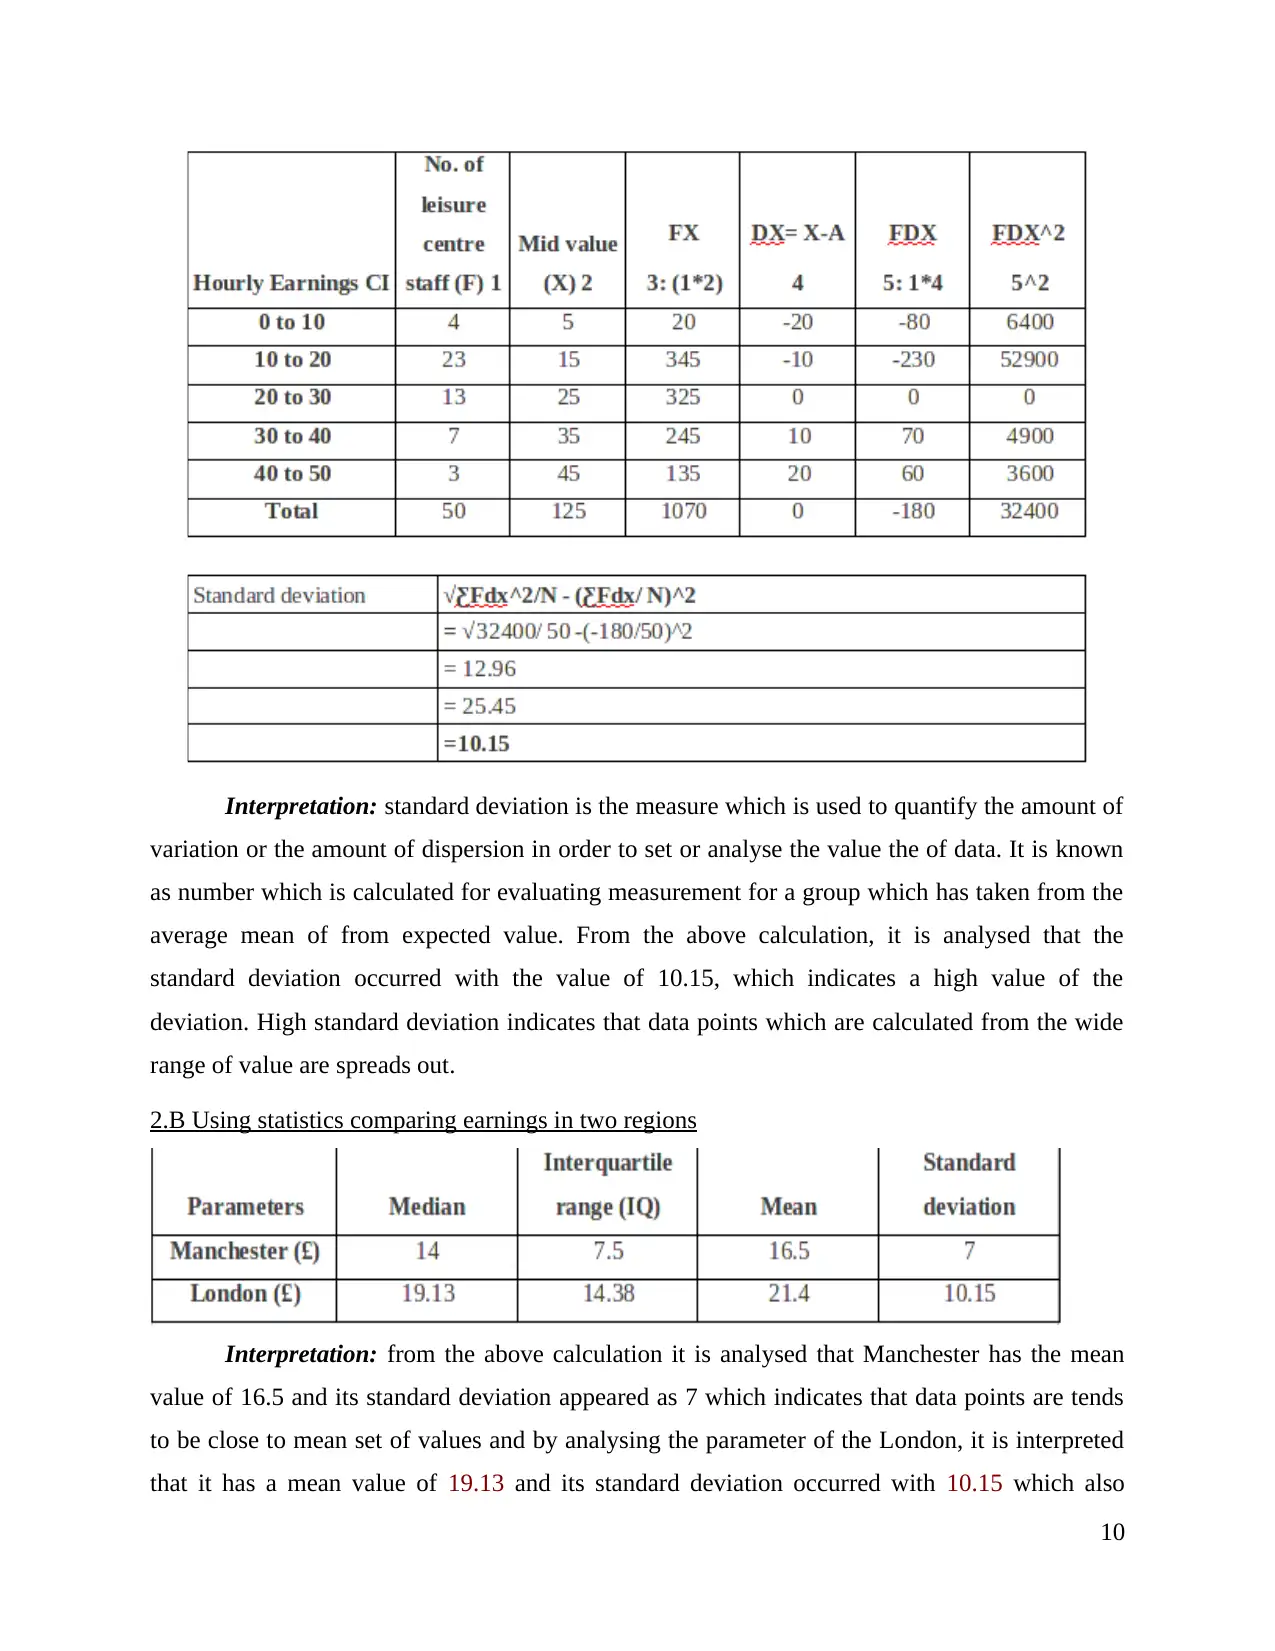
This report presents a comprehensive statistical analysis encompassing various aspects of business and economics. It begins with an examination of earnings in both the public and private sectors, utilizing hypothesis testing to determine differences between men and women's income levels. The report then delves into time series analysis, plotting earnings trends for different groups and calculating annual growth rates. Furthermore, it explores a survey of leisure center staff in London, employing ogive charts, quartiles, and descriptive statistics to analyze hourly earnings. A comparative analysis with the Manchester region is also included. The report extends to inventory management, extracting the economic order quantity for a shop, determining ordering frequency and costs, and specifying inventory policy and reorder levels. Finally, it analyzes changes in CPI, CPIH, and RPI from 2007-2017, presenting the data in a scatter diagram. Overall, the report provides a detailed statistical overview of earnings, inventory, and economic trends, offering valuable insights into various business and economic contexts.
Document Page
STATISTICS FOR
MANAGEMENT
tabler-icon-diamond-filled.svg

Paraphrase This Document

Need a fresh take? Get an instant paraphrase of this document with our AI Paraphraser
Document Page
TABLE OF CONTENTS
INTRODUCTION...........................................................................................................................1
ACTIVITY 1....................................................................................................................................1
A. Determining that earnings of men in public sector is different to women with context to
hypothesis testing........................................................................................................................1
B. Determining that earnings of men in private sector is different to women with context to
hypothesis testing........................................................................................................................2
C. Drawing earnings time chart of every group..........................................................................3
D. Identifying annual growth rate of all four groups..................................................................5
ACTIVITY 2....................................................................................................................................6
2.A Survey of leisure centre staff in London .............................................................................6
2.B Using statistics comparing earnings in two regions...........................................................10
ACTIVITY 3..................................................................................................................................11
a. Extracting Economic order quantity......................................................................................11
b. How often it must order with cost.........................................................................................11
c. Extracting Inventory policy cost...........................................................................................11
d. Specifying current service level............................................................................................12
e. Re-order level........................................................................................................................12
ACTIVITY 4..................................................................................................................................12
4.a Indicating change in CPI, CPIH and RFI from the year 2007-2017...................................12
4.b Producing a scatter diagram................................................................................................13
CONCLUSION..............................................................................................................................13
REFERENCES..............................................................................................................................15
Document Page
INTRODUCTION
Statistics is known as branch of mathematics which directly deal with organization.,
collection, analysis, interpretation and gathering of numerical data. It is especially used for
drawing general conclusion relation to data set through sample of data. The present report would
discuss about business and economic information obtained through Office of National Statistics
related to men and women earnings in bothy public and private sector. In the same series, it will
articulate about survey of leisure centre staff of London area revealed through outcome for
hourly earnings with reference to ogive, quartile, mean and standard deviation. Further, this
would provide comparison from Manchester region with context to descriptive statistics. This
report will reflect economic order quantity of jenny Jones shop along with inventory policy cost
and reorder level for attaining desired service level. Lastly, it will present information related to
CPI, CPIH and RPI over year 2007 to 2017 and ogive chart for cumulative % staff vs hourly
earnings.
ACTIVITY 1
A. Determining that earnings of men in public sector is different to women with context to
hypothesis testing
Null hypothesis: H0 : There is no difference in earnings of public sector of men and women.
Alternative hypothesis: H1 : There is difference in earnings of public sector of men and women.
1
Document Page
Interpretation: The above table is reflecting results of t test undertaken for men and
women who are employed in public sector. The average of earnings of men is 32276 and women
is 26929 with context to public sector with variance of 1449962 and 977868 respectively.
Further, it has been clearly depicted that its p value is greater than 0.05 which shows that null
hypothesis is not true (Koutras, Koutras and Yalcin, 2016). It has presence of statistical
significance that earnings of men and women in public sector are different with degree of
freedom as 13.
B. Determining that earnings of men in private sector is different to women with context to
hypothesis testing
Null hypothesis: H0 : There is no difference in earnings of private sector of men and women.
Alternative hypothesis: H1 : There is difference in earnings of private sector of men and
women.
2
tabler-icon-diamond-filled.svg

Paraphrase This Document

Need a fresh take? Get an instant paraphrase of this document with our AI Paraphraser
Document Page
Interpretation: The above scenario is reflecting about earnings of men and women who
are working in private sector as there average is 28062.87 and 2051.25 respectively. In the same
series, men and women variance is 840242.70 and 988729.93 with degree of freedom as 14. It
has clearly viewed about outcome greater than 0.05 so there is rejection of alternative hypothesis
(Bloom and et.al., 2017). It has been elaborated that there is not significant difference in earning
of men and women who are working in private sector.
C. Drawing earnings time chart of every group
Gross Annual earnings of men in Public and private sector
3
Document Page
Gross Annual earnings of women in Public and private sector
D. Identifying annual growth rate of all four groups
Interpretation: The above table is articulating annual growth rate of men and women in
both public and private sector over year 2009 to 2016. The detailed description of every group is
stated below:
4
Document Page
Growth rate of women in private sector: In this scenario, gross annual rate is extracted which
shows clear fluctuation as in year 2016 (Yan and et.al., 2017), it has inclined higher in the
specified duration as in year 2010, it got decreased by -0.1 after that trend continued till year
2016.
Growth rate of women in public sector: On basis of public sector, it has clearly depicted that it
had faced various ups and downs in this specific duration. As in every year, it got raise but in
year 2010 it increased with the highest proportion of 3.5 and in year 2016, raised but with the
least proportion of 0.5.
Growth rate of men in private sector: While, articulating growth rate of men in private sector it
has shown numerous fluctuations even it has negative change in year 2010. On the contrary, in
year 2016, it increased by the highest percentage as 2.8.
Growth rate of men in public sector: It is depicting growth rate of men in public sector as it has
absence of any trend rather than increment in every year. As in year 2015, it increased by 2.5%
which is highest in this given duration.
In nutshell, it could be summarised that growth rate of women and men in private sector
is increasing and in public sector, it is decreasing. This reflects about high potential in private
sector along with more opportunities comparatively to public sector.
ACTIVITY 2
2.A Survey of leisure centre staff in London
i. Using ogive for estimating median hourly earnings along with quartiles
Ogive is referred as graph which reflects curve of cumulative distribution function and
points which are plotted as upper class limit along with corresponding to cumulative frequency.
Ogive on basis of normal distribution resembles one side of ogive arch (Bzdok, Altman and
Krzywinski, 2018). In simple words, it represents cumulative frequency distribution of more than
types is known as more than ogive. Generally, this could be used for extracting median of
grouped data and could be obtained graphically through plotting the ogive.
Median is simple measure of central tendency as it is value which separated higher half
from lower half of data sample set in probability theory of in statistics. Generally, it is not
directly influenced by outliers at extreme of particular data set because of this, it shows extreme
values which impact distort and consideration of mean.
5
tabler-icon-diamond-filled.svg

Paraphrase This Document

Need a fresh take? Get an instant paraphrase of this document with our AI Paraphraser
Document Page
Median: L+ Cf-n/ f* I
= 10+(20-10)/ 23 * (25 - 4)
= 10 + ((10*21)/23)
= 10 + (210/23)
= 10+ 9.13
= 19.13
6
Document Page
Interpretation: In the above scenario, there is articulation of ogive chart on basis of
leisure employee and hourly earnings of London region. It is clearly depicted that cumulative
frequency is increasing from left to right plotted on graph and frequency of leisure employee
staff from 0 to 10 is increasing till 10 to 20 but on the contrary, from this point it is decreasing
till 40 to 50. It has been discussed that, ogive helps in extracting median as from frequency of 10
to 20 has plotted 27.
Quartile is considered as statistical term which describes division of observations in
intervals on basis of values of data comparatively to whole set of observations (Quartile, 2019).
Usually, quartiles are implied for extracting interquartile range which is referred as variability
measure around the mean. This concept is very useful and shows similarity in median and
classified as 25th, 50th and 75th quartile.
Q1= 10 + ((20-10)/23)*(12.5 – 4)
= 10 + (10/23) * 8.5
7
Document Page
= 10+ 3.70
= 13.70
Q3= 20 + ((30-20)/23)*(37.5 – 27)
= 20 + (10/13) * 10.5
= 20 + 8.08
= 28.08
Inter quartile range= Q3 – Q1
= 28.08 – 13.7
= 14.38
Quartile Result
1 13.7
2 19.13
3 28.08
Interpretation: The above table is stating quartile of leisure employees of London area as
Quartile 1 is 4 which shows that 25% of data is lower than 4 and rest 75% is higher. In the
similar aspect, quartile 2 is 7 which states about median as placed on 50% half or lower of data
set. Simultaneously, quartile 3 is 13 as of 75th percentile where 25% data is higher and rest is
smaller.
ii. Calculating mean and standard deviation
Mean is known as average which is used for purpose of deriving central tendency of data
set as it is identified by considering aggregate of data points in entire population and then divided
by sum of number of points whose outcome is mean and average (Nisar, Prabhakar and
Strakova, 2019).
8
tabler-icon-diamond-filled.svg

Paraphrase This Document

Need a fresh take? Get an instant paraphrase of this document with our AI Paraphraser
Document Page
Formula for mean: Total of data points (FX) / Number of points
: 1070 / 50
: 21.4
Interpretation: The above calculation helps to extract mean with consideration of
frequency as leisure employees and data points with multiplication of mid value and frequency.
In this scenario, mean of 21.4 has provided description of sample which shows centre of data
(Venkatesan, 2019). However, it has attained influence through outliers but very common and
best purpose measure of mid point of a set of value but is directly prone for distortion through
reflection of extreme values and might be in need for this particular measure.
Standard deviation:
9
Document Page
Interpretation: standard deviation is the measure which is used to quantify the amount of
variation or the amount of dispersion in order to set or analyse the value the of data. It is known
as number which is calculated for evaluating measurement for a group which has taken from the
average mean of from expected value. From the above calculation, it is analysed that the
standard deviation occurred with the value of 10.15, which indicates a high value of the
deviation. High standard deviation indicates that data points which are calculated from the wide
range of value are spreads out.
2.B Using statistics comparing earnings in two regions
Interpretation: from the above calculation it is analysed that Manchester has the mean
value of 16.5 and its standard deviation appeared as 7 which indicates that data points are tends
to be close to mean set of values and by analysing the parameter of the London, it is interpreted
that it has a mean value of 19.13 and its standard deviation occurred with 10.15 which also
10
chevron_up_icon
1 out of 17
circle_padding
hide_on_mobile
zoom_out_icon
[object Object]