Statistics 1: Exploratory Data Analysis, Regression, and Correlation

Verified

Added on  2023/01/24

|25
|3330
|66
Report
AI Summary
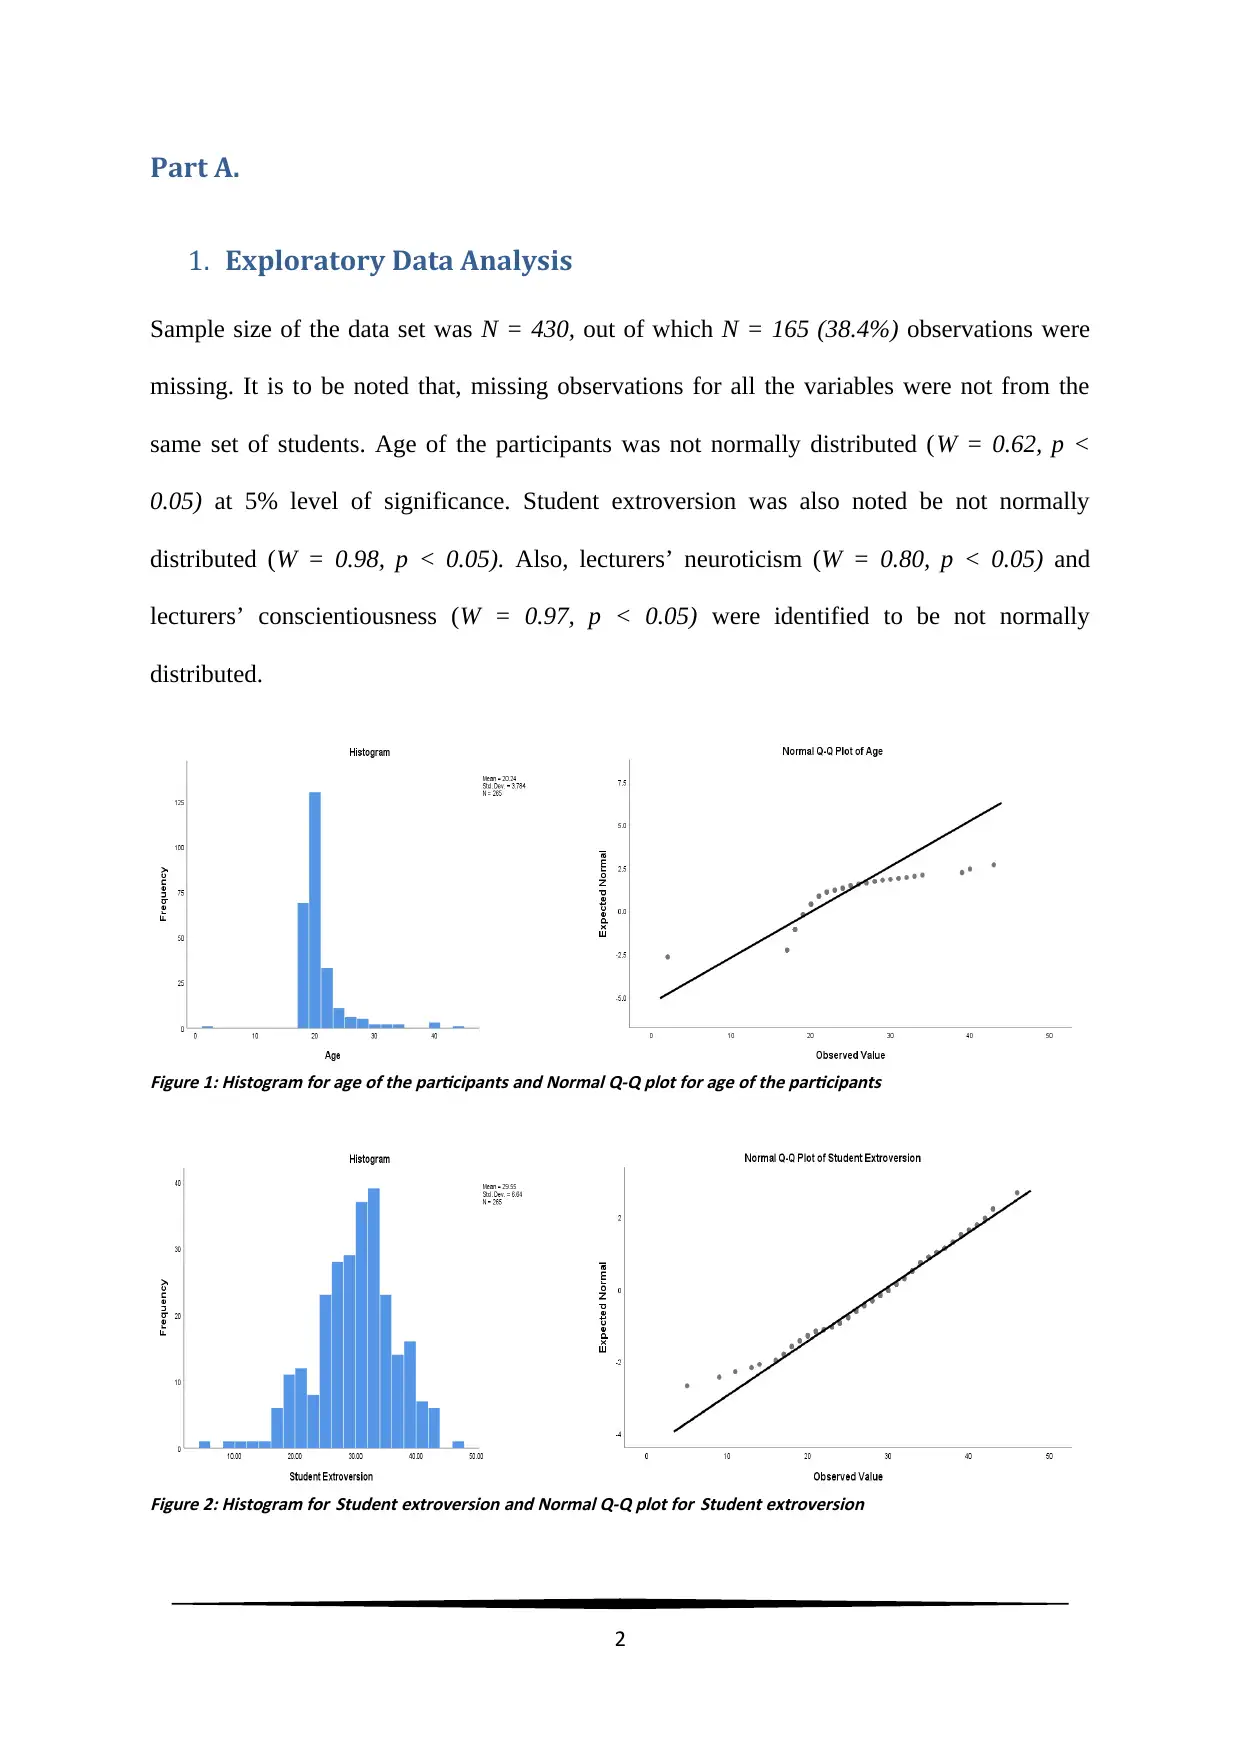
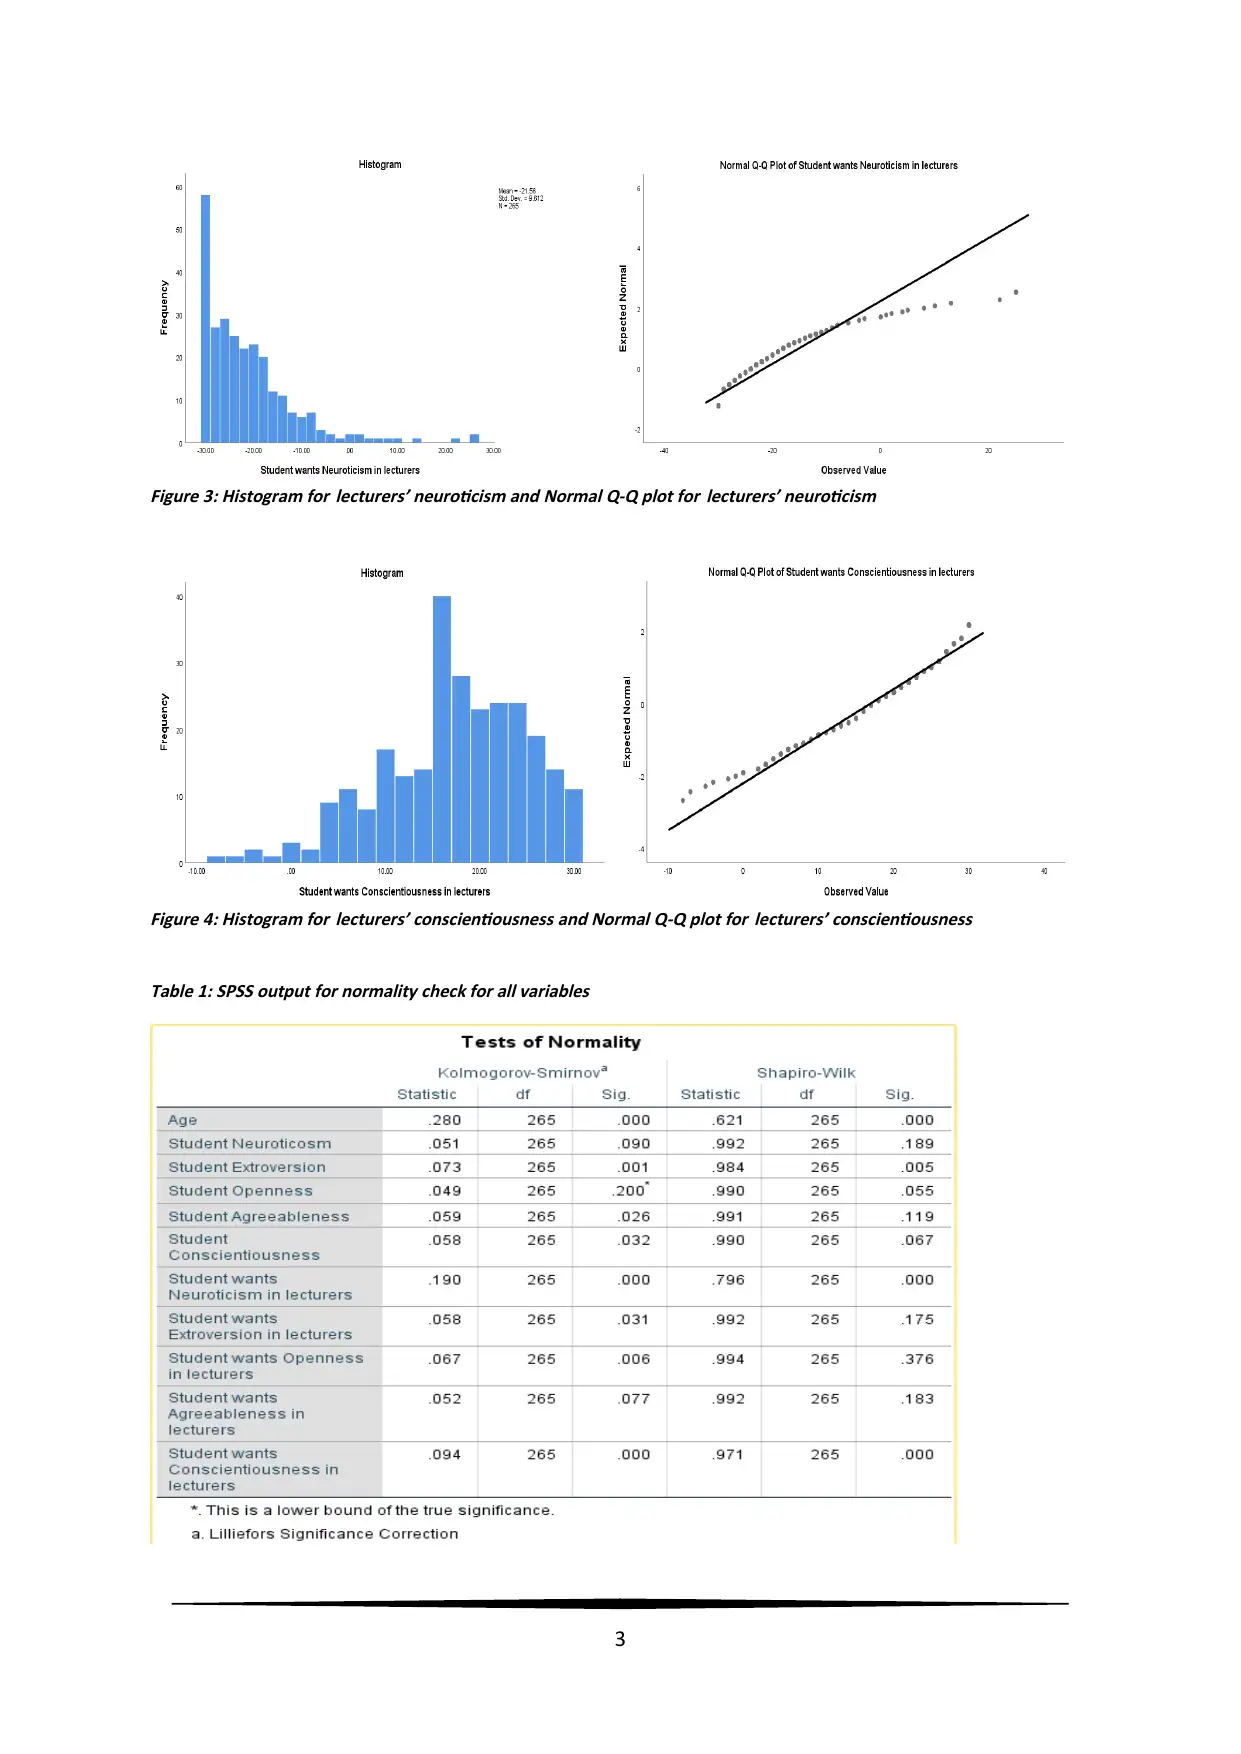
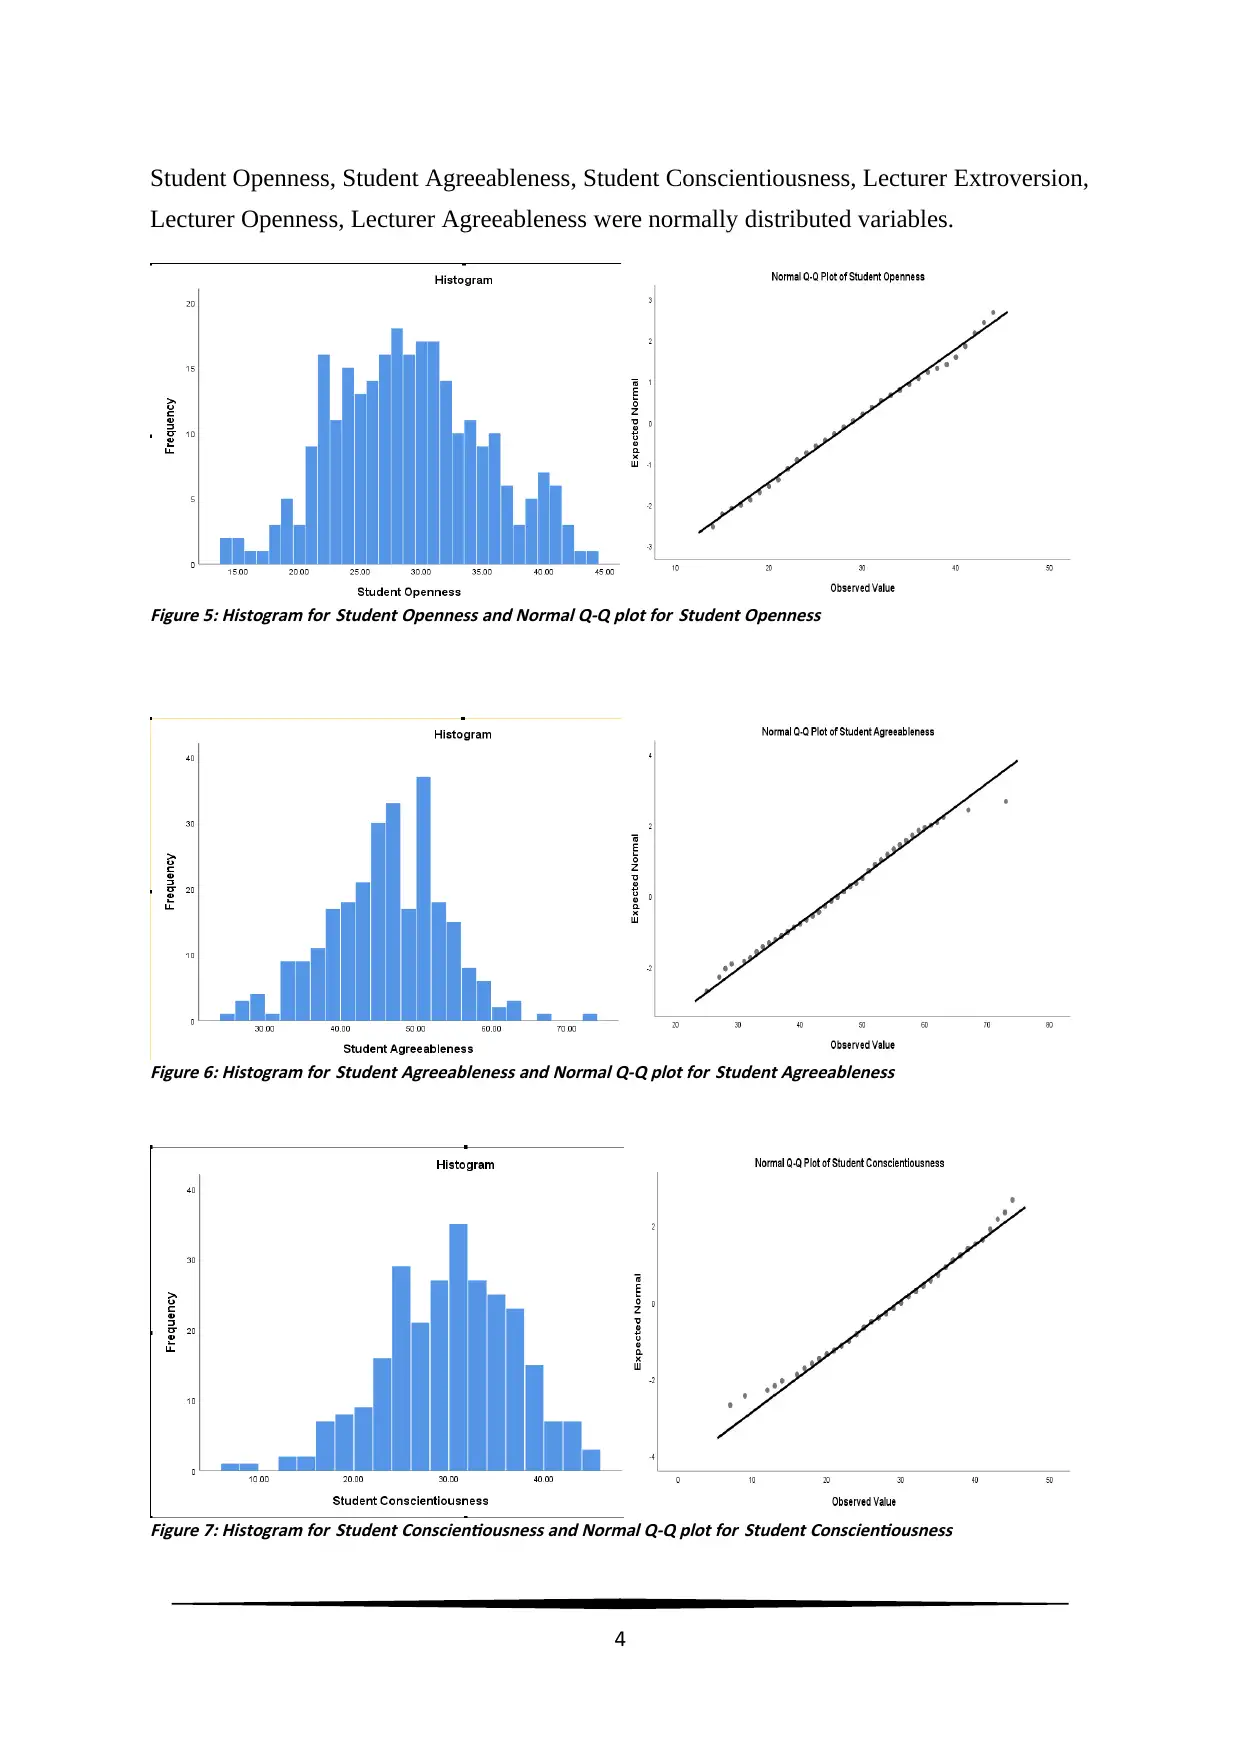
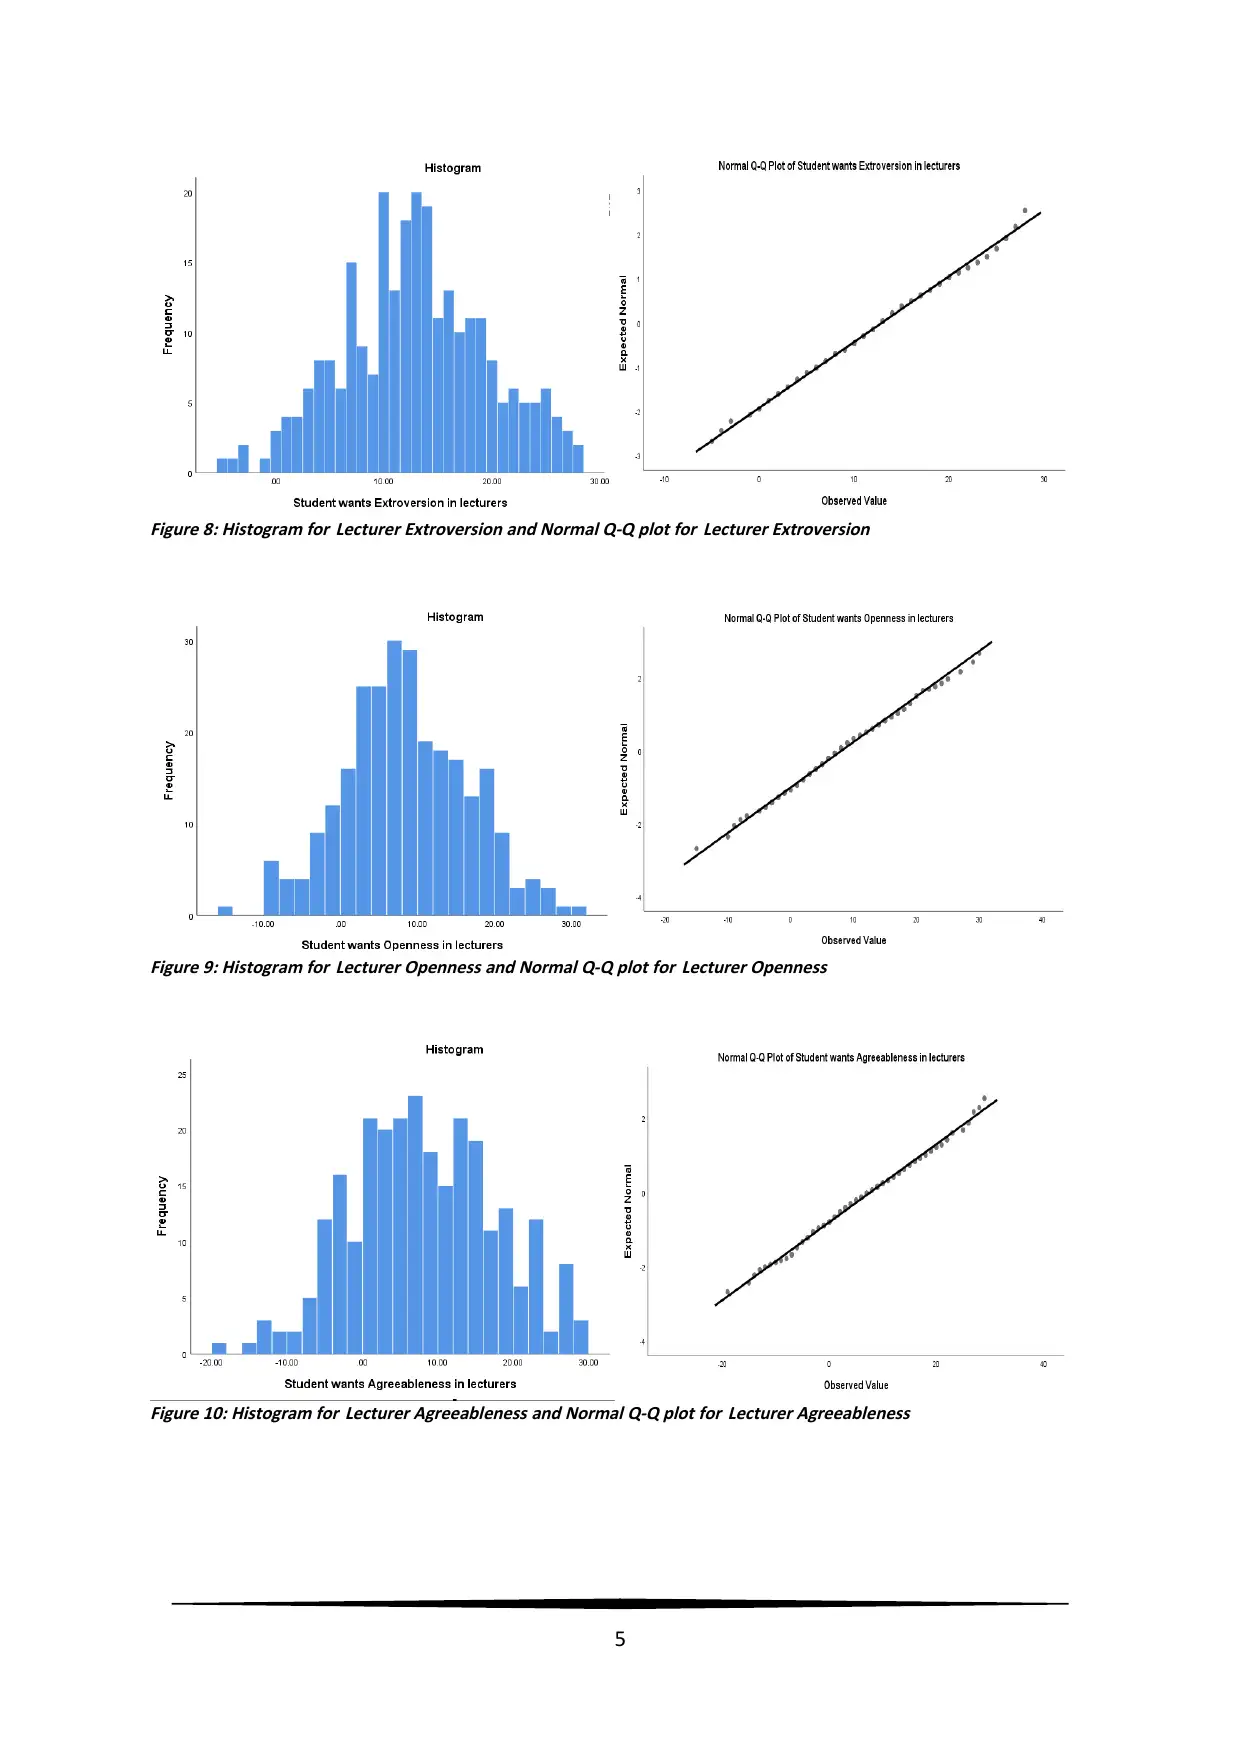
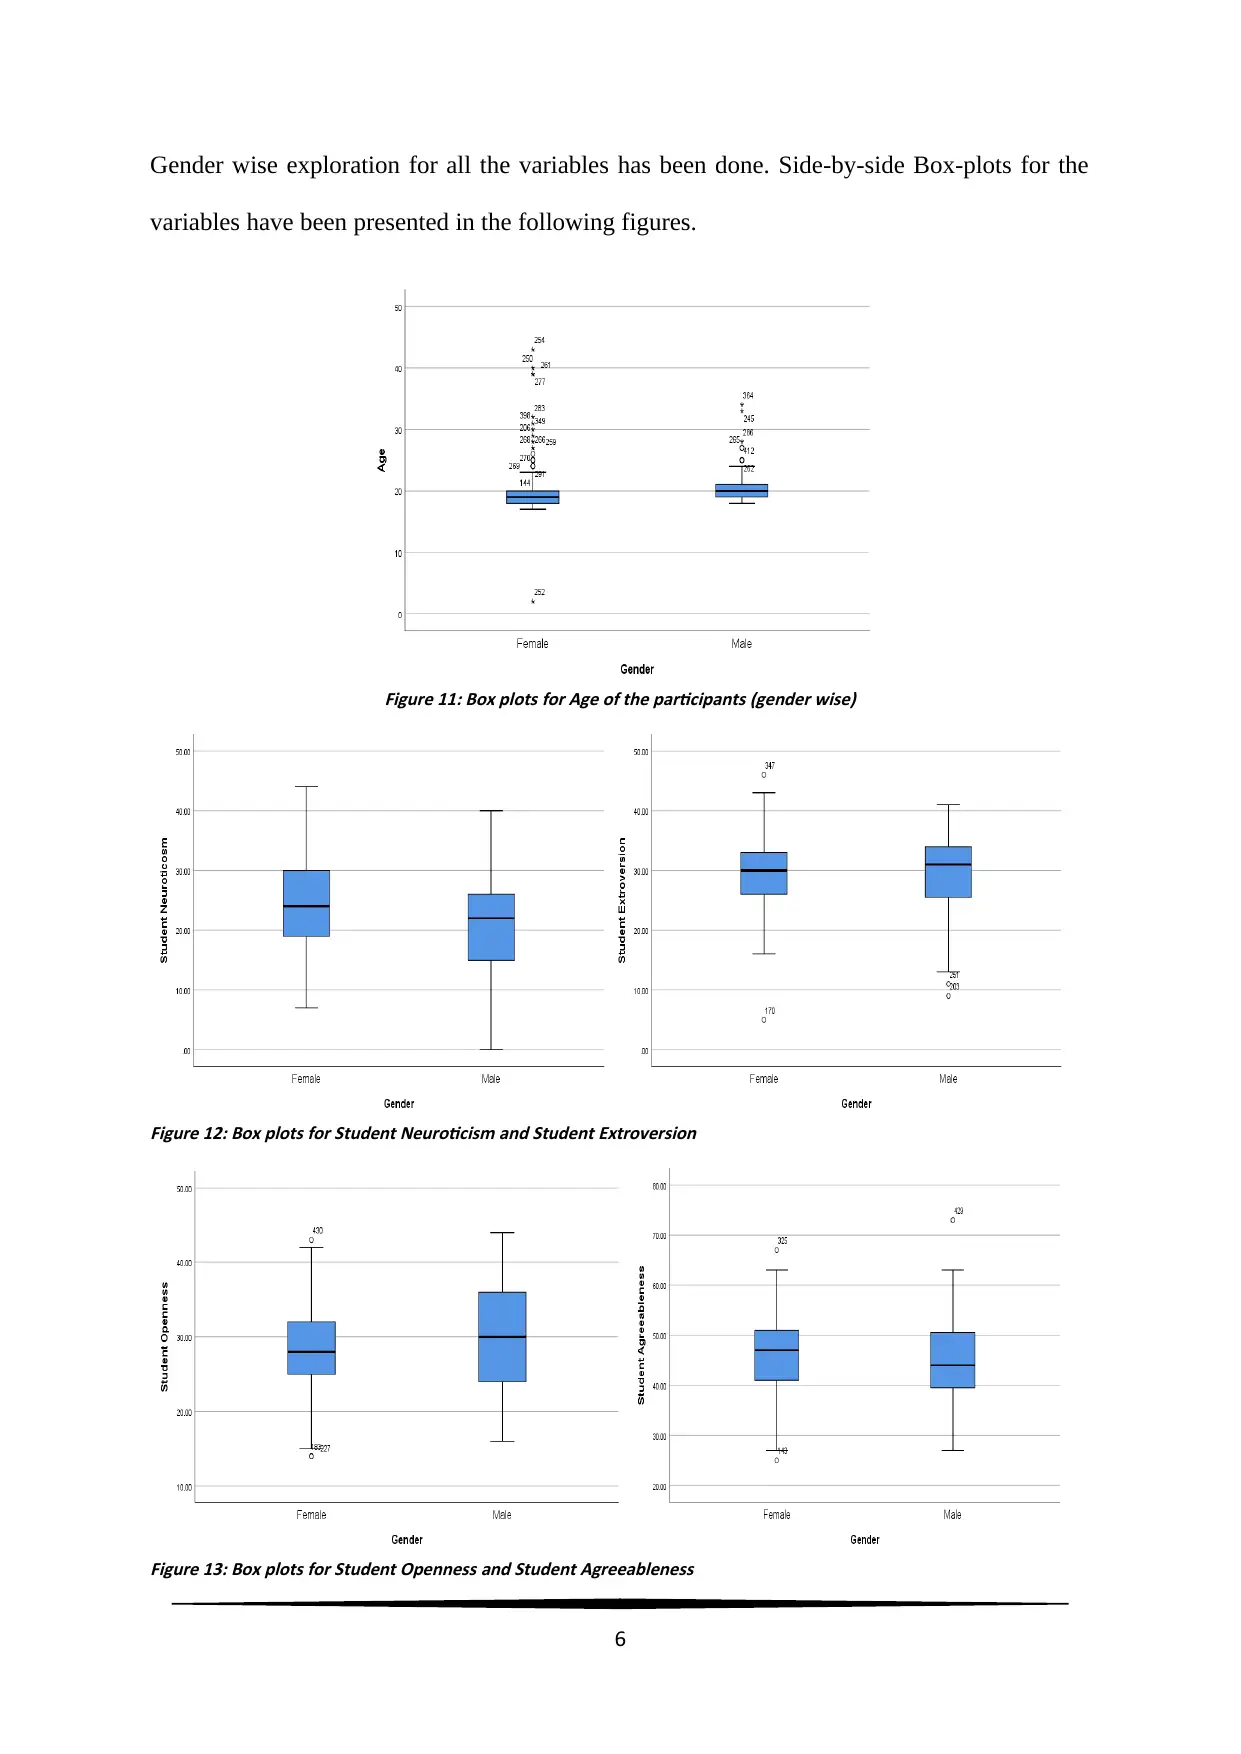
This report presents a comprehensive statistical analysis of a dataset, focusing on exploratory data analysis, correlation, and regression techniques. The analysis begins with an examination of data distribution, including normality tests and the identification of outliers. Descriptive statistics, including means, standard deviations, and confidence intervals, are presented. Missing data is addressed using the EM method. Correlation analysis using Pearson's correlation coefficient is performed to assess the relationships between variables, with one-tailed tests used. Simple and multiple linear regression models are then developed to predict lecturer extroversion based on student extroversion, age, and gender, with diagnostics to validate model assumptions. The report also explores the linear relationship between Miles per gallon (MPG), Engine size, and Horsepower using Pearson correlation. The findings reveal significant correlations and regression equations, providing insights into the relationships between the variables. The report includes figures and tables from SPSS outputs to support the analysis.
Document Page
Statistics
1
tabler-icon-diamond-filled.svg

Paraphrase This Document

Need a fresh take? Get an instant paraphrase of this document with our AI Paraphraser
Document Page
Part A.
1. Exploratory Data Analysis
Sample size of the data set was N = 430, out of which N = 165 (38.4%) observations were
missing. It is to be noted that, missing observations for all the variables were not from the
same set of students. Age of the participants was not normally distributed (W = 0.62, p <
0.05) at 5% level of significance. Student extroversion was also noted be not normally
distributed (W = 0.98, p < 0.05). Also, lecturers’ neuroticism (W = 0.80, p < 0.05) and
lecturers’ conscientiousness (W = 0.97, p < 0.05) were identified to be not normally
distributed.
Figure 1: Histogram for age of the participants and Normal Q-Q plot for age of the participants
Figure 2: Histogram for Student extroversion and Normal Q-Q plot for Student extroversion
2
Document Page
Figure 3: Histogram for lecturers’ neuroticism and Normal Q-Q plot for lecturers’ neuroticism
Figure 4: Histogram for lecturers’ conscientiousness and Normal Q-Q plot for lecturers’ conscientiousness
Table 1: SPSS output for normality check for all variables
3
Document Page
Student Openness, Student Agreeableness, Student Conscientiousness, Lecturer Extroversion,
Lecturer Openness, Lecturer Agreeableness were normally distributed variables.
Figure 5: Histogram for Student Openness and Normal Q-Q plot for Student Openness
Figure 6: Histogram for Student Agreeableness and Normal Q-Q plot for Student Agreeableness
Figure 7: Histogram for Student Conscientiousness and Normal Q-Q plot for Student Conscientiousness
4
tabler-icon-diamond-filled.svg

Paraphrase This Document

Need a fresh take? Get an instant paraphrase of this document with our AI Paraphraser
Document Page
Figure 8: Histogram for Lecturer Extroversion and Normal Q-Q plot for Lecturer Extroversion
Figure 9: Histogram for Lecturer Openness and Normal Q-Q plot for Lecturer Openness
Figure 10: Histogram for Lecturer Agreeableness and Normal Q-Q plot for Lecturer Agreeableness
5
Document Page
Gender wise exploration for all the variables has been done. Side-by-side Box-plots for the
variables have been presented in the following figures.
Figure 11: Box plots for Age of the participants (gender wise)
Figure 12: Box plots for Student Neuroticism and Student Extroversion
Figure 13: Box plots for Student Openness and Student Agreeableness
6
Document Page
Figure 14: Box plots for Student Conscientiousness and Lecturer Neuroticism
Figure 15: Box plots for Lecturer Extroversion and Lecturer Openness
Figure 16: Box plots for Lecturer Agreeableness and Lecturer Conscientiousness
7
tabler-icon-diamond-filled.svg

Paraphrase This Document

Need a fresh take? Get an instant paraphrase of this document with our AI Paraphraser
Document Page
Scatter Plots:
Figure 17: Scatter plot of Student Agreeableness versus Lecture Agreeableness
Figure 18: Scatter plot of Student Extroversion versus Lecture Extroversion
8
Document Page
Figure 19: Scatter plot of Student Agreeableness versus Lecture Extroversion
Figure 20: Scatter plot of Student Extroversion versus Lecture Agreeableness
9
Document Page
B. Description of the data
Total N = 430 responses were collected from the students. Gender wise exploration revealed
that 424 observations were valid, and gender information of rest 6 observations was missing.
Gender wise division reflected that female students (N =307, P 72.4%) were more than male
students in the sample (N =307, P 72.4%). Distribution of age of the participants was
affected by age of older participants (outliers). Age of the participants was not normally
distributed. Student extroversion, lecturers’ neuroticism, and lecturers’ conscientiousness
were identified to be not normally distributed variables.
From figure 11, Median age of males was noted be higher than that of the females. Presence
of extreme outliers was evident, especially for females. From figure 12, Student Neuroticism
was noted to be normally distributed for females, and little left skewed for males. Student
Extroversion for female students was almost normally distributed with few outliers, and left
skewed for males. From figure 13, Student Openness was noted to be normally distributed for
females (few outliers) and males. Student Extroversion was slightly left skewed for female
students, and almost normally distributed with few outliers for male students. From figure 14,
Student Conscientiousness was noted to be normally distributed for females (few outliers)
and highly right skewed for males. Lecturer Neuroticism was almost normal for females and
males with some extreme higher scores. From figure 15, Lecturer Extroversion was noted to
be normally distributed for females and slightly right skewed for males. Lecturer Openness
was almost normal for female and male students. From figure 16, Lecturer Agreeableness
was noted to be normally distributed for females and slightly right skewed for males.
Lecturer Conscientiousness was slight right for females with two outlier values, and little left
skewed for males. The scatter plots revealed low positive correlations between student
(Extroversion, Agreeableness) and lecturer (Extroversion, Agreeableness).
10
tabler-icon-diamond-filled.svg

Paraphrase This Document

Need a fresh take? Get an instant paraphrase of this document with our AI Paraphraser
Document Page
C. Table presenting Descriptive Statistics
Table 2: Descriptive Statistics with Valid Frequency (N), Mean (M), and Standard Deviation (SD), 95% Confidence
interval, Range, and Skewness (S)
2. Missing data analysis
Number of missing observations about gender was 6, which was 1.4% of the total sample
data. Due to small percentage, 6 of the missing observations in gender were deselected from
the sample. This reduced the sample size to 424, but still the sample size was considerably
sufficient for statistical analyses.
The missing observations for rest of the continuous variables were large in count (N = 165, P
= 38.37%). Deletion of these missing values would have reduced the reliability as well as the
validity of the sample. Therefore, these missing values were replaced by a suitable value
using the expected minimization (EM) method. This method was chosen due to the fact that
the E step finds the conditional expectation of the "missing" data. The given condition is the
observed values and current estimates of the parameters. In the M step, maximum likelihood
11
Document Page
estimates of the parameters are calculated. As missing observations for all the variables were
not from the same set of students, EM method was best suited for treating the missing values.
3. Correlation
a. The missing observations were handled according to policies made in question 2.
b. One tail test has been used for finding the significance or p-values of the correlations. This
was due to the fact that the scatter diagrams indicated that there exist positive correlations
between the variables under examination.
c. The coefficient of Pearson’s correlation one-tailed test indicated that there exist no
significant correlations between Student Extroversion and Student Agreeableness
( r ( 424 ) =0 . 08 , p=0 . 05 ) , Student Extroversion and Lecturer Agreeableness
( r ( 424 ) =0 . 01 , p=0 . 42 ) . Student Extroversion and Lecturer Extroversion were noted be
have a low but significant correlation ( r ( 424 ) =0 . 19 , p< 0. 05 ) . Low but significant
correlations between Student Agreeableness and Lecturer Extroversion
( r ( 424 ) =0 . 9 , p <0 .05 ) , Student Agreeableness and Lecturer Agreeableness
( r ( 424 ) =0 . 17 , p< 0 .05 ) were noted. A low significant correlation between Lecturer
Extroversion and Lecturer Agreeableness ( r ( 424 ) =0 . 17 , p< 0 .05 ) were noted
Table 3: Pearson’s Correlation SPSS output for one-tail test
12
chevron_up_icon
1 out of 25
circle_padding
hide_on_mobile
zoom_out_icon
[object Object]