Statistics and Research Assignment - Statistical Test Analysis
VerifiedAdded on 2022/08/15
|7
|763
|12
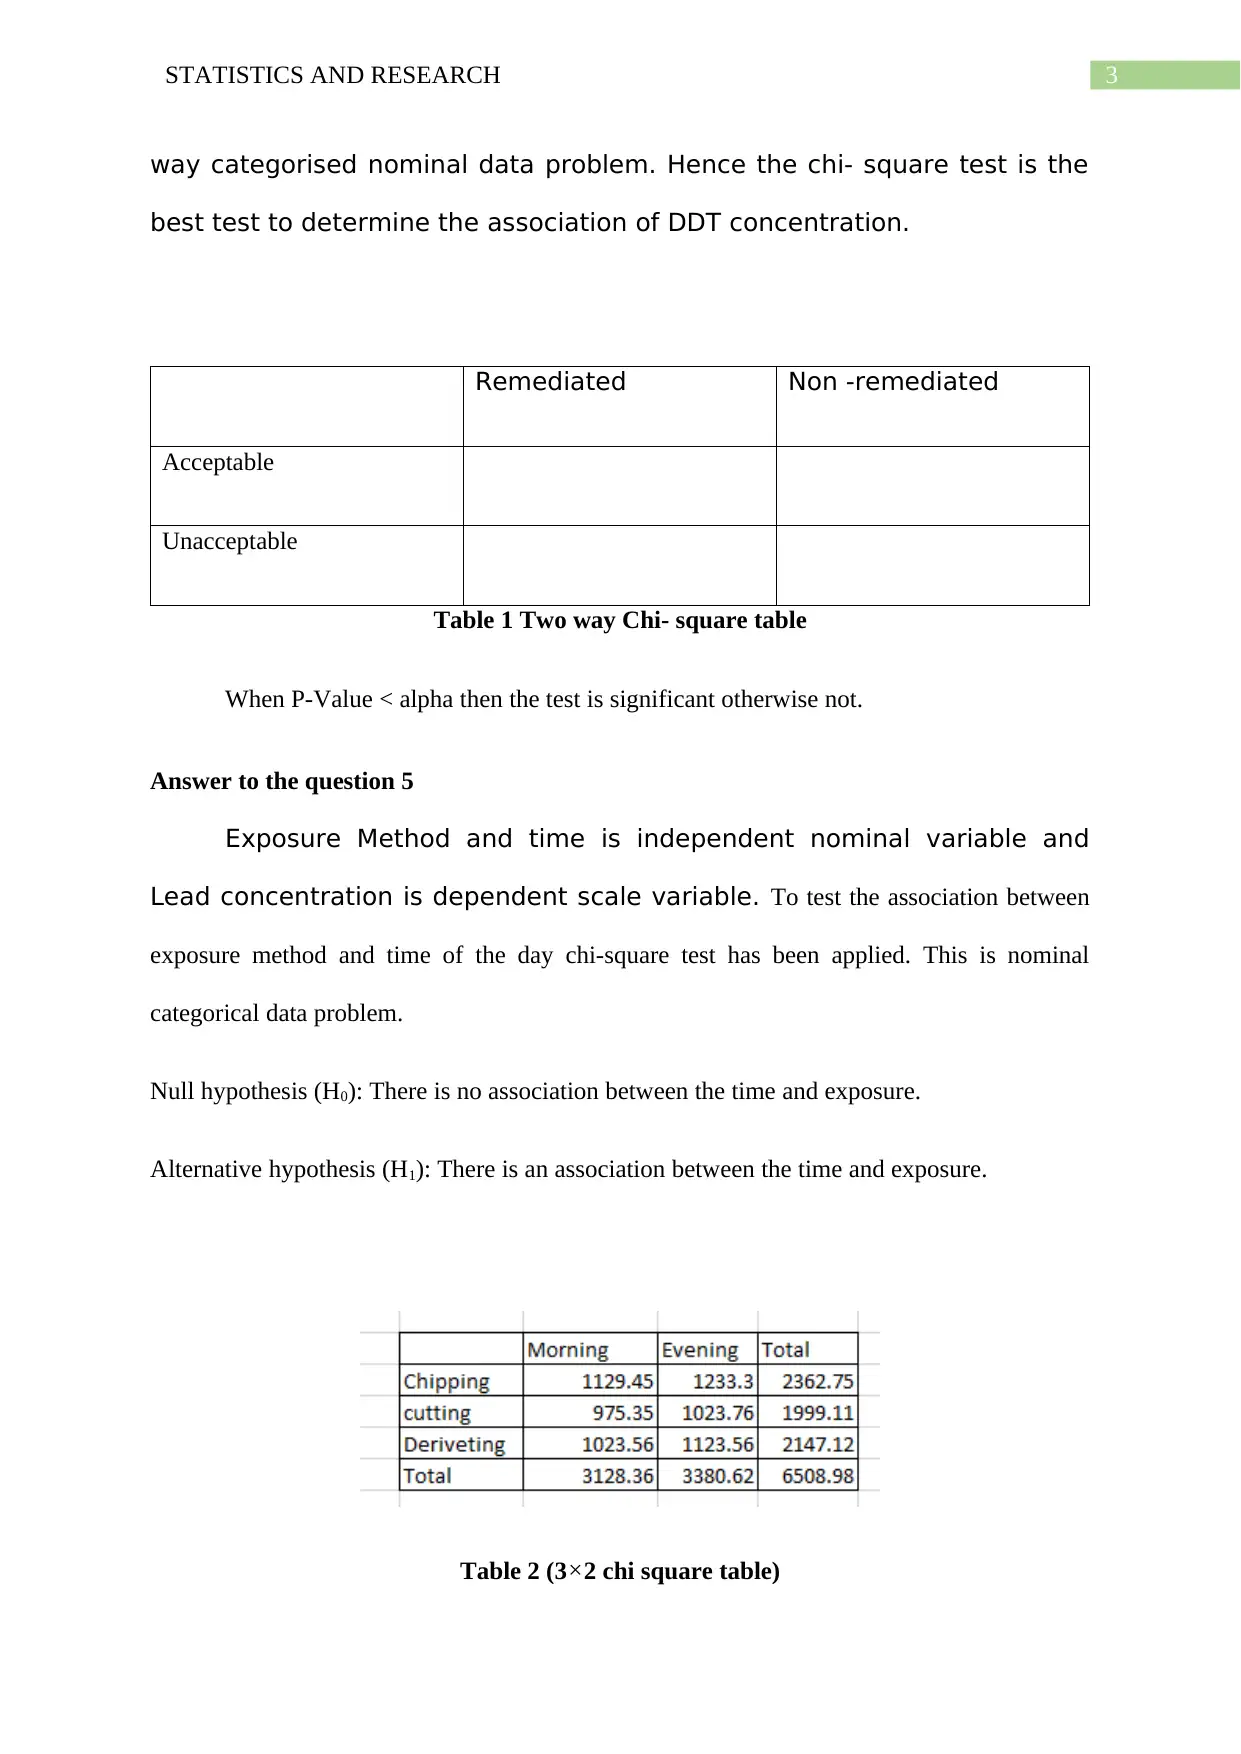
Homework Assignment
AI Summary
This assignment solution addresses several statistical problems, identifying independent and dependent variables and the appropriate statistical tests to apply. The assignment covers a range of scenarios, including comparing safety performance between plants using t-tests, predicting flow rates using regression and correlation, analyzing cleaning product effectiveness with ANOVA, assessing DDT concentration using chi-square tests, evaluating the association between exposure methods and lead concentration using chi-square test, and analyzing the impact of scrubber technology on pollutant levels. The solution provides detailed explanations of the variables' formats (nominal, ordinal, and scale) and justifies the selection of specific statistical tests for each problem. The document also includes a bibliography of relevant statistical resources.

1 out of 7
Related Documents


Your All-in-One AI-Powered Toolkit for Academic Success.
+13062052269
info@desklib.com
Available 24*7 on WhatsApp / Email
![[object Object]](/_next/static/media/star-bottom.7253800d.svg)
Copyright © 2020–2026 A2Z Services. All Rights Reserved. Developed and managed by ZUCOL.