Statistics and Research Methods in Business Decision Making Assignment
VerifiedAdded on 2022/12/29
|14
|1681
|39
Homework Assignment
AI Summary
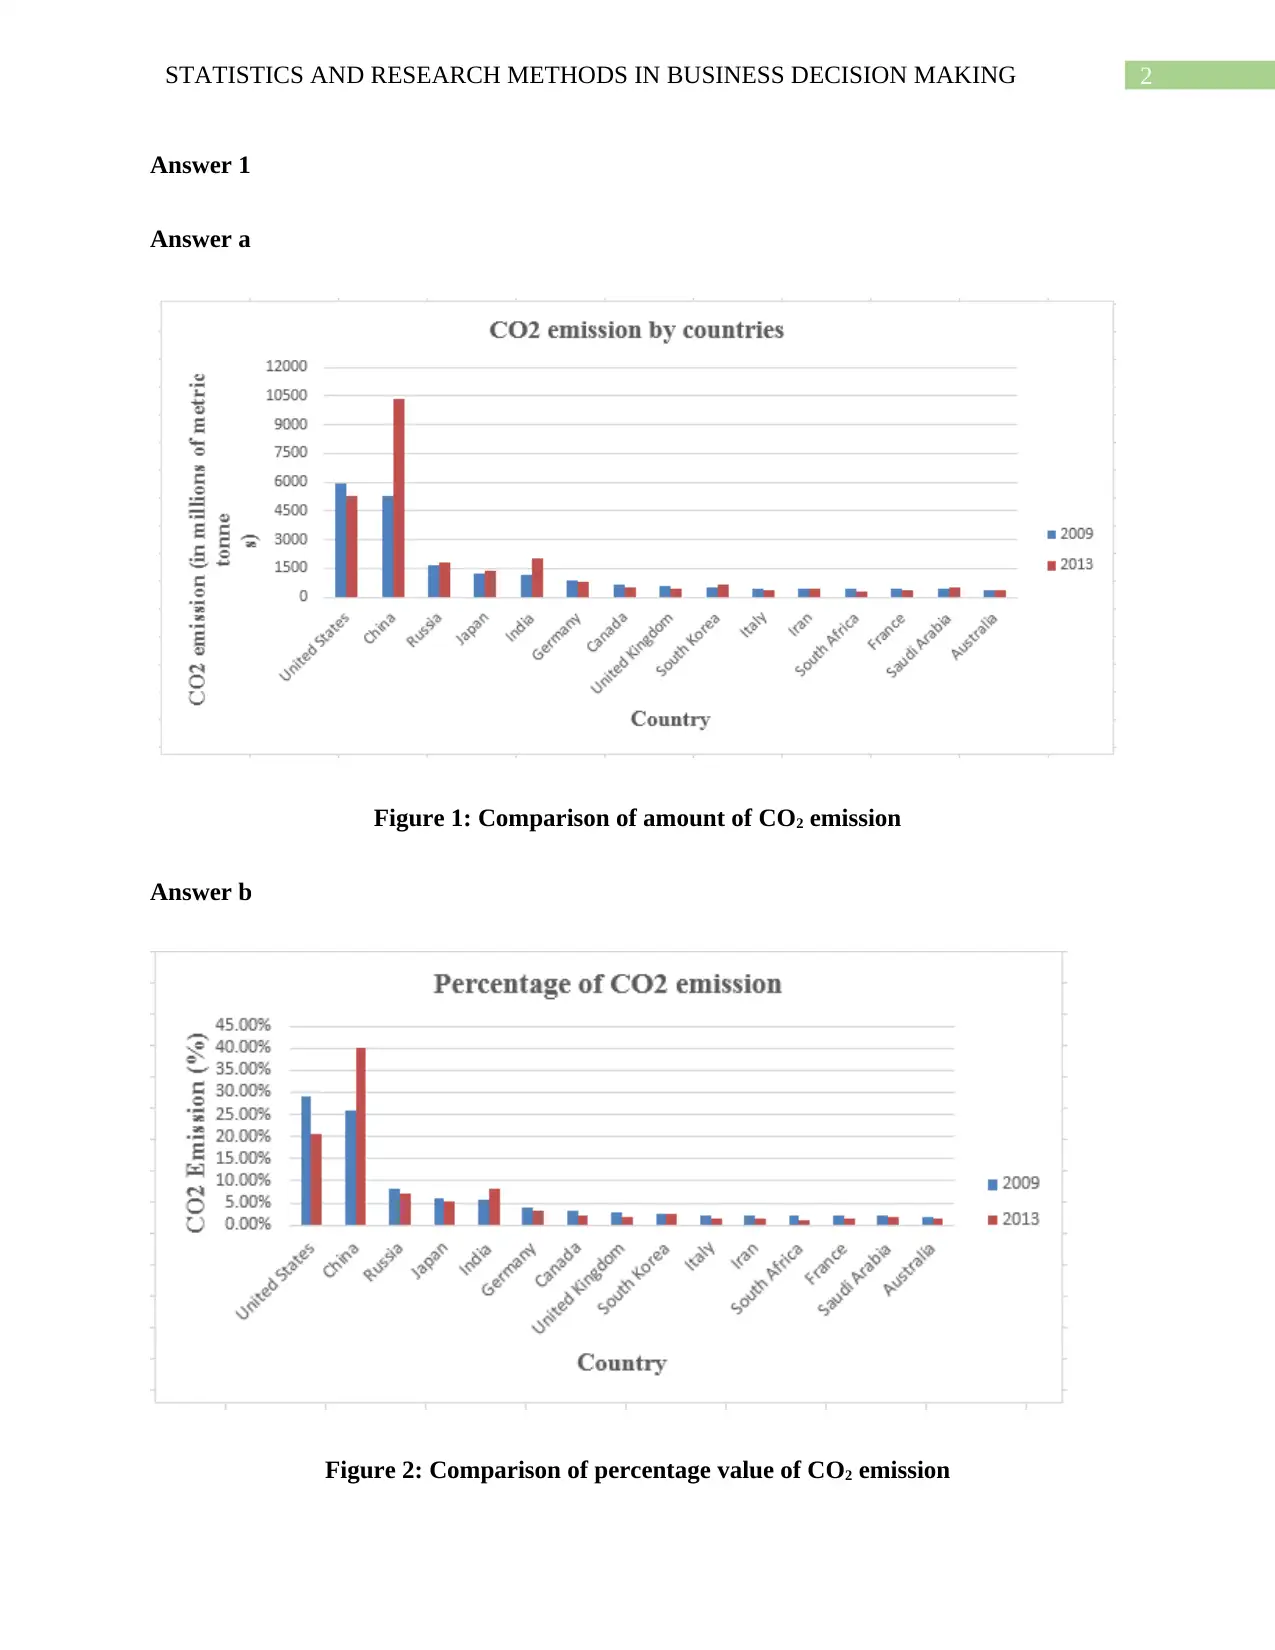
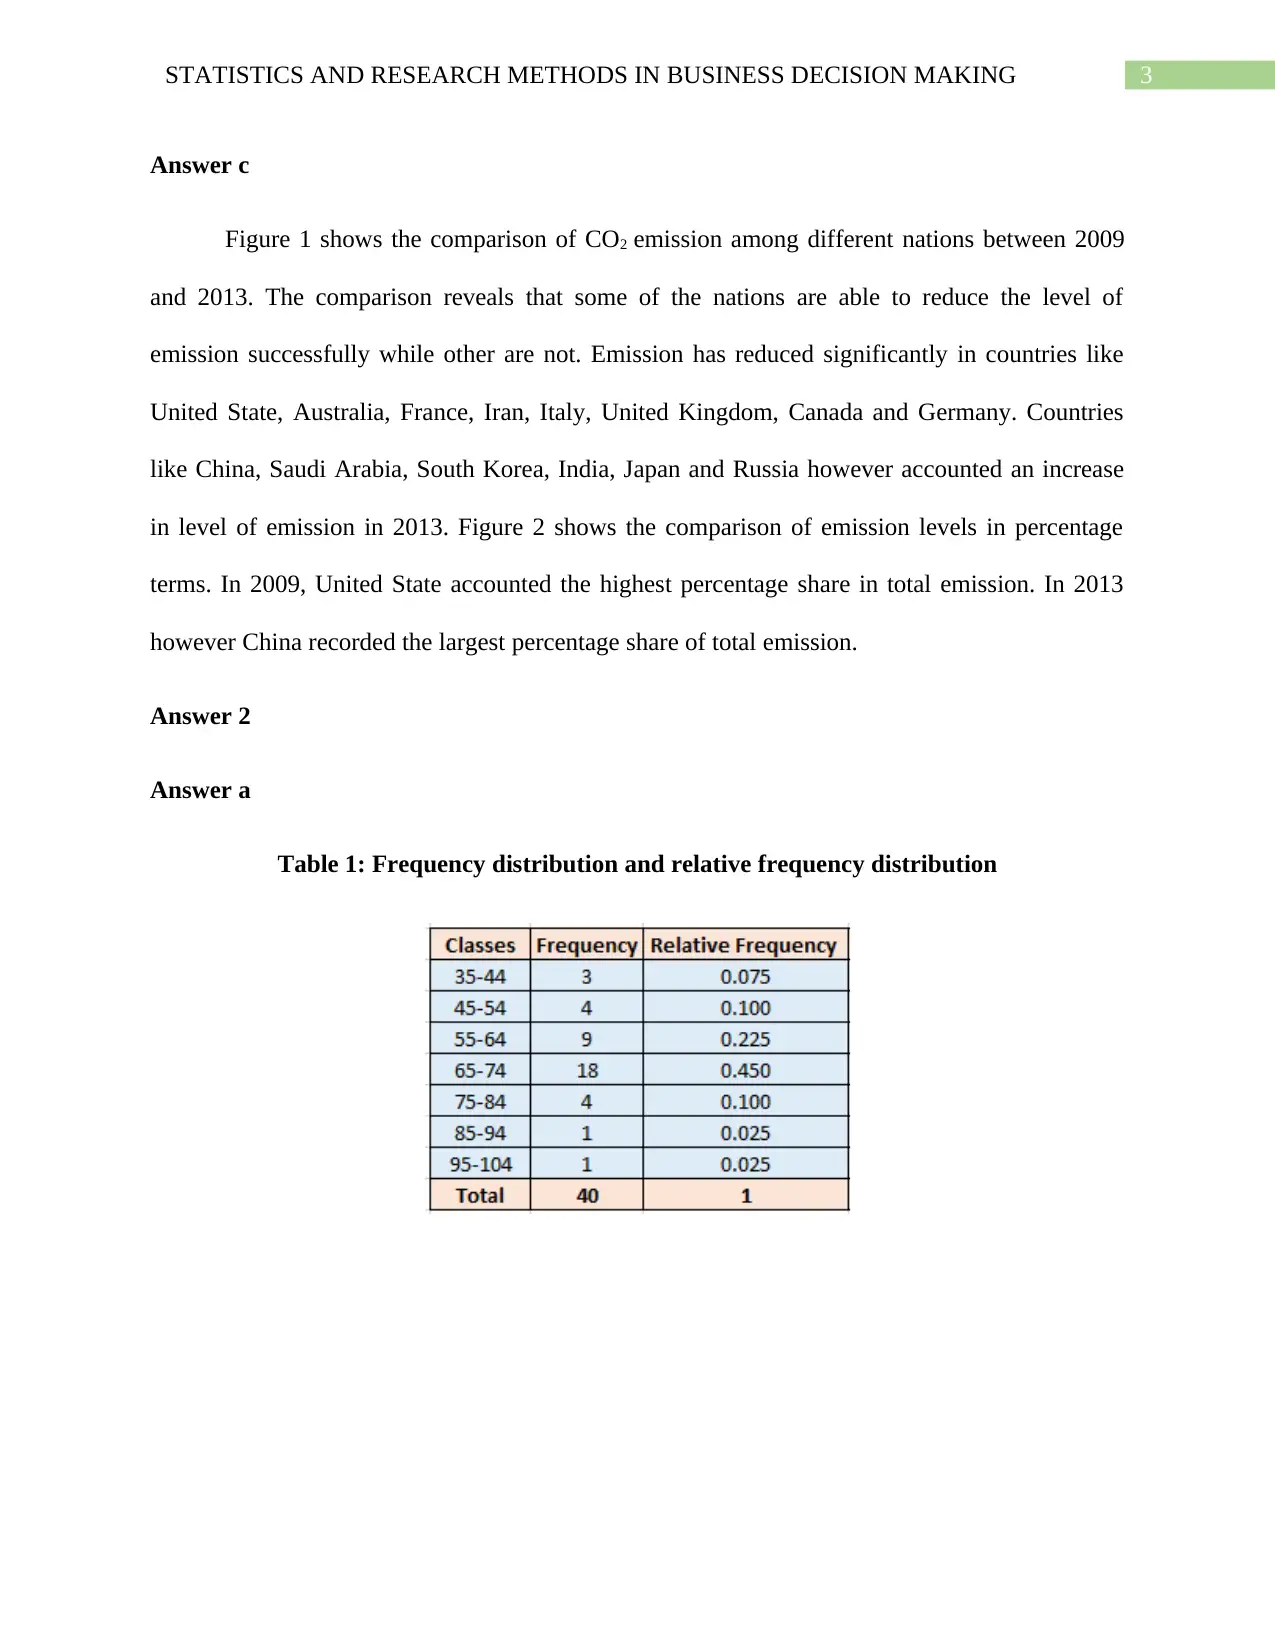
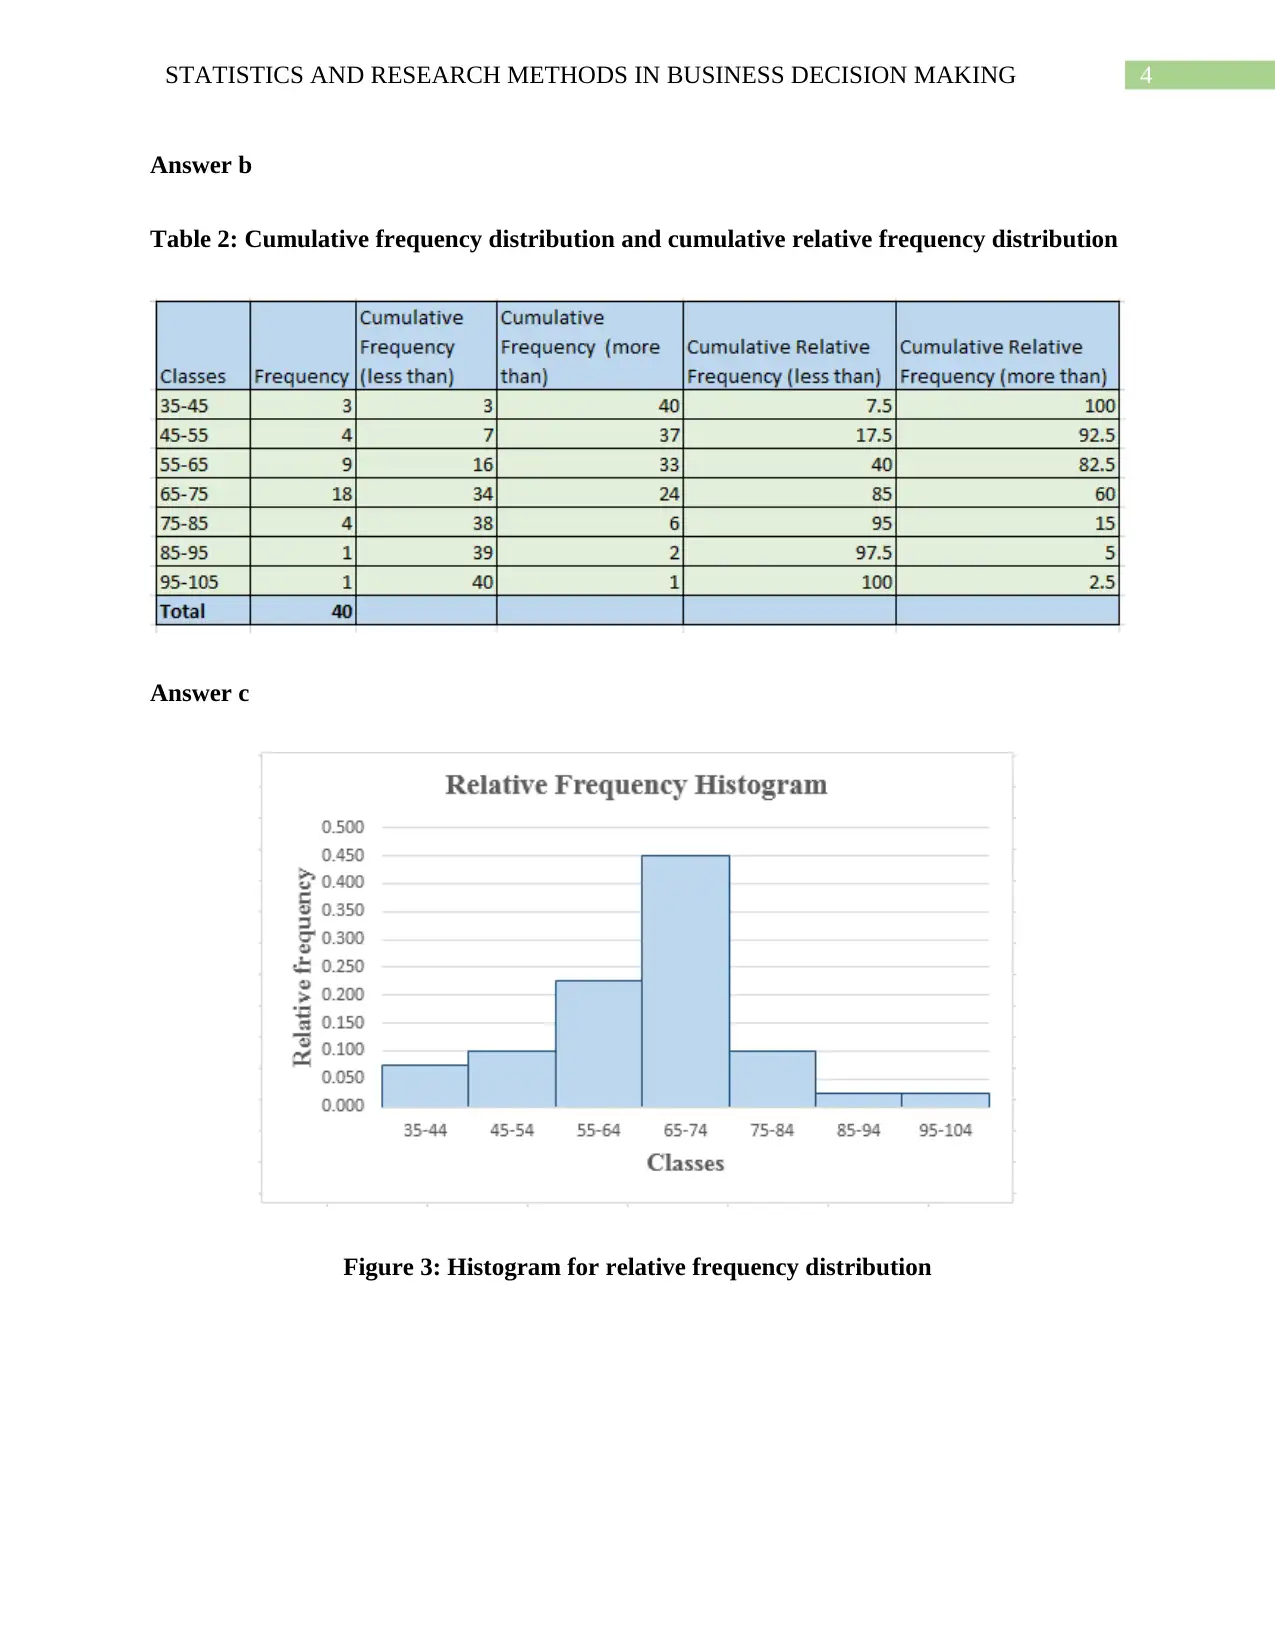
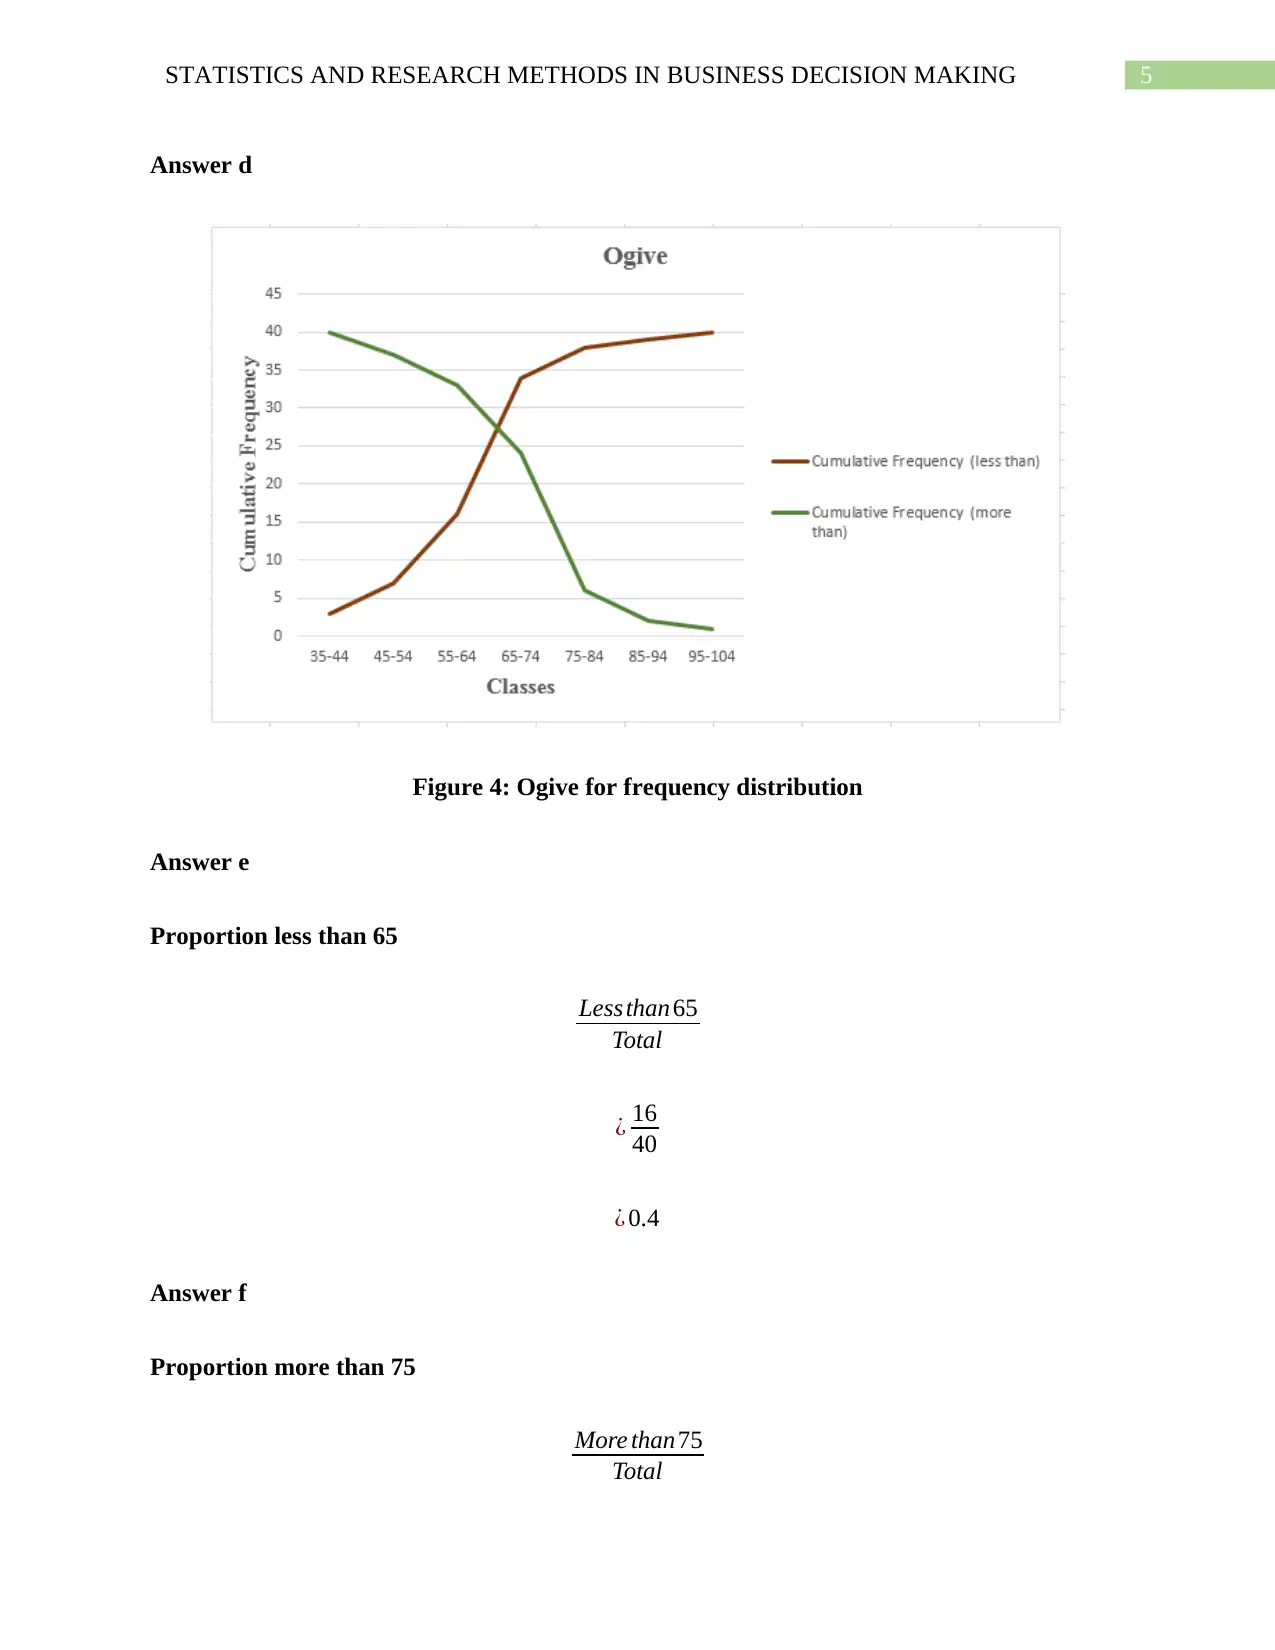
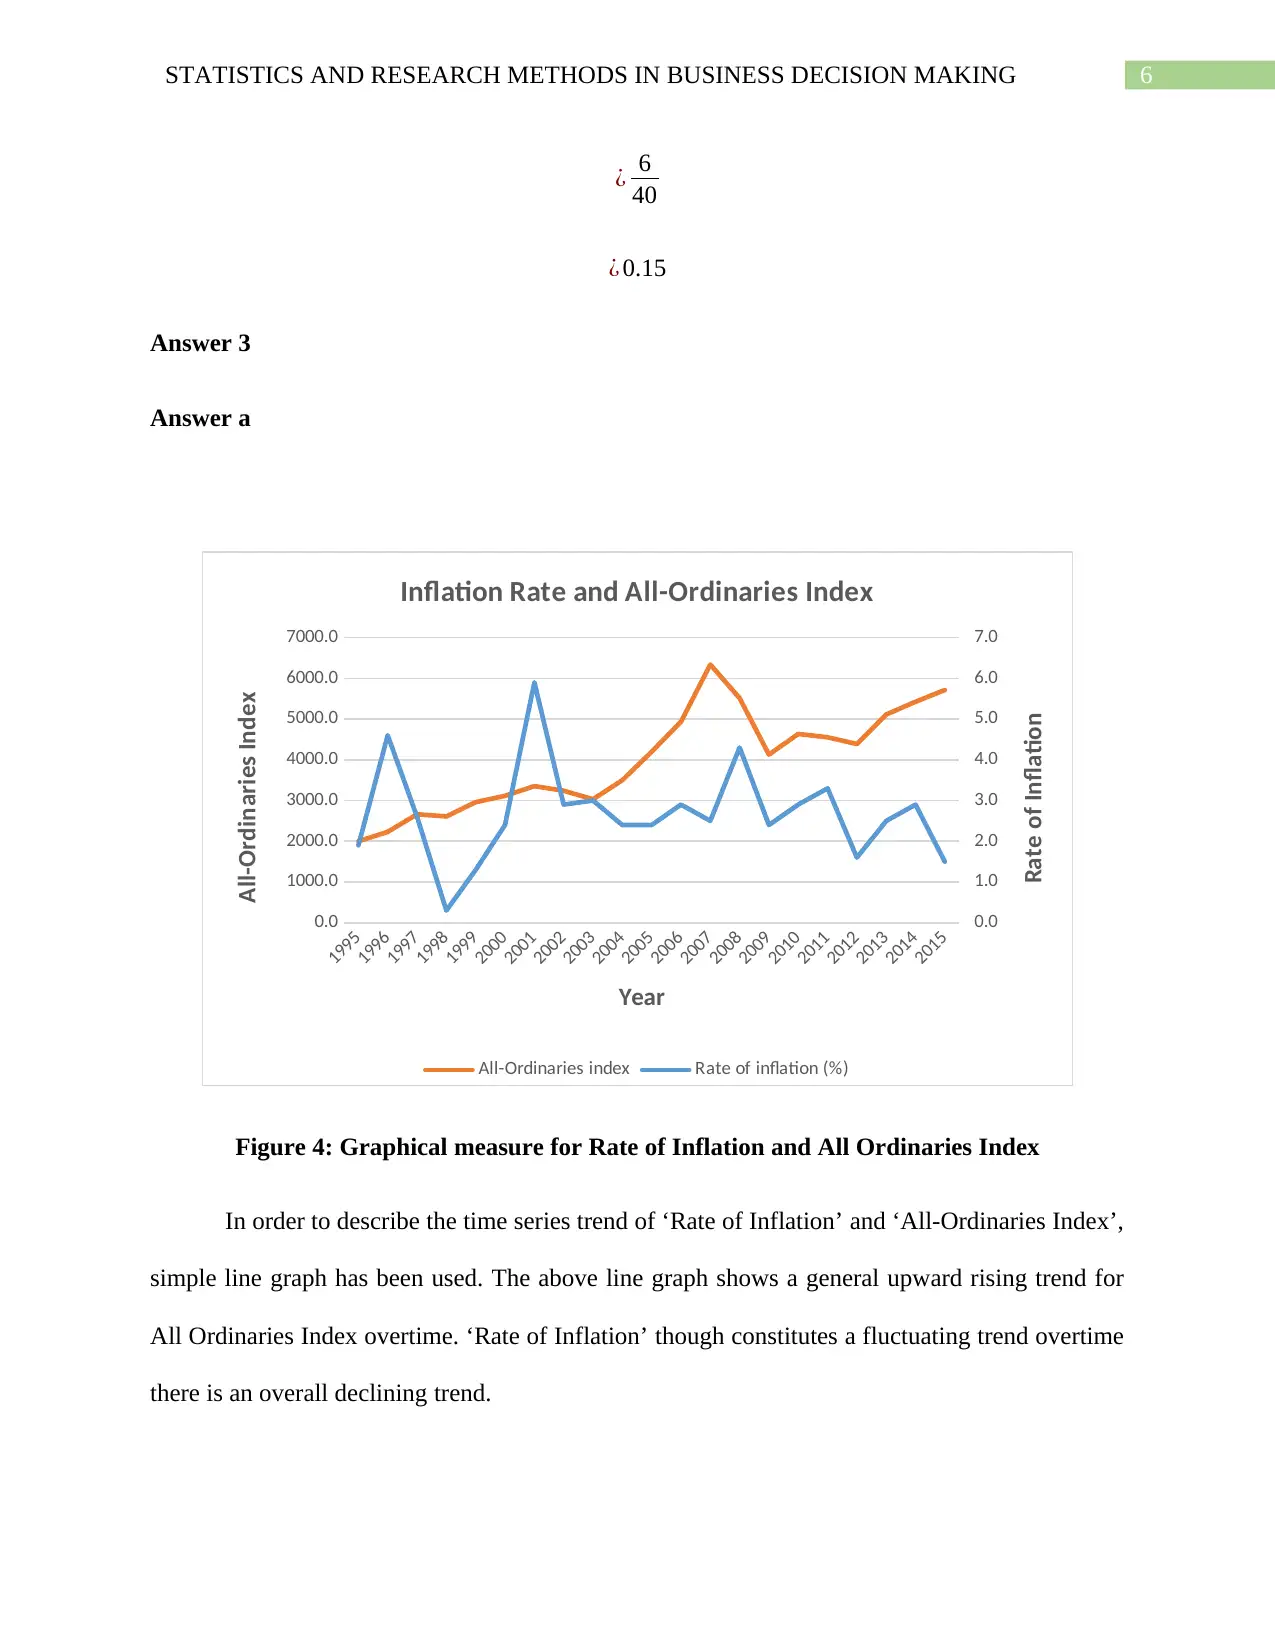
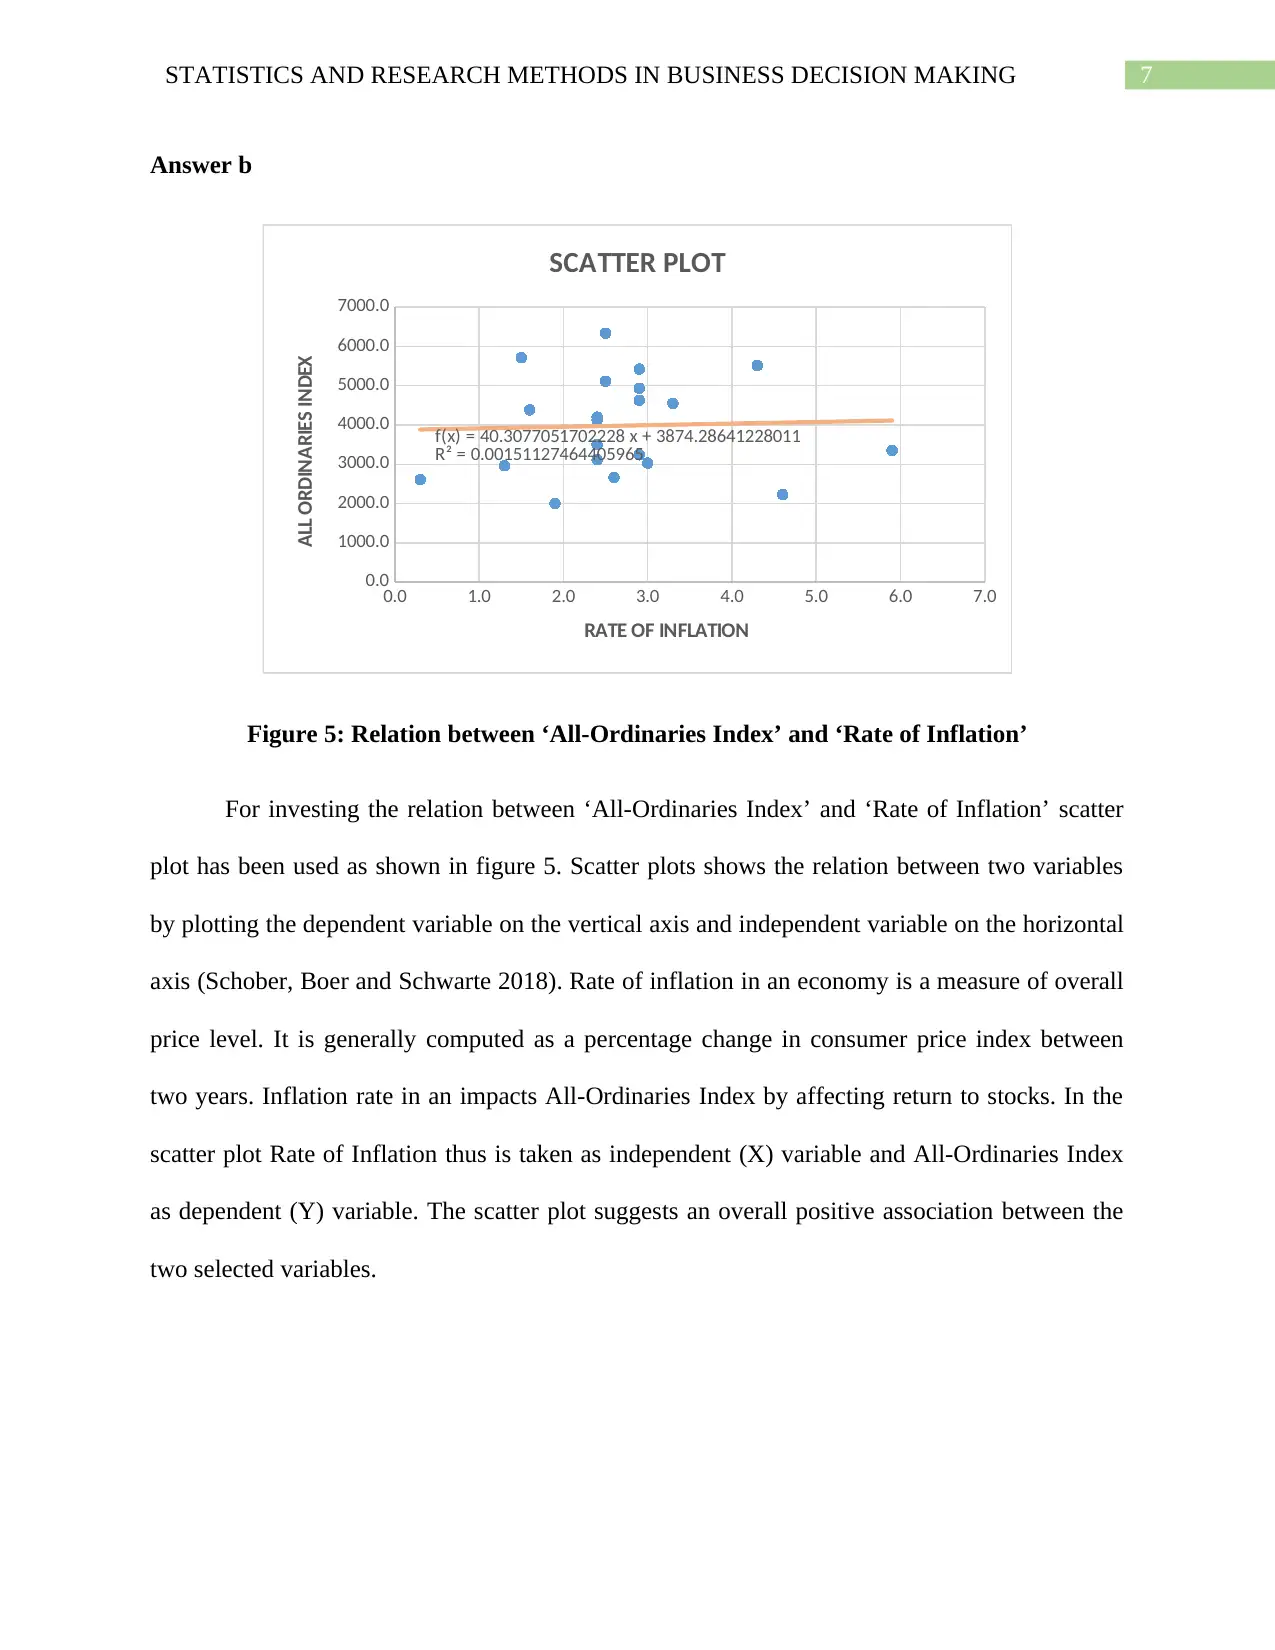
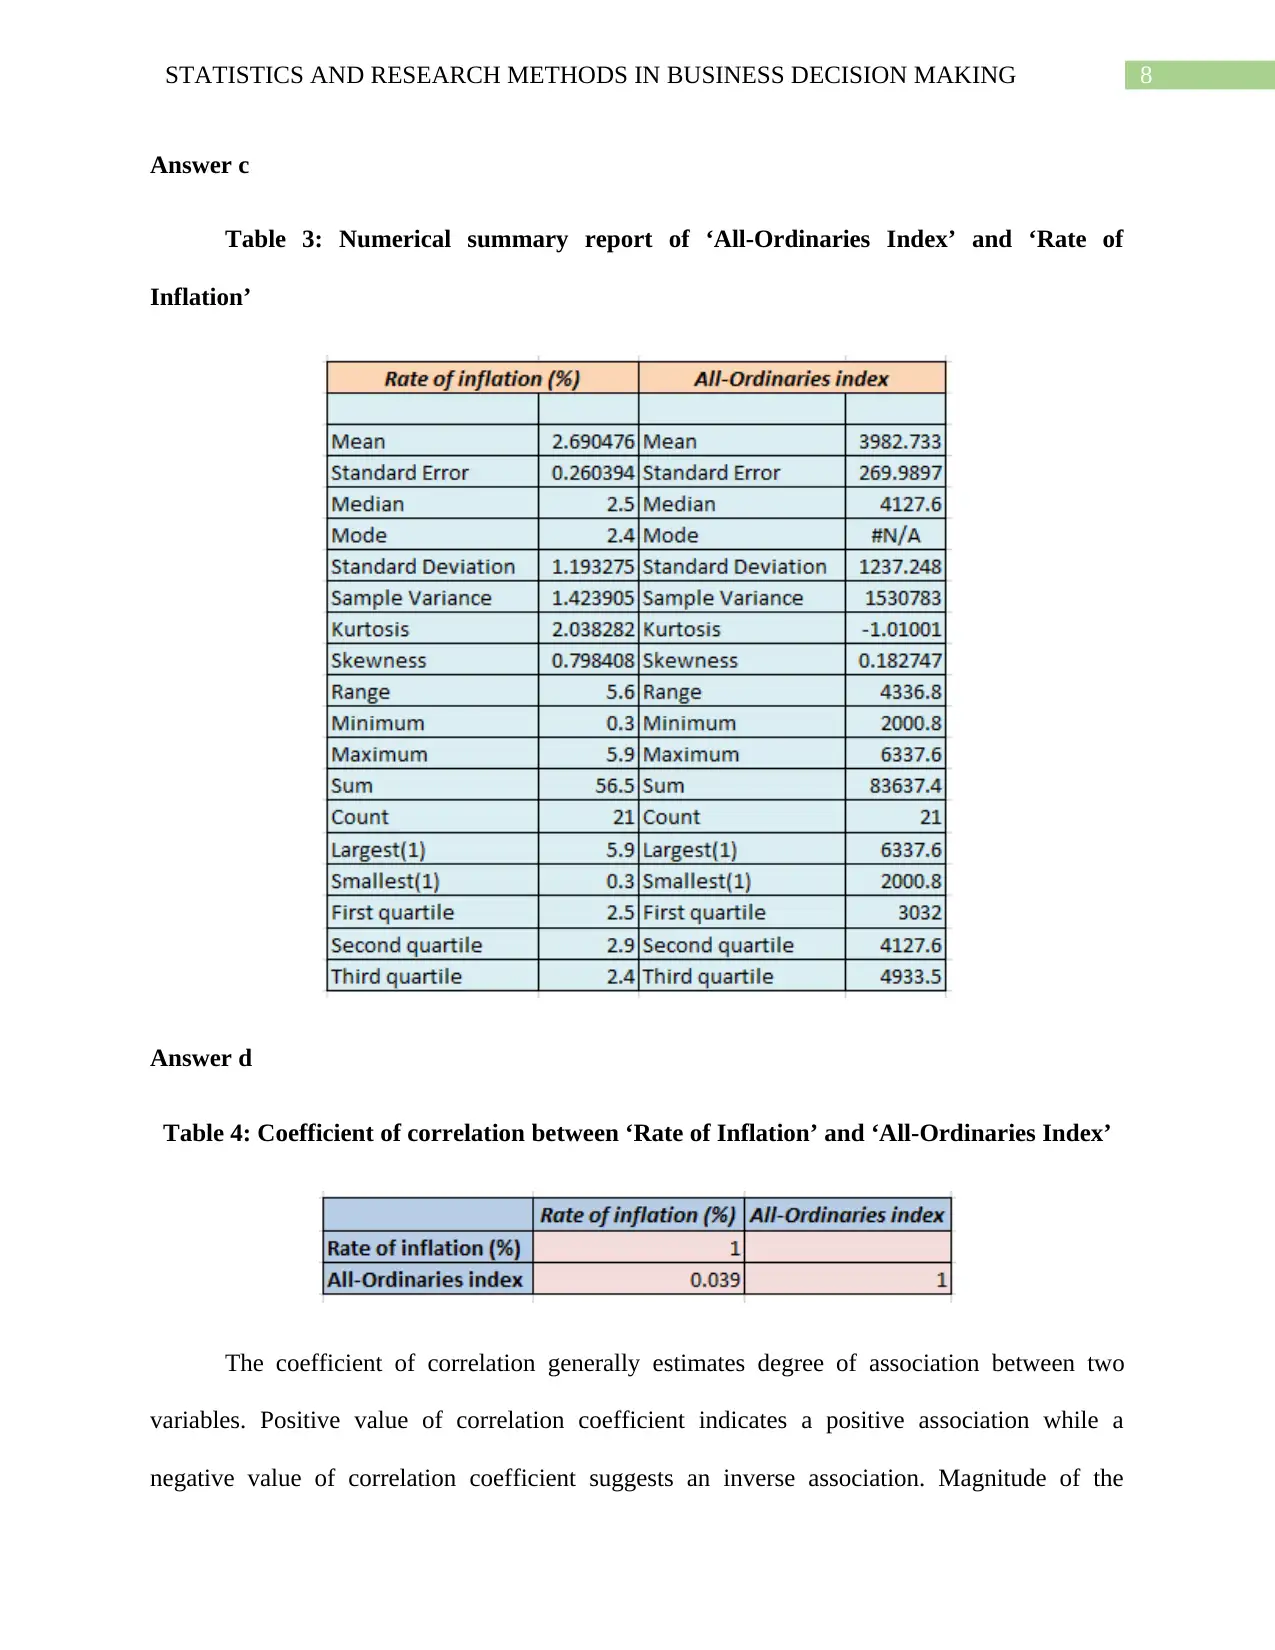
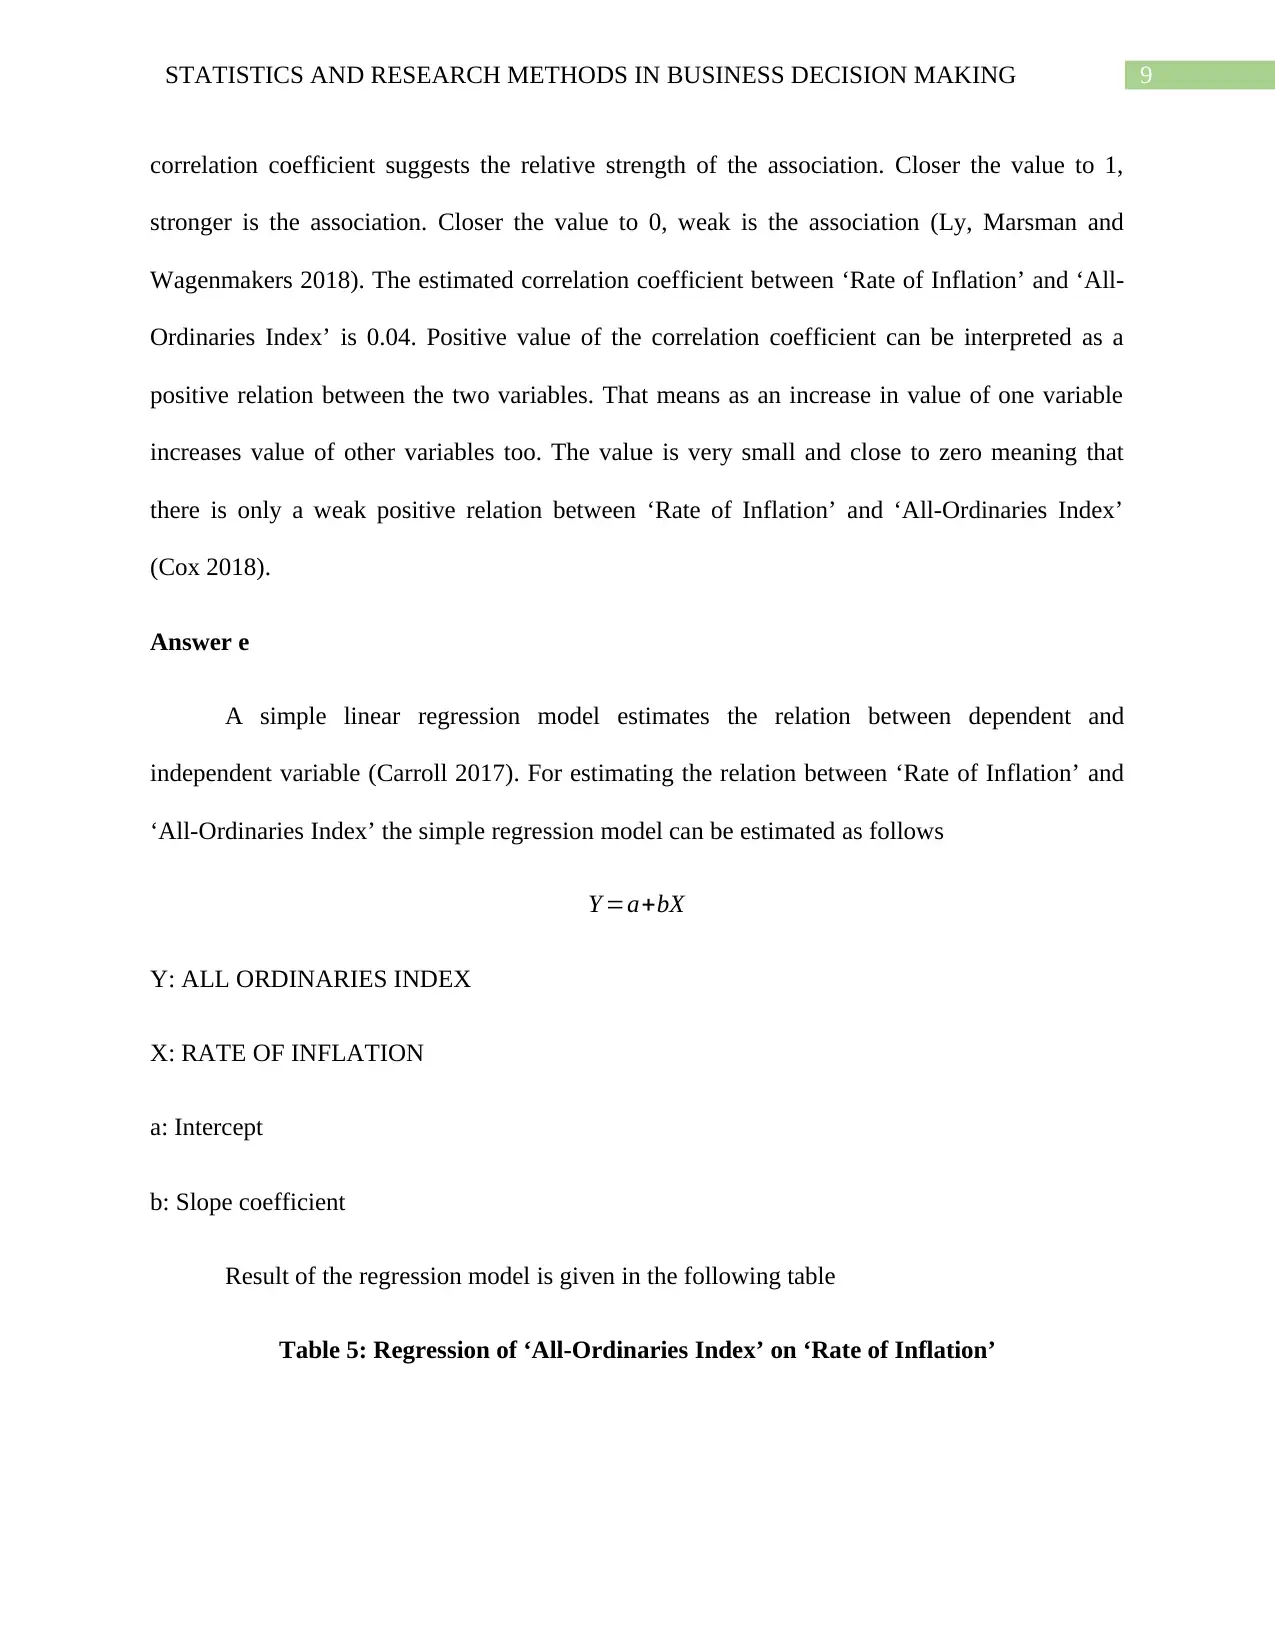
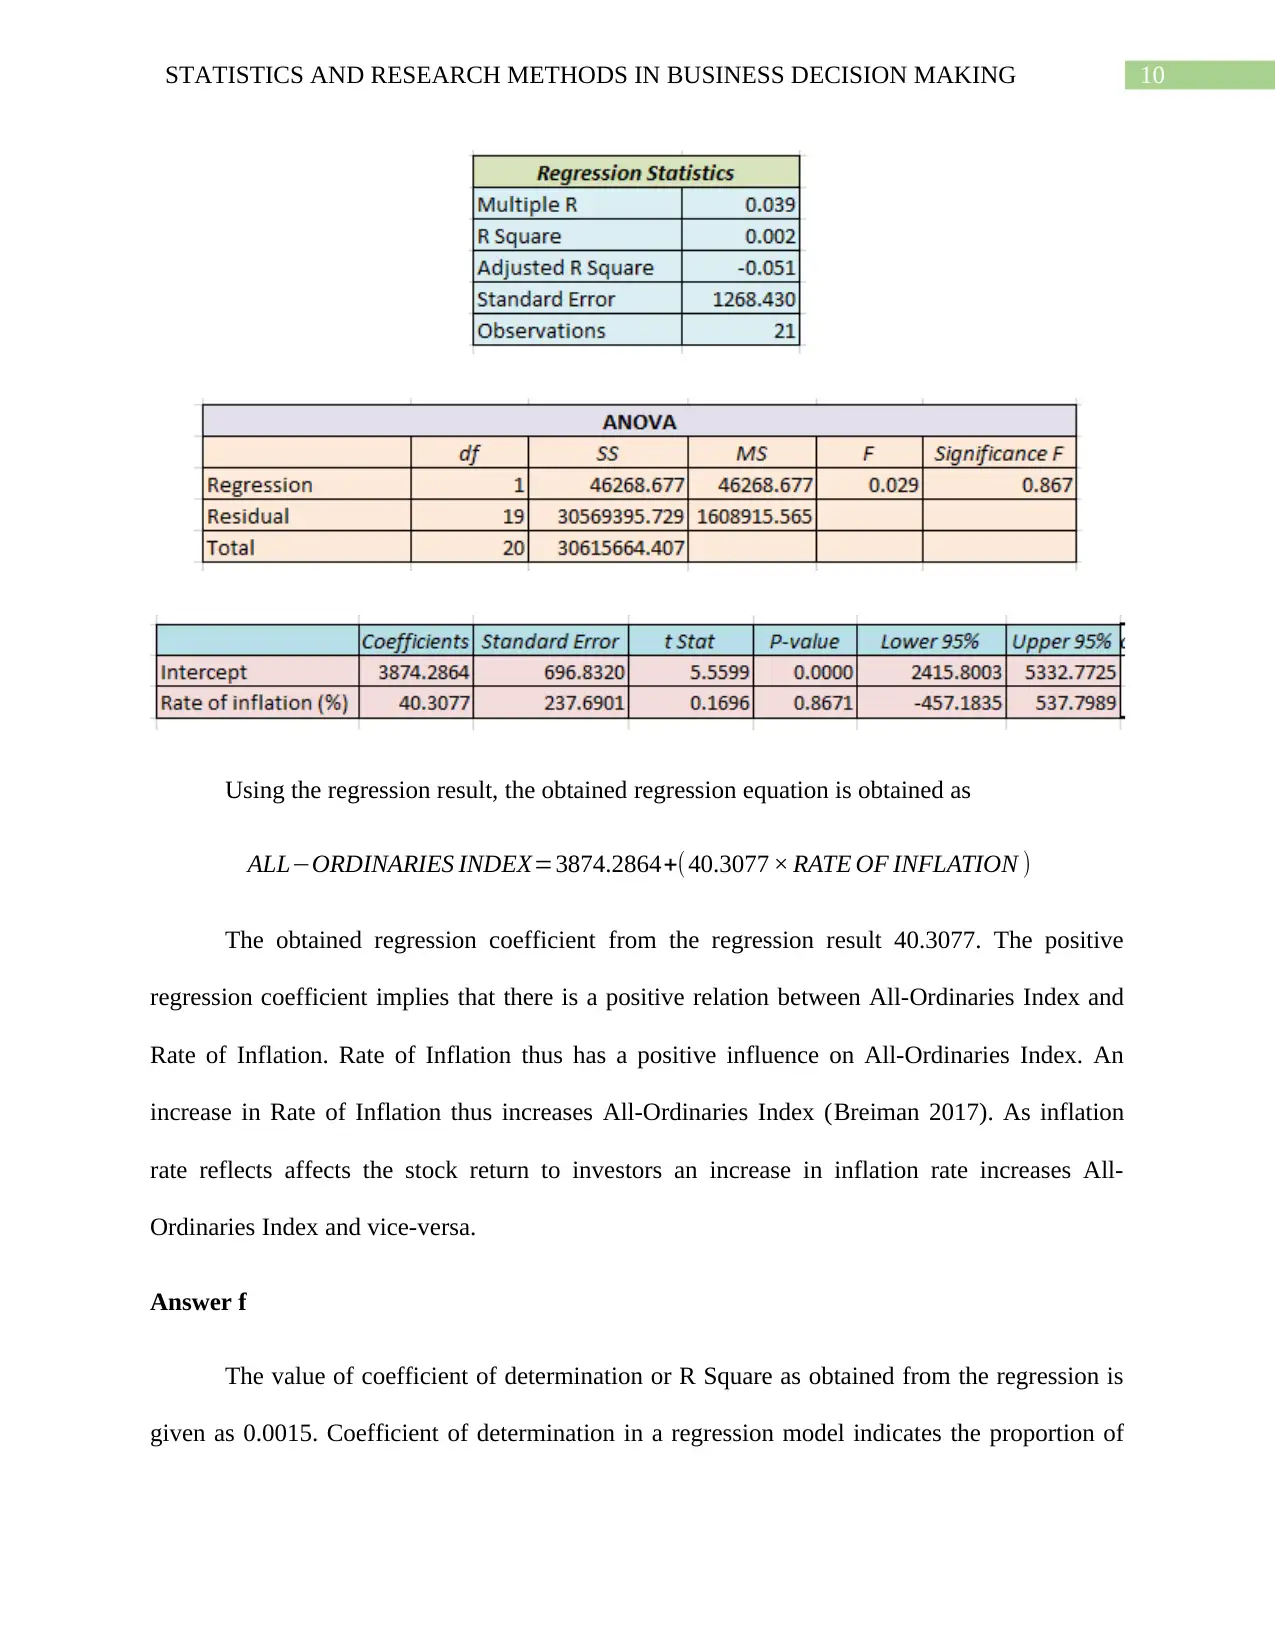
This assignment delves into the application of statistical and research methods in the context of business decision-making. The assignment presents several problems, including the comparison of CO2 emissions across different nations, involving data visualization through figures and tables to illustrate trends and patterns. It also incorporates frequency distributions, cumulative frequency distributions, histograms, and ogives. Furthermore, the assignment explores the relationship between the All-Ordinaries Index and the rate of inflation using scatter plots, numerical summaries, correlation coefficients, and regression analysis. It discusses the interpretation of regression coefficients, coefficients of determination (R-squared), and statistical significance. The analysis includes a detailed examination of the relationship between inflation and the All-Ordinaries Index, providing insights into their correlation and the model's goodness of fit. The student has demonstrated an understanding of statistical techniques and their application to real-world business scenarios.

Running head: STATISTICS AND RESEARCH METHODS IN BUSINESS DECISION
MAKING
Statistics and Research Methods in Business Decision Making
Name of the Student
Name of the University
Course ID
MAKING
Statistics and Research Methods in Business Decision Making
Name of the Student
Name of the University
Course ID
Paraphrase This Document
Need a fresh take? Get an instant paraphrase of this document with our AI Paraphraser

1STATISTICS AND RESEARCH METHODS IN BUSINESS DECISION MAKING
Table of Contents
Answer 1..........................................................................................................................................2
Answer a......................................................................................................................................2
Answer b......................................................................................................................................2
Answer c......................................................................................................................................3
Answer 2..........................................................................................................................................3
Answer a......................................................................................................................................3
Answer b......................................................................................................................................4
Answer c......................................................................................................................................4
Answer d......................................................................................................................................5
Answer e......................................................................................................................................5
Answer f.......................................................................................................................................5
Answer 3..........................................................................................................................................6
Answer a......................................................................................................................................6
Answer b......................................................................................................................................7
Answer c......................................................................................................................................8
Answer d......................................................................................................................................9
Answer e....................................................................................................................................10
Answer f.....................................................................................................................................11
Answer g....................................................................................................................................12
Answer h....................................................................................................................................12
References......................................................................................................................................13

2STATISTICS AND RESEARCH METHODS IN BUSINESS DECISION MAKING
Answer 1
Answer a
Figure 1: Comparison of amount of CO2 emission
Answer b
Figure 2: Comparison of percentage value of CO2 emission
Answer 1
Answer a
Figure 1: Comparison of amount of CO2 emission
Answer b
Figure 2: Comparison of percentage value of CO2 emission
⊘ This is a preview!⊘
Do you want full access?
Subscribe today to unlock all pages.

Trusted by 1+ million students worldwide

3STATISTICS AND RESEARCH METHODS IN BUSINESS DECISION MAKING
Answer c
Figure 1 shows the comparison of CO2 emission among different nations between 2009
and 2013. The comparison reveals that some of the nations are able to reduce the level of
emission successfully while other are not. Emission has reduced significantly in countries like
United State, Australia, France, Iran, Italy, United Kingdom, Canada and Germany. Countries
like China, Saudi Arabia, South Korea, India, Japan and Russia however accounted an increase
in level of emission in 2013. Figure 2 shows the comparison of emission levels in percentage
terms. In 2009, United State accounted the highest percentage share in total emission. In 2013
however China recorded the largest percentage share of total emission.
Answer 2
Answer a
Table 1: Frequency distribution and relative frequency distribution
Paraphrase This Document
Need a fresh take? Get an instant paraphrase of this document with our AI Paraphraser

4STATISTICS AND RESEARCH METHODS IN BUSINESS DECISION MAKING
Answer b
Table 2: Cumulative frequency distribution and cumulative relative frequency distribution
Answer c
Figure 3: Histogram for relative frequency distribution
Answer b
Table 2: Cumulative frequency distribution and cumulative relative frequency distribution
Answer c
Figure 3: Histogram for relative frequency distribution

5STATISTICS AND RESEARCH METHODS IN BUSINESS DECISION MAKING
Answer d
Figure 4: Ogive for frequency distribution
Answer e
Proportion less than 65
Less than 65
Total
¿ 16
40
¿ 0.4
Answer f
Proportion more than 75
More than75
Total
Answer d
Figure 4: Ogive for frequency distribution
Answer e
Proportion less than 65
Less than 65
Total
¿ 16
40
¿ 0.4
Answer f
Proportion more than 75
More than75
Total
⊘ This is a preview!⊘
Do you want full access?
Subscribe today to unlock all pages.

Trusted by 1+ million students worldwide

6STATISTICS AND RESEARCH METHODS IN BUSINESS DECISION MAKING
¿ 6
40
¿ 0.15
Answer 3
Answer a
1995
1996
1997
1998
1999
2000
2001
2002
2003
2004
2005
2006
2007
2008
2009
2010
2011
2012
2013
2014
2015
0.0
1000.0
2000.0
3000.0
4000.0
5000.0
6000.0
7000.0
0.0
1.0
2.0
3.0
4.0
5.0
6.0
7.0
Inflation Rate and All-Ordinaries Index
All-Ordinaries index Rate of inflation (%)
Year
All-Ordinaries Index
Rate of Inflation
Figure 4: Graphical measure for Rate of Inflation and All Ordinaries Index
In order to describe the time series trend of ‘Rate of Inflation’ and ‘All-Ordinaries Index’,
simple line graph has been used. The above line graph shows a general upward rising trend for
All Ordinaries Index overtime. ‘Rate of Inflation’ though constitutes a fluctuating trend overtime
there is an overall declining trend.
Paraphrase This Document
Need a fresh take? Get an instant paraphrase of this document with our AI Paraphraser

7STATISTICS AND RESEARCH METHODS IN BUSINESS DECISION MAKING
Answer b
0.0 1.0 2.0 3.0 4.0 5.0 6.0 7.0
0.0
1000.0
2000.0
3000.0
4000.0
5000.0
6000.0
7000.0
f(x) = 40.3077051702228 x + 3874.28641228011
R² = 0.00151127464405965
SCATTER PLOT
RATE OF INFLATION
ALL ORDINARIES INDEX
Figure 5: Relation between ‘All-Ordinaries Index’ and ‘Rate of Inflation’
For investing the relation between ‘All-Ordinaries Index’ and ‘Rate of Inflation’ scatter
plot has been used as shown in figure 5. Scatter plots shows the relation between two variables
by plotting the dependent variable on the vertical axis and independent variable on the horizontal
axis (Schober, Boer and Schwarte 2018). Rate of inflation in an economy is a measure of overall
price level. It is generally computed as a percentage change in consumer price index between
two years. Inflation rate in an impacts All-Ordinaries Index by affecting return to stocks. In the
scatter plot Rate of Inflation thus is taken as independent (X) variable and All-Ordinaries Index
as dependent (Y) variable. The scatter plot suggests an overall positive association between the
two selected variables.

8STATISTICS AND RESEARCH METHODS IN BUSINESS DECISION MAKING
Answer c
Table 3: Numerical summary report of ‘All-Ordinaries Index’ and ‘Rate of
Inflation’
Answer d
Table 4: Coefficient of correlation between ‘Rate of Inflation’ and ‘All-Ordinaries Index’
The coefficient of correlation generally estimates degree of association between two
variables. Positive value of correlation coefficient indicates a positive association while a
negative value of correlation coefficient suggests an inverse association. Magnitude of the
⊘ This is a preview!⊘
Do you want full access?
Subscribe today to unlock all pages.

Trusted by 1+ million students worldwide

9STATISTICS AND RESEARCH METHODS IN BUSINESS DECISION MAKING
correlation coefficient suggests the relative strength of the association. Closer the value to 1,
stronger is the association. Closer the value to 0, weak is the association (Ly, Marsman and
Wagenmakers 2018). The estimated correlation coefficient between ‘Rate of Inflation’ and ‘All-
Ordinaries Index’ is 0.04. Positive value of the correlation coefficient can be interpreted as a
positive relation between the two variables. That means as an increase in value of one variable
increases value of other variables too. The value is very small and close to zero meaning that
there is only a weak positive relation between ‘Rate of Inflation’ and ‘All-Ordinaries Index’
(Cox 2018).
Answer e
A simple linear regression model estimates the relation between dependent and
independent variable (Carroll 2017). For estimating the relation between ‘Rate of Inflation’ and
‘All-Ordinaries Index’ the simple regression model can be estimated as follows
Y =a+bX
Y: ALL ORDINARIES INDEX
X: RATE OF INFLATION
a: Intercept
b: Slope coefficient
Result of the regression model is given in the following table
Table 5: Regression of ‘All-Ordinaries Index’ on ‘Rate of Inflation’
Paraphrase This Document
Need a fresh take? Get an instant paraphrase of this document with our AI Paraphraser

10STATISTICS AND RESEARCH METHODS IN BUSINESS DECISION MAKING
Using the regression result, the obtained regression equation is obtained as
ALL−ORDINARIES INDEX=3874.2864+(40.3077 × RATE OF INFLATION )
The obtained regression coefficient from the regression result 40.3077. The positive
regression coefficient implies that there is a positive relation between All-Ordinaries Index and
Rate of Inflation. Rate of Inflation thus has a positive influence on All-Ordinaries Index. An
increase in Rate of Inflation thus increases All-Ordinaries Index (Breiman 2017). As inflation
rate reflects affects the stock return to investors an increase in inflation rate increases All-
Ordinaries Index and vice-versa.
Answer f
The value of coefficient of determination or R Square as obtained from the regression is
given as 0.0015. Coefficient of determination in a regression model indicates the proportion of

11STATISTICS AND RESEARCH METHODS IN BUSINESS DECISION MAKING
variation in the dependent variable as explained by the independent variable. Higher the value of
coefficient of determination good fit the model is (Henseler and Sarstedt 2013). Here the R
square value can be interpreted as changes in Rate of Inflation accounts for 0.15 percent
variation in the change in All-Ordinaries Index. As Rate of Inflation accounts for a very small
variation in All-Ordinaries Index, the model is not a good fit model.
Answer g
Statistical significance of the relationship between All-Ordinaries Index and Rate of
Inflation depends on statistical significance of the regression coefficient. The statistical
significance of Rate of Inflation can be tested by using the associated p value. Obtained p value
for the regression coefficient is 0.8671. The chosen level of significance value is 0.05. P value
for the coefficient is greater than the corresponding significance value (Hoffmann and Shafer
2015). This in turn indicates acceptance of null hypothesis of no significant association between
All-Ordinaries Index and Rate of Inflation. Rate of Inflation thus is not a statistically significant
determinant of All-Ordinaries Index.
Answer h
The estimates of standard error for the regression coefficient is 237.690. Estimated
standard error of a regression coefficient indicates a measure of goodness of fit by measuring
average deviation between actual value of the observation and that obtained from the fitted
model. Lower the deviation better fit the model is (Murteira and Ramalho 2016). The obtained
value of standard deviation shows that actual value deviates largely from fitted regression. The
relatively larger deviation in turn suggests the estimated model is not fitted good to the given
data set.
⊘ This is a preview!⊘
Do you want full access?
Subscribe today to unlock all pages.

Trusted by 1+ million students worldwide
1 out of 14
Related Documents
Your All-in-One AI-Powered Toolkit for Academic Success.
+13062052269
info@desklib.com
Available 24*7 on WhatsApp / Email
Unlock your academic potential
Copyright © 2020–2025 A2Z Services. All Rights Reserved. Developed and managed by ZUCOL.


