HI6007: Statistics and Research Methods Group Assignment Analysis

Verified

Added on  2022/10/10

|4
|379
|81
Homework Assignment
AI Summary
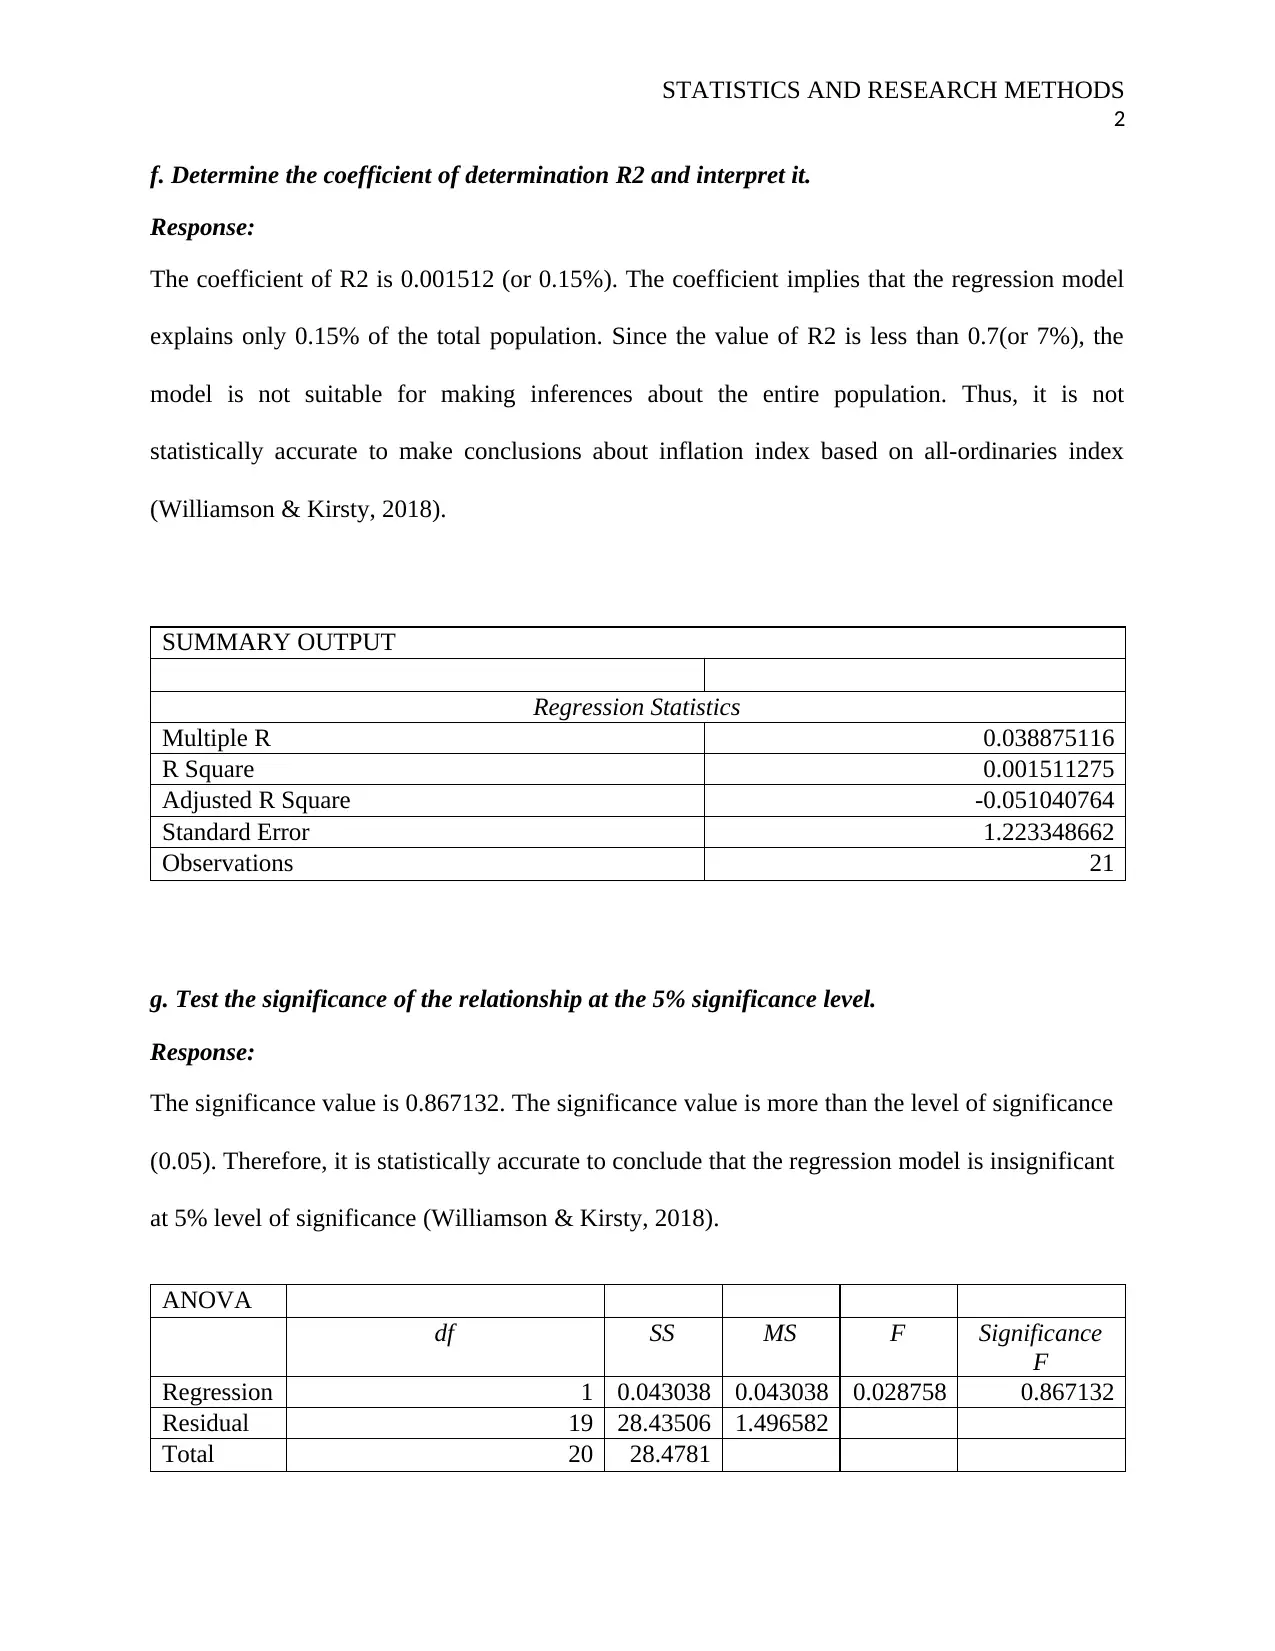
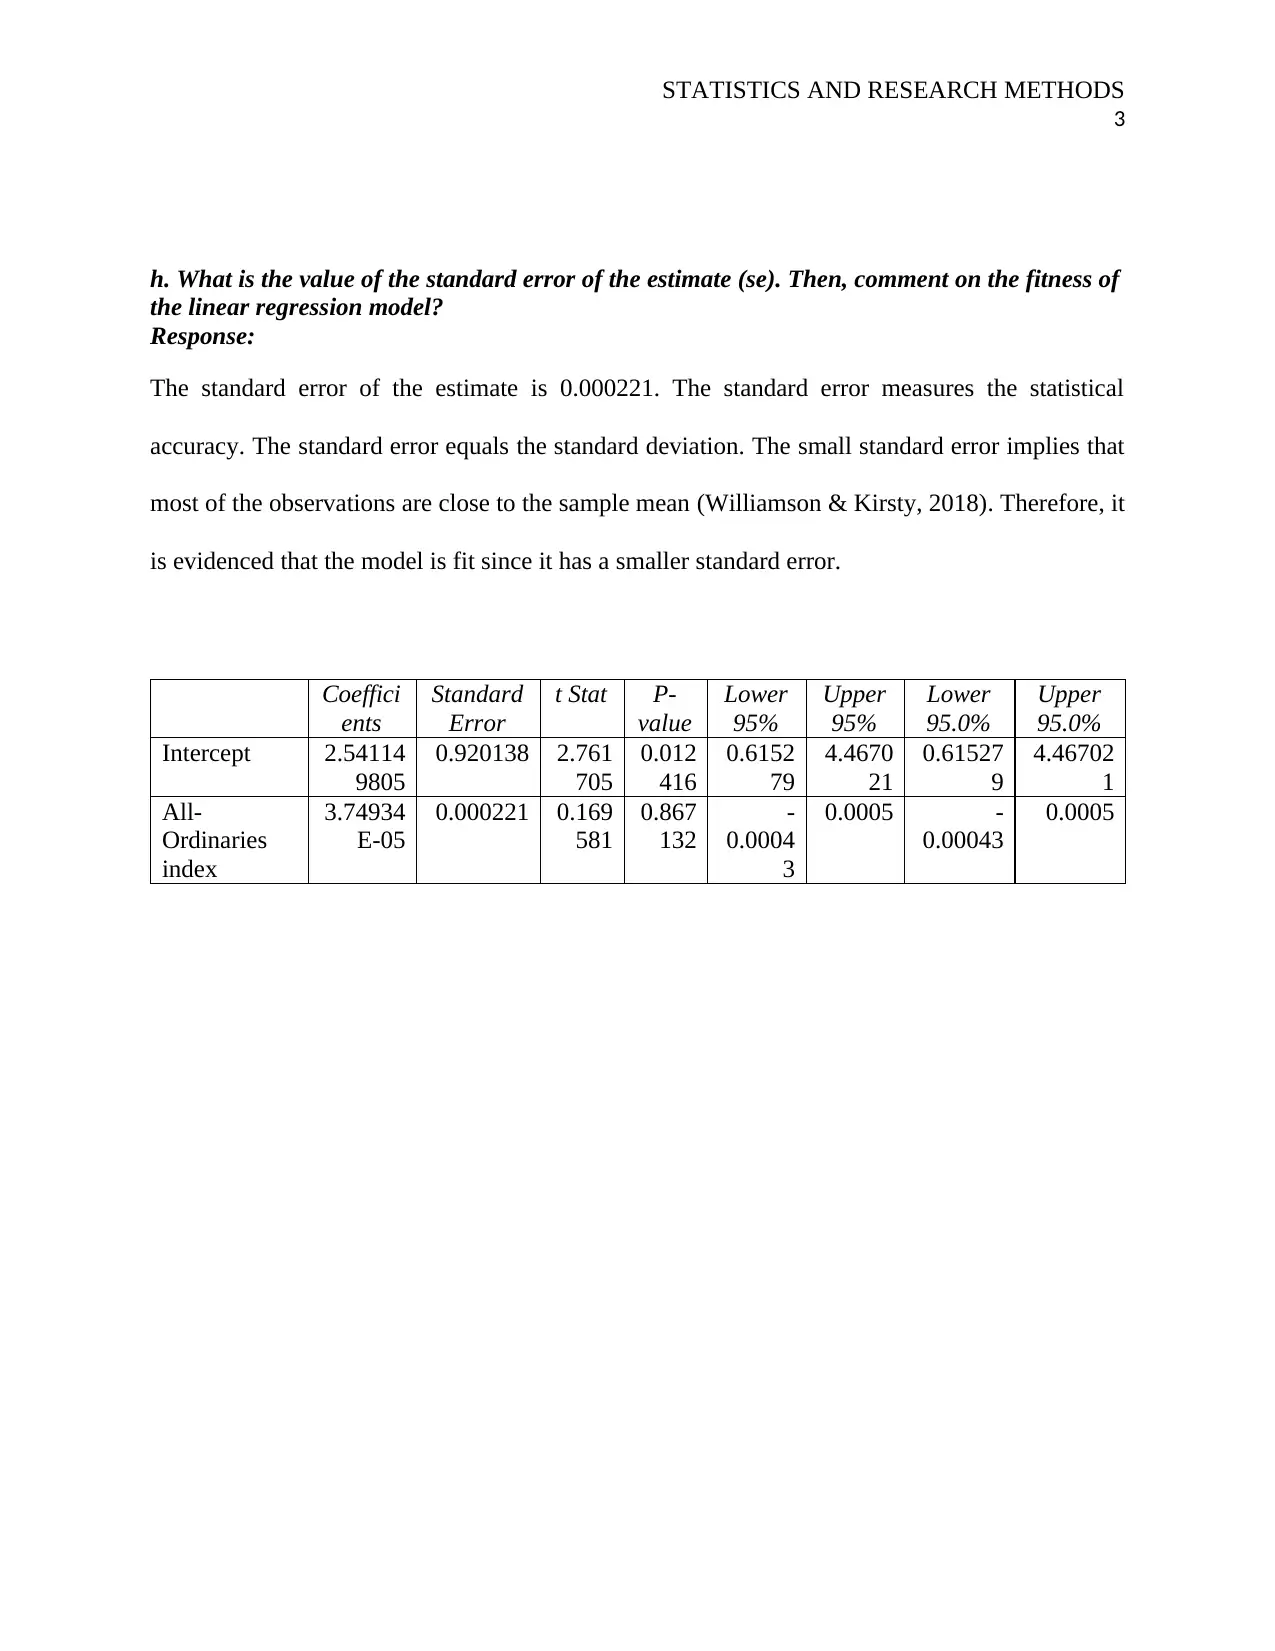
This document presents a completed group assignment for the HI6007 Statistics and Research Methods for Business Decision Making course at Holmes Institute. The assignment focuses on applying statistical techniques to analyze business data. The solution includes the calculation and interpretation of the coefficient of determination (R2), assessing the model's explanatory power. It tests the significance of the relationship between variables at a 5% significance level, evaluating the validity of the regression model. The document also determines the standard error of the estimate and comments on the fitness of the linear regression model, providing insights into the accuracy and reliability of the statistical analysis. The assignment demonstrates an understanding of key statistical concepts and their application in a business context, using provided data to draw meaningful conclusions. The solution includes regression statistics, ANOVA, and coefficients with standard errors and p-values.
Document Page
STATISTICS AND RESEARCH METHODS
1
STATISTICS AND RESEARCH METHODS FOR BUSINESS DECISION MAKING
Name of Student:
Name of Institution:
Date:
tabler-icon-diamond-filled.svg

Paraphrase This Document

Need a fresh take? Get an instant paraphrase of this document with our AI Paraphraser
Document Page
STATISTICS AND RESEARCH METHODS
2
f. Determine the coefficient of determination R2 and interpret it.
Response:
The coefficient of R2 is 0.001512 (or 0.15%). The coefficient implies that the regression model
explains only 0.15% of the total population. Since the value of R2 is less than 0.7(or 7%), the
model is not suitable for making inferences about the entire population. Thus, it is not
statistically accurate to make conclusions about inflation index based on all-ordinaries index
(Williamson & Kirsty, 2018).
SUMMARY OUTPUT
Regression Statistics
Multiple R 0.038875116
R Square 0.001511275
Adjusted R Square -0.051040764
Standard Error 1.223348662
Observations 21
g. Test the significance of the relationship at the 5% significance level.
Response:
The significance value is 0.867132. The significance value is more than the level of significance
(0.05). Therefore, it is statistically accurate to conclude that the regression model is insignificant
at 5% level of significance (Williamson & Kirsty, 2018).
ANOVA
df SS MS F Significance
F
Regression 1 0.043038 0.043038 0.028758 0.867132
Residual 19 28.43506 1.496582
Total 20 28.4781
Document Page
STATISTICS AND RESEARCH METHODS
3
h. What is the value of the standard error of the estimate (se). Then, comment on the fitness of
the linear regression model?
Response:
The standard error of the estimate is 0.000221. The standard error measures the statistical
accuracy. The standard error equals the standard deviation. The small standard error implies that
most of the observations are close to the sample mean (Williamson & Kirsty, 2018). Therefore, it
is evidenced that the model is fit since it has a smaller standard error.
Coeffici
ents
Standard
Error
t Stat P-
value
Lower
95%
Upper
95%
Lower
95.0%
Upper
95.0%
Intercept 2.54114
9805
0.920138 2.761
705
0.012
416
0.6152
79
4.4670
21
0.61527
9
4.46702
1
All-
Ordinaries
index
3.74934
E-05
0.000221 0.169
581
0.867
132
-
0.0004
3
0.0005 -
0.00043
0.0005
Document Page
STATISTICS AND RESEARCH METHODS
4
References
Williamson & Kirsty, 2018. Qualitative Data Analysis. Journal of Research MEthods, 10(01),
pp. 19-23.
chevron_up_icon
1 out of 4
circle_padding
hide_on_mobile
zoom_out_icon
[object Object]