HI6007 Statistics Assignment: Analysis and Interpretation

Verified

Added on  2022/11/23

|9
|577
|377
Homework Assignment
AI Summary
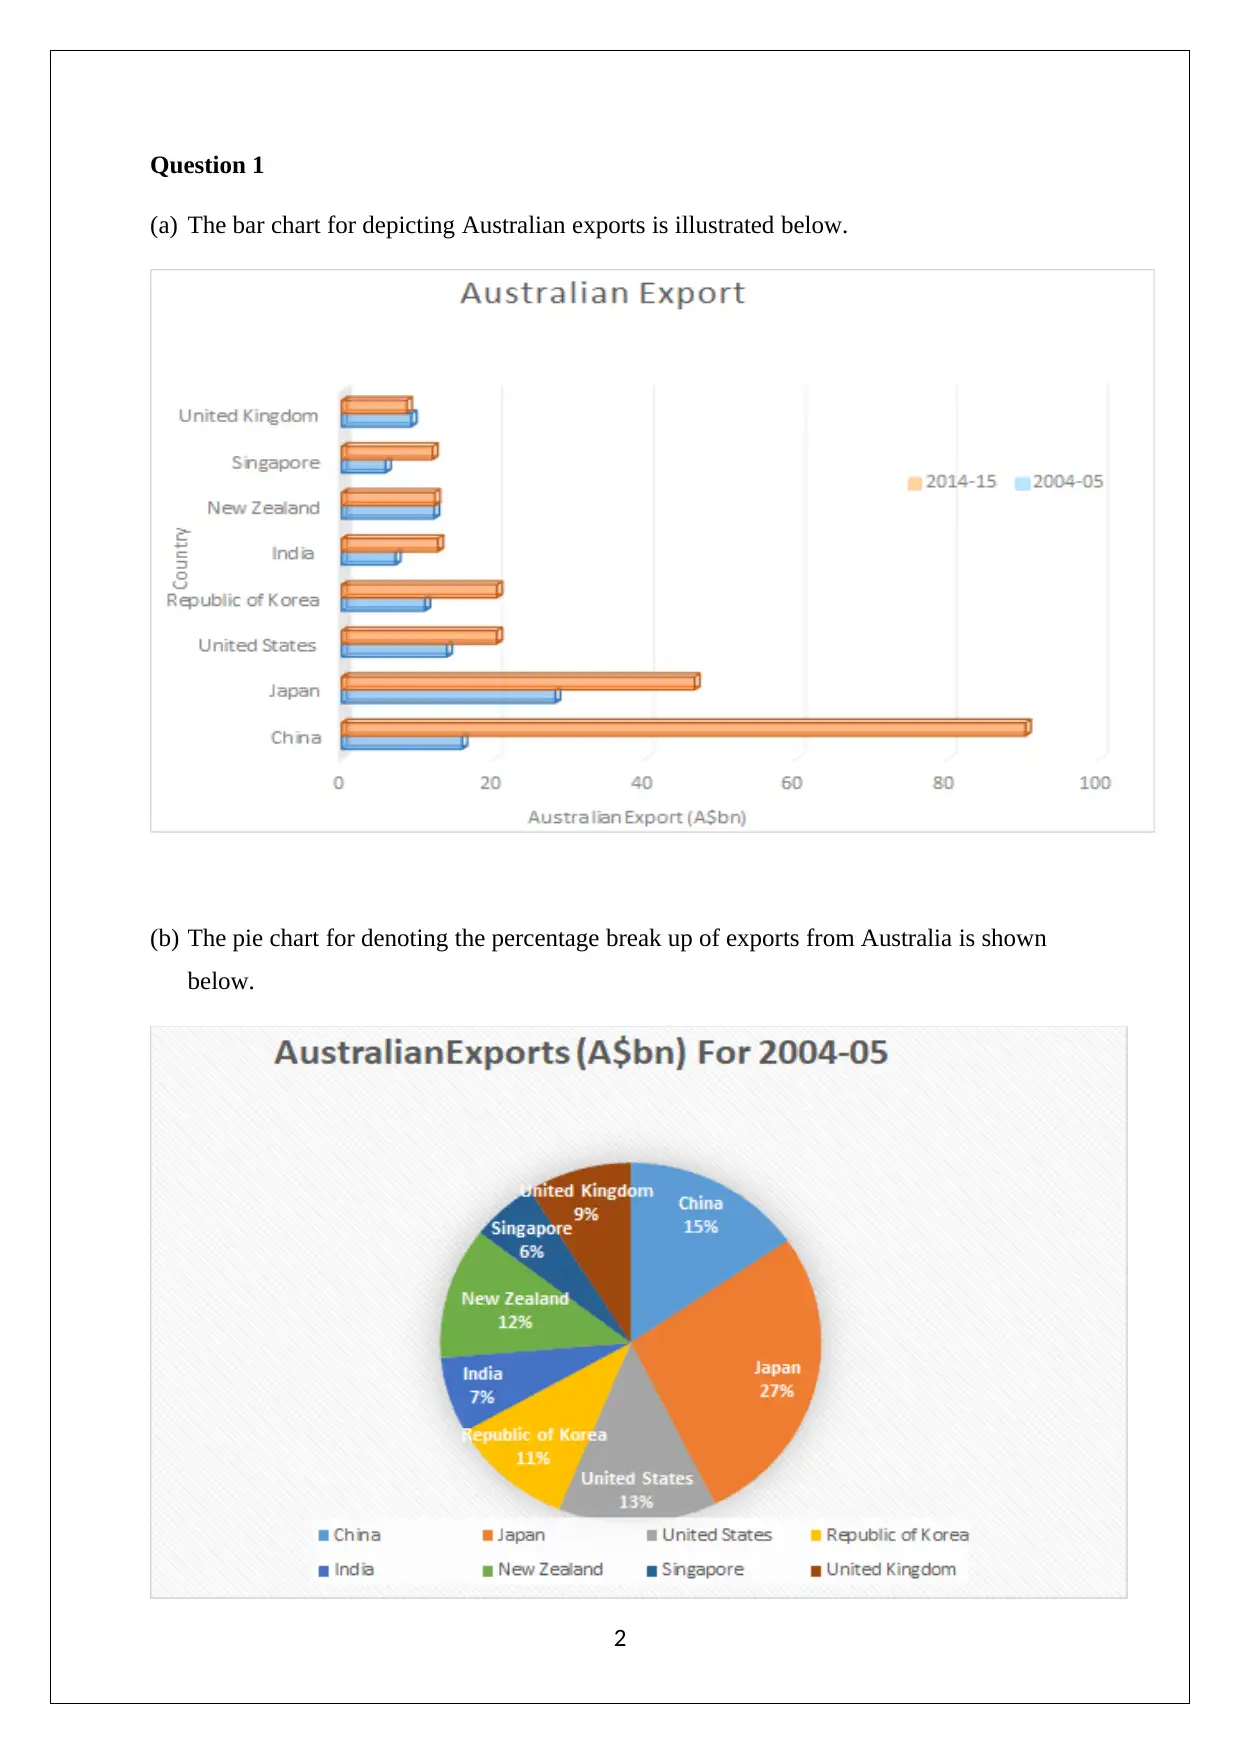
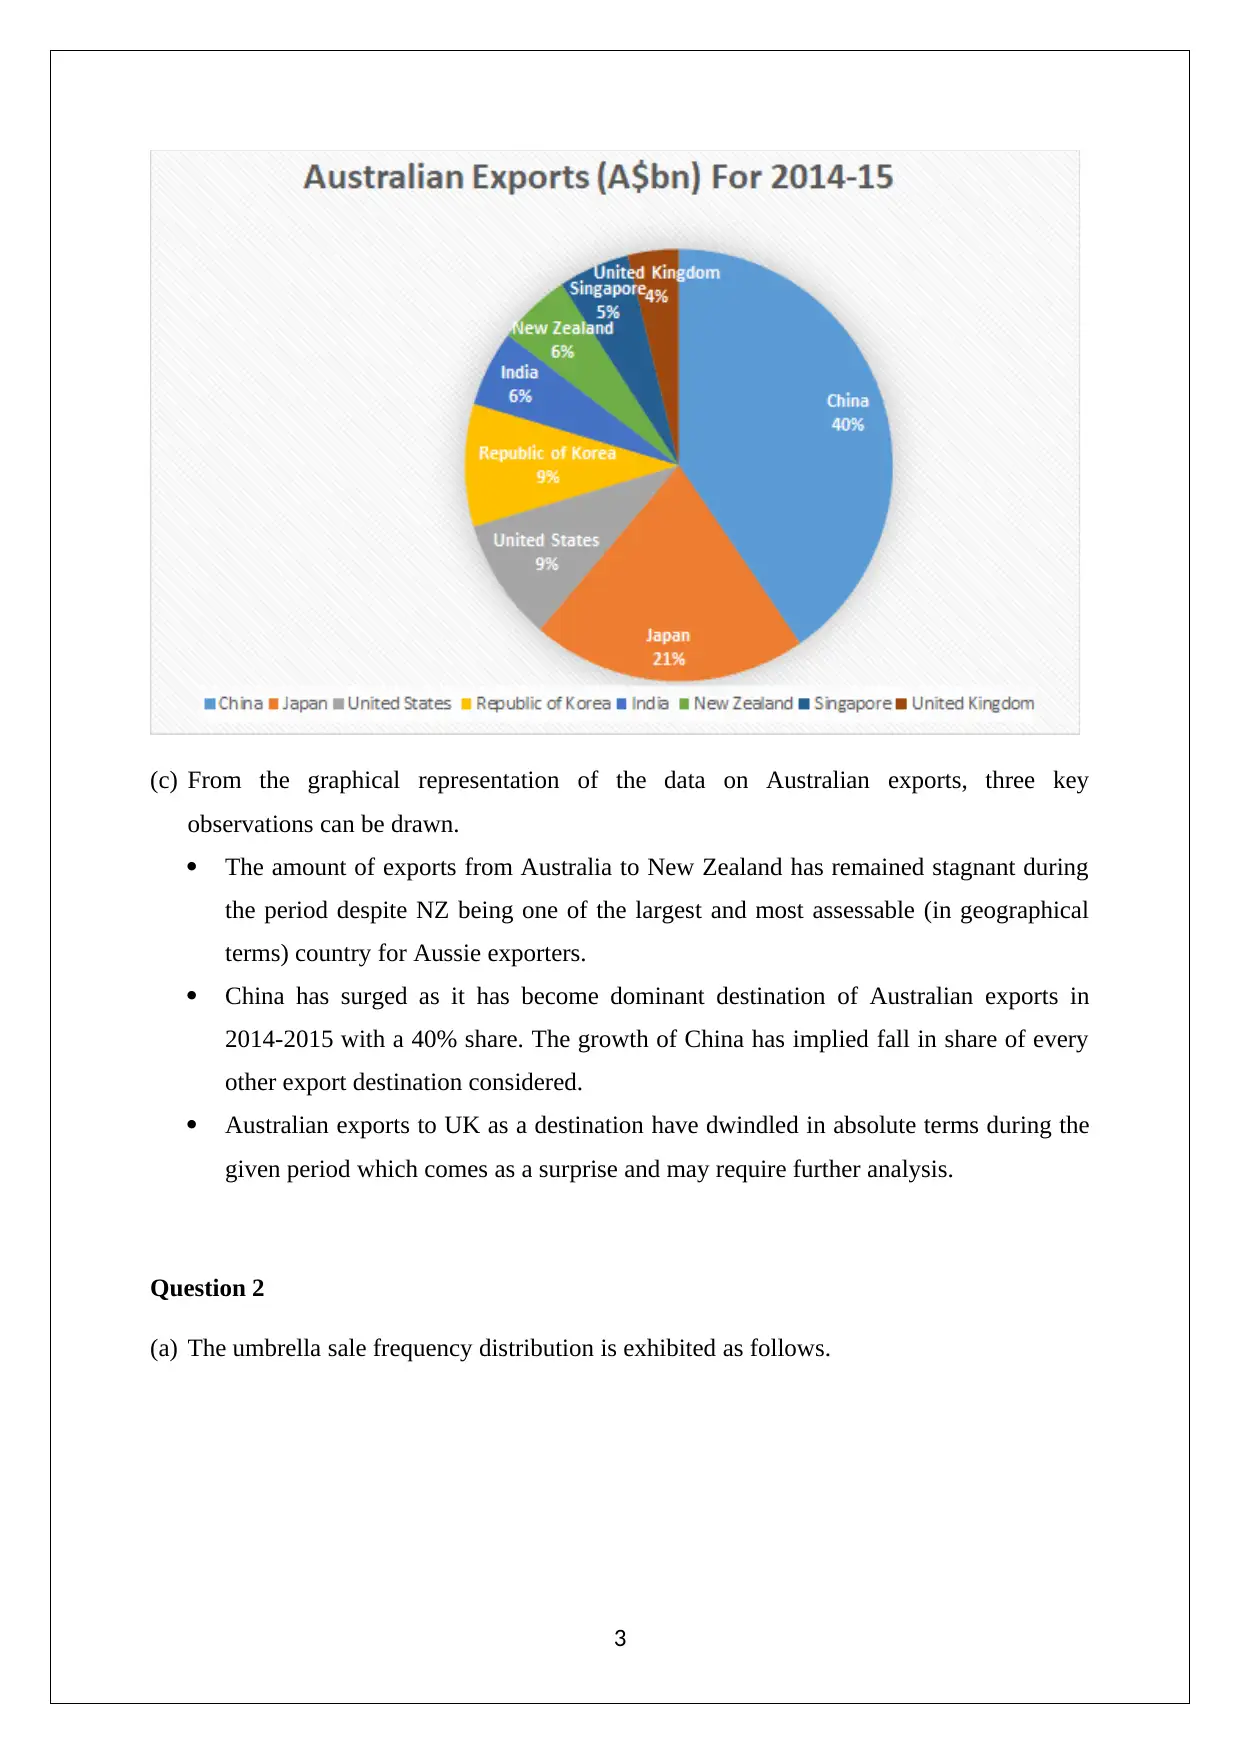
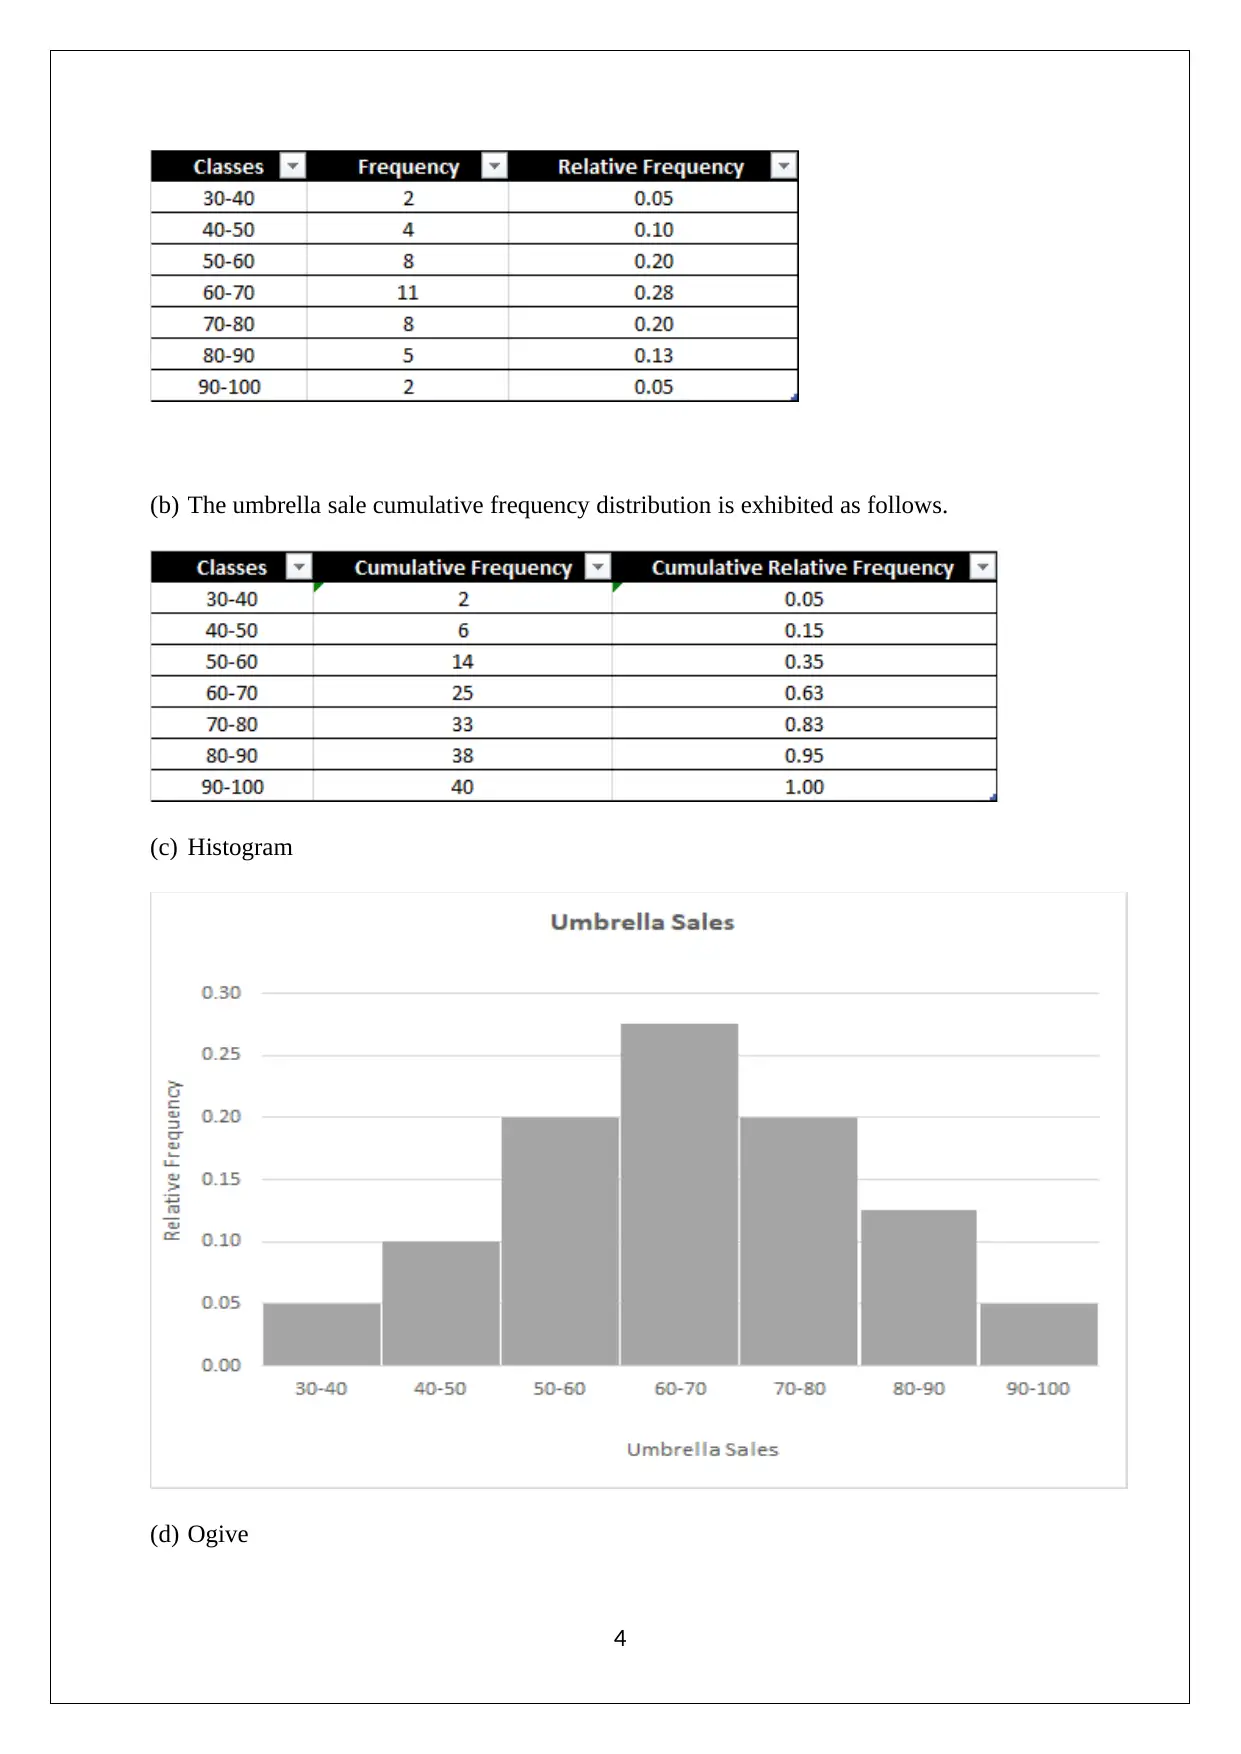
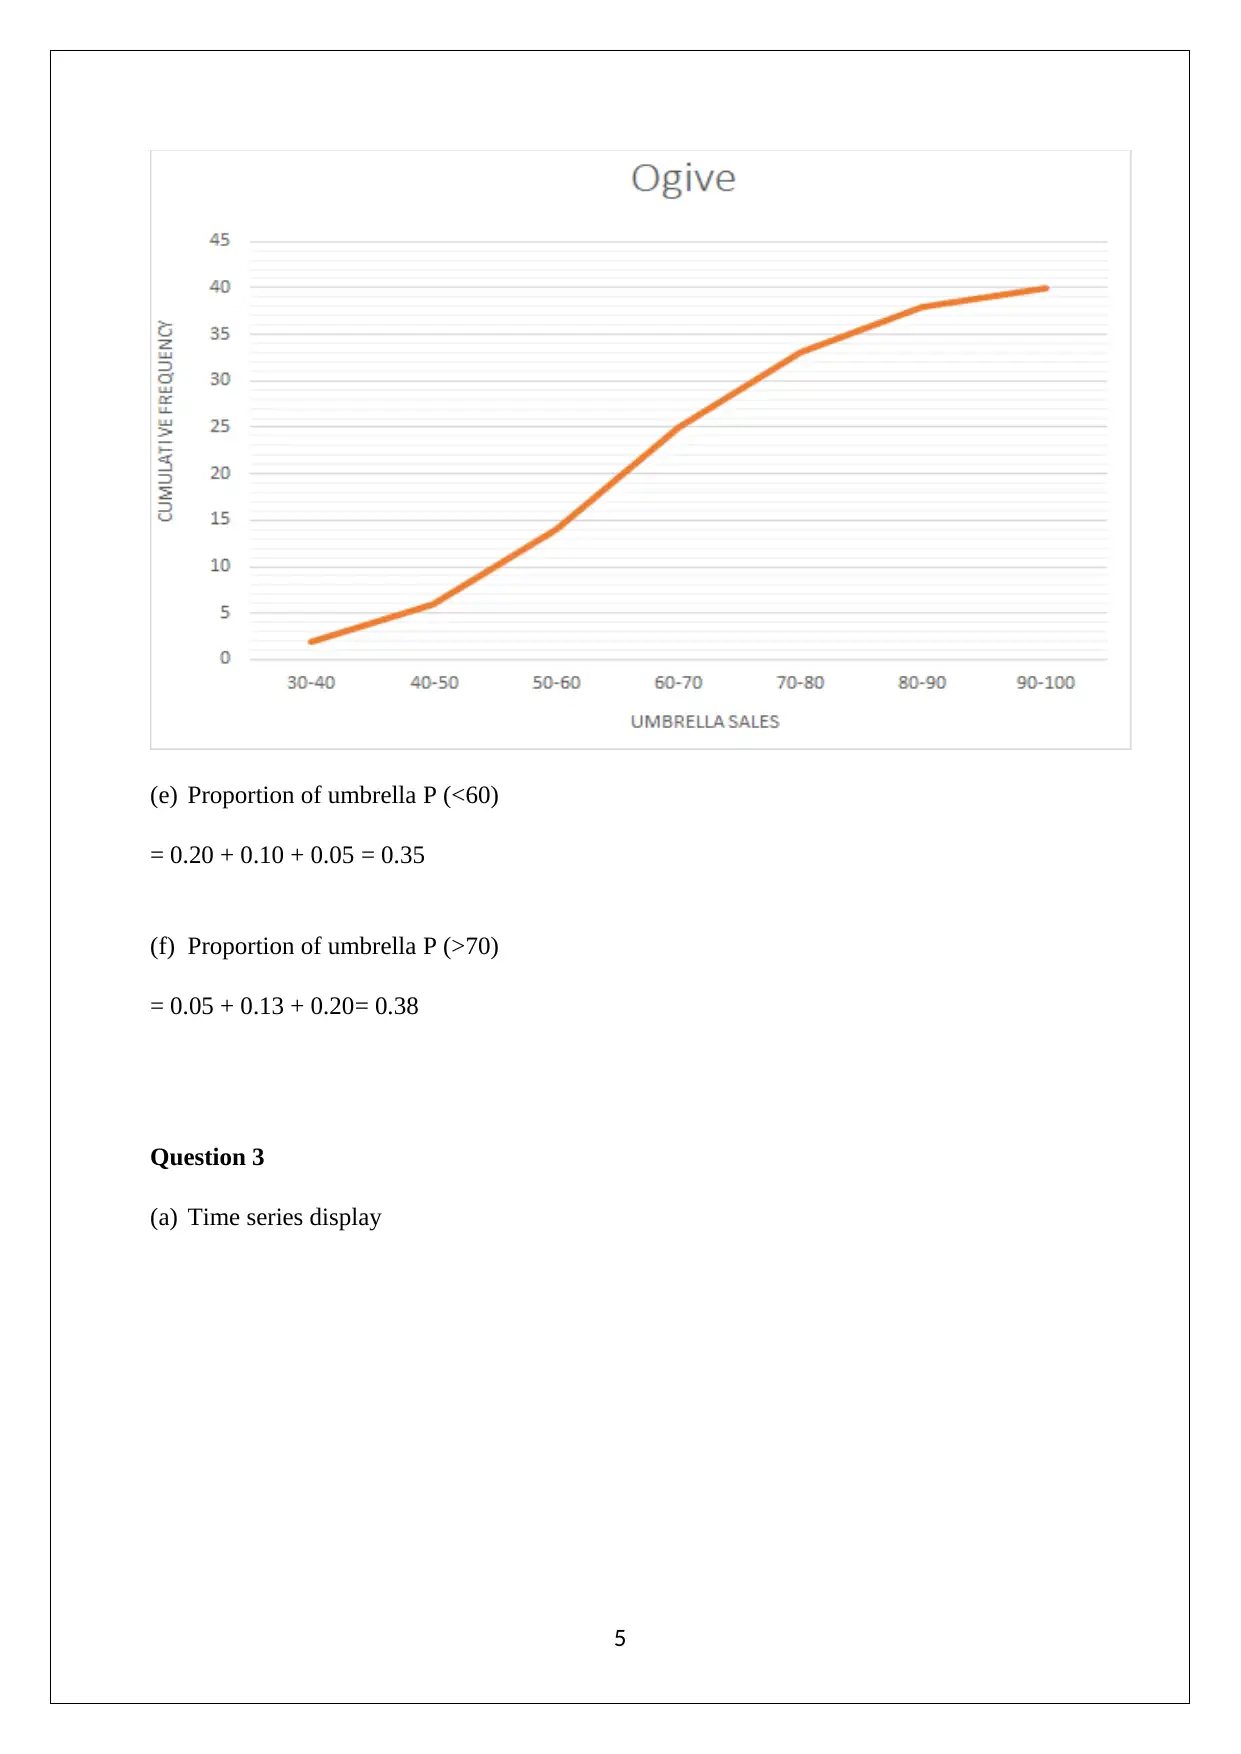
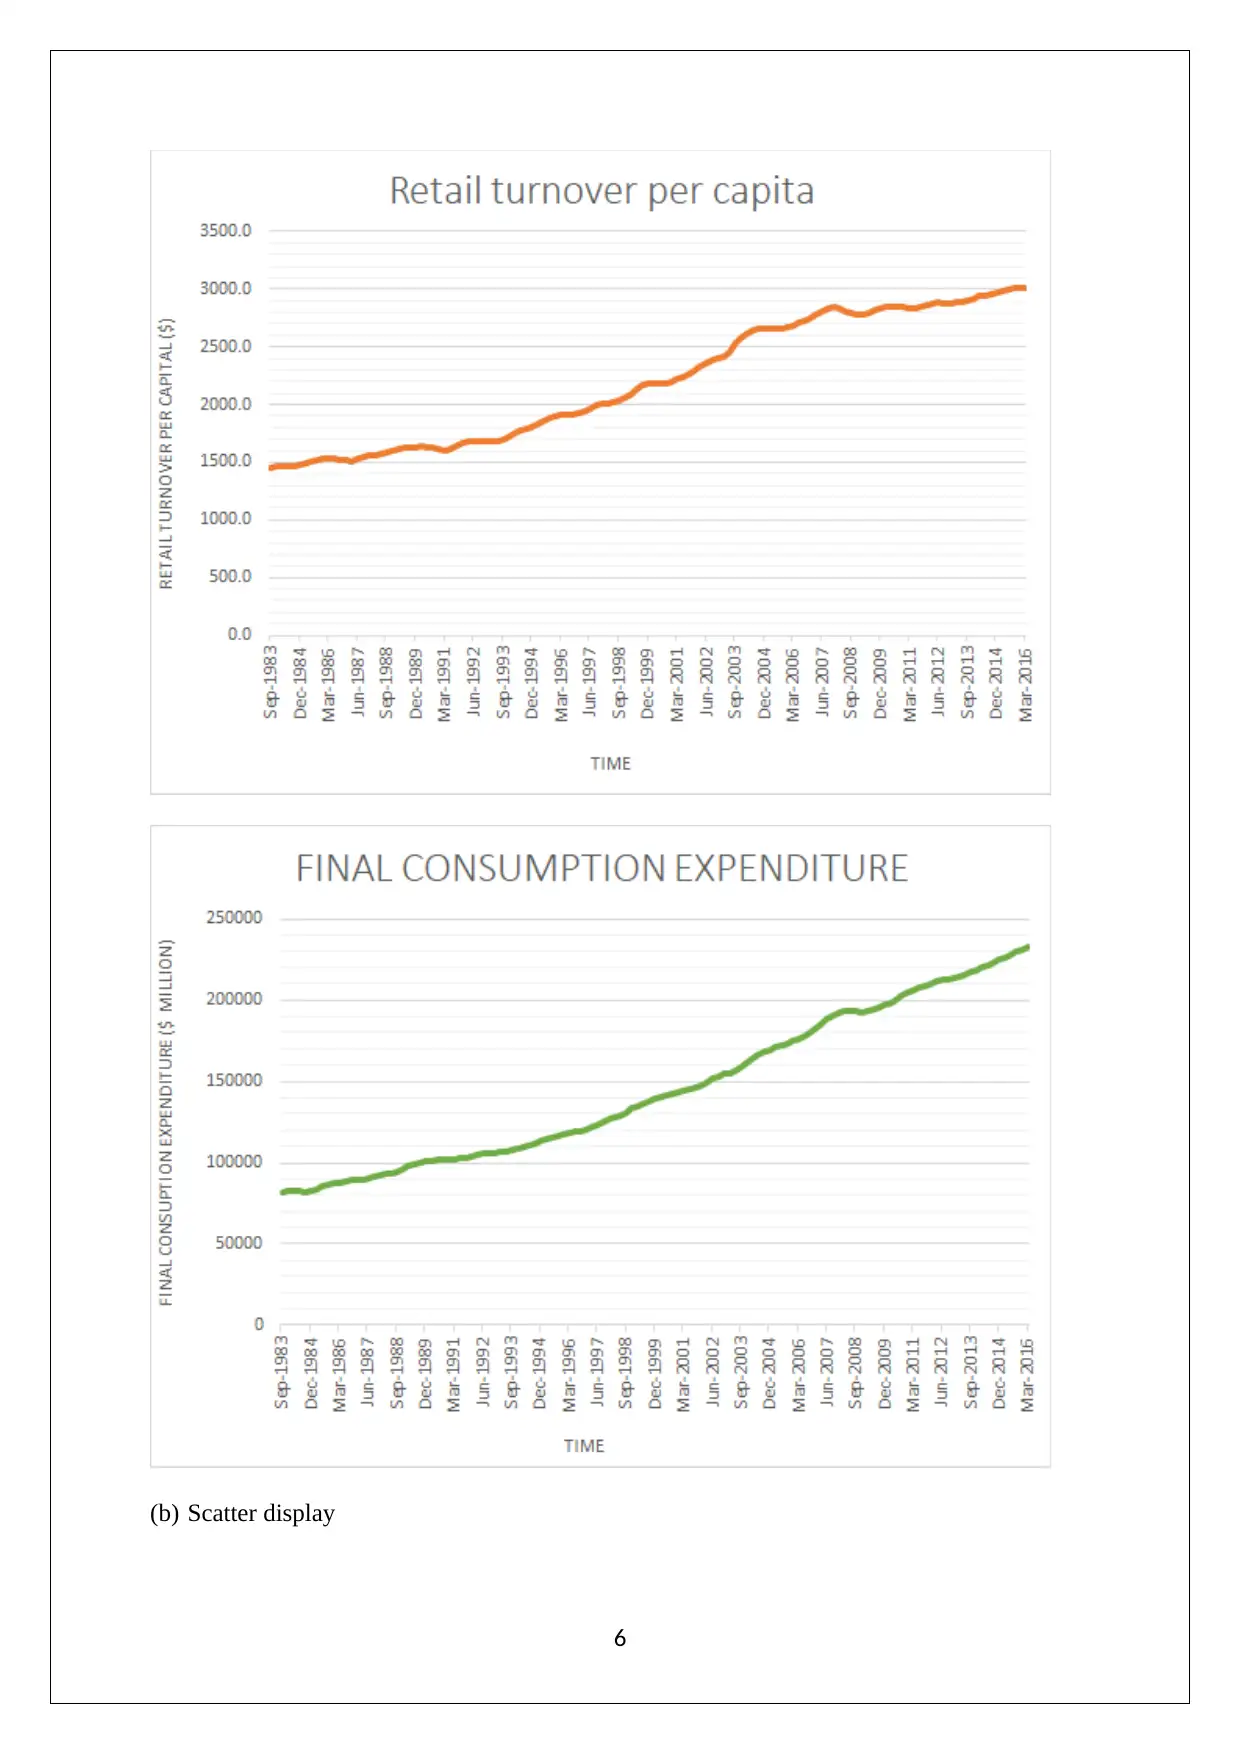
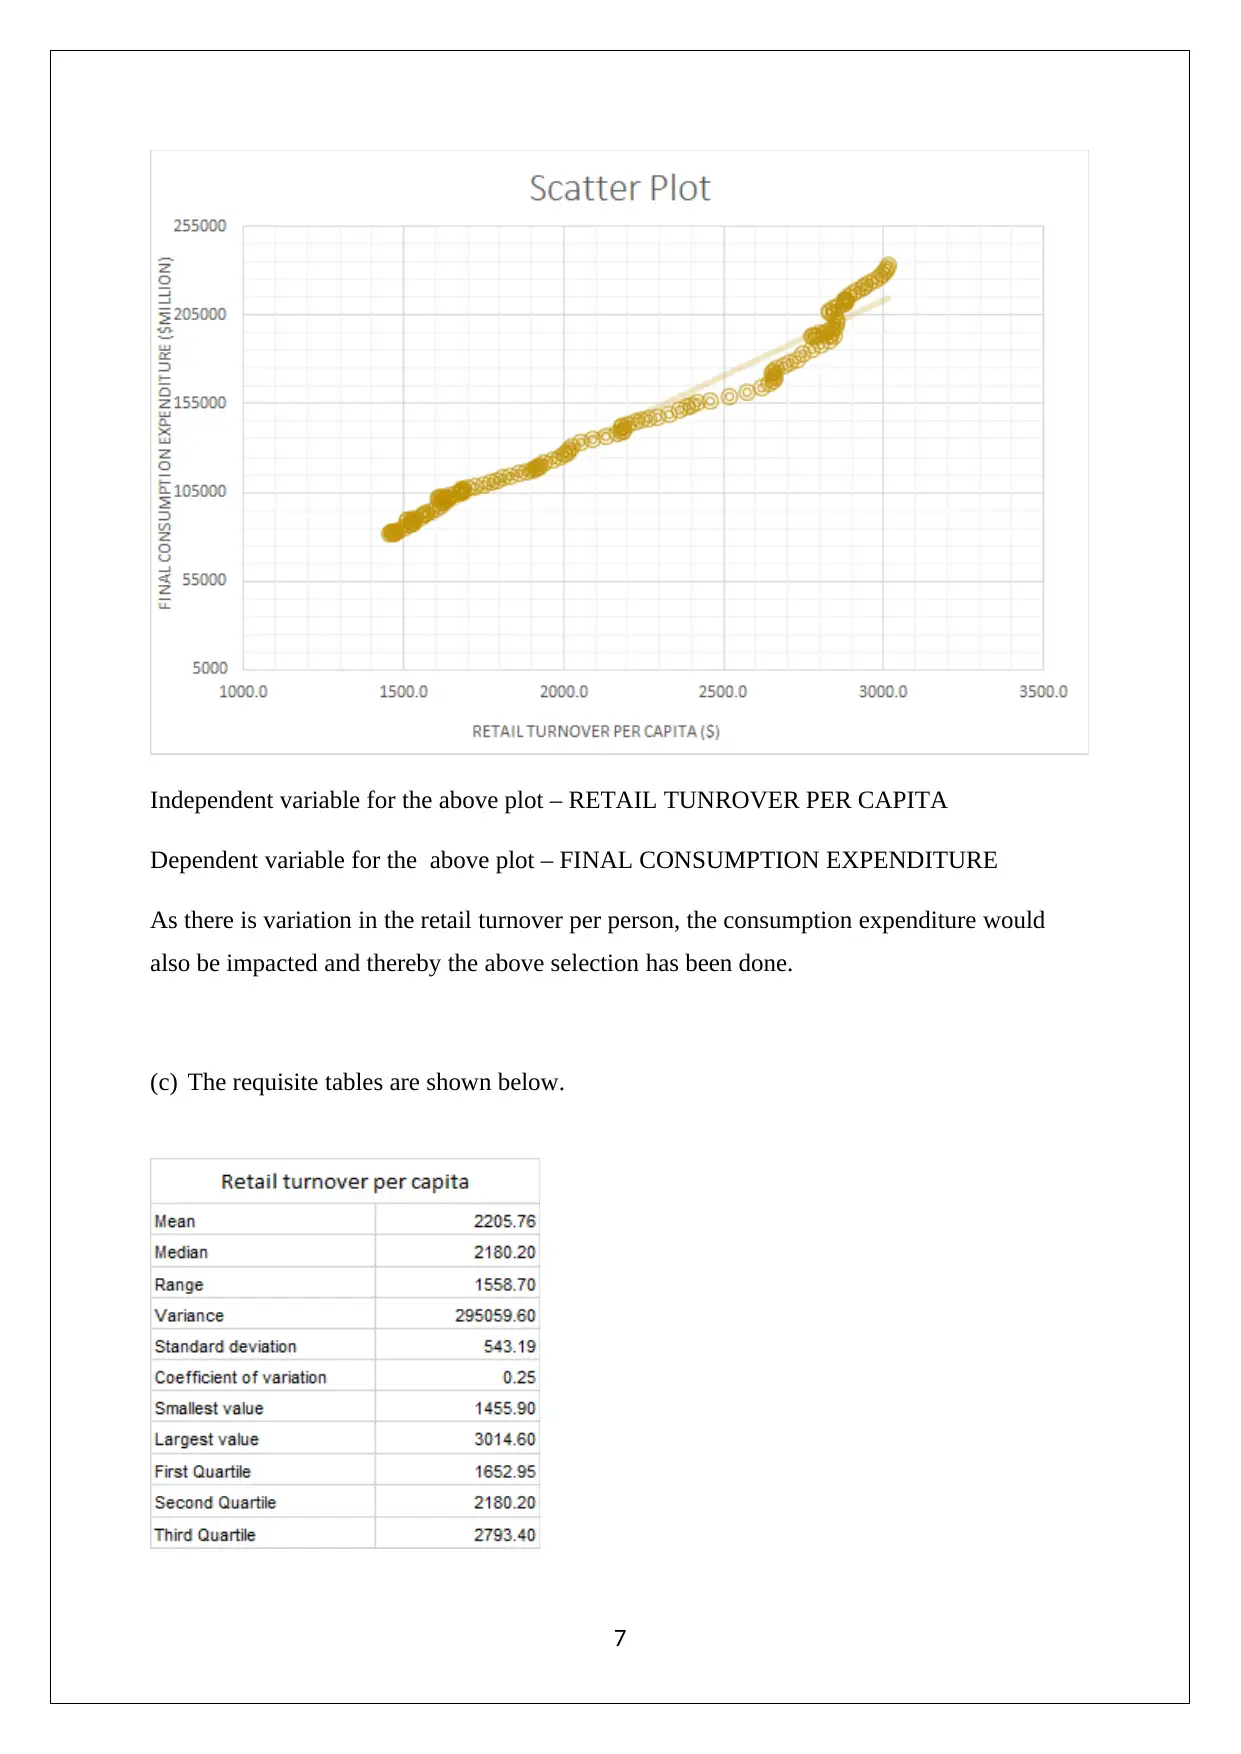
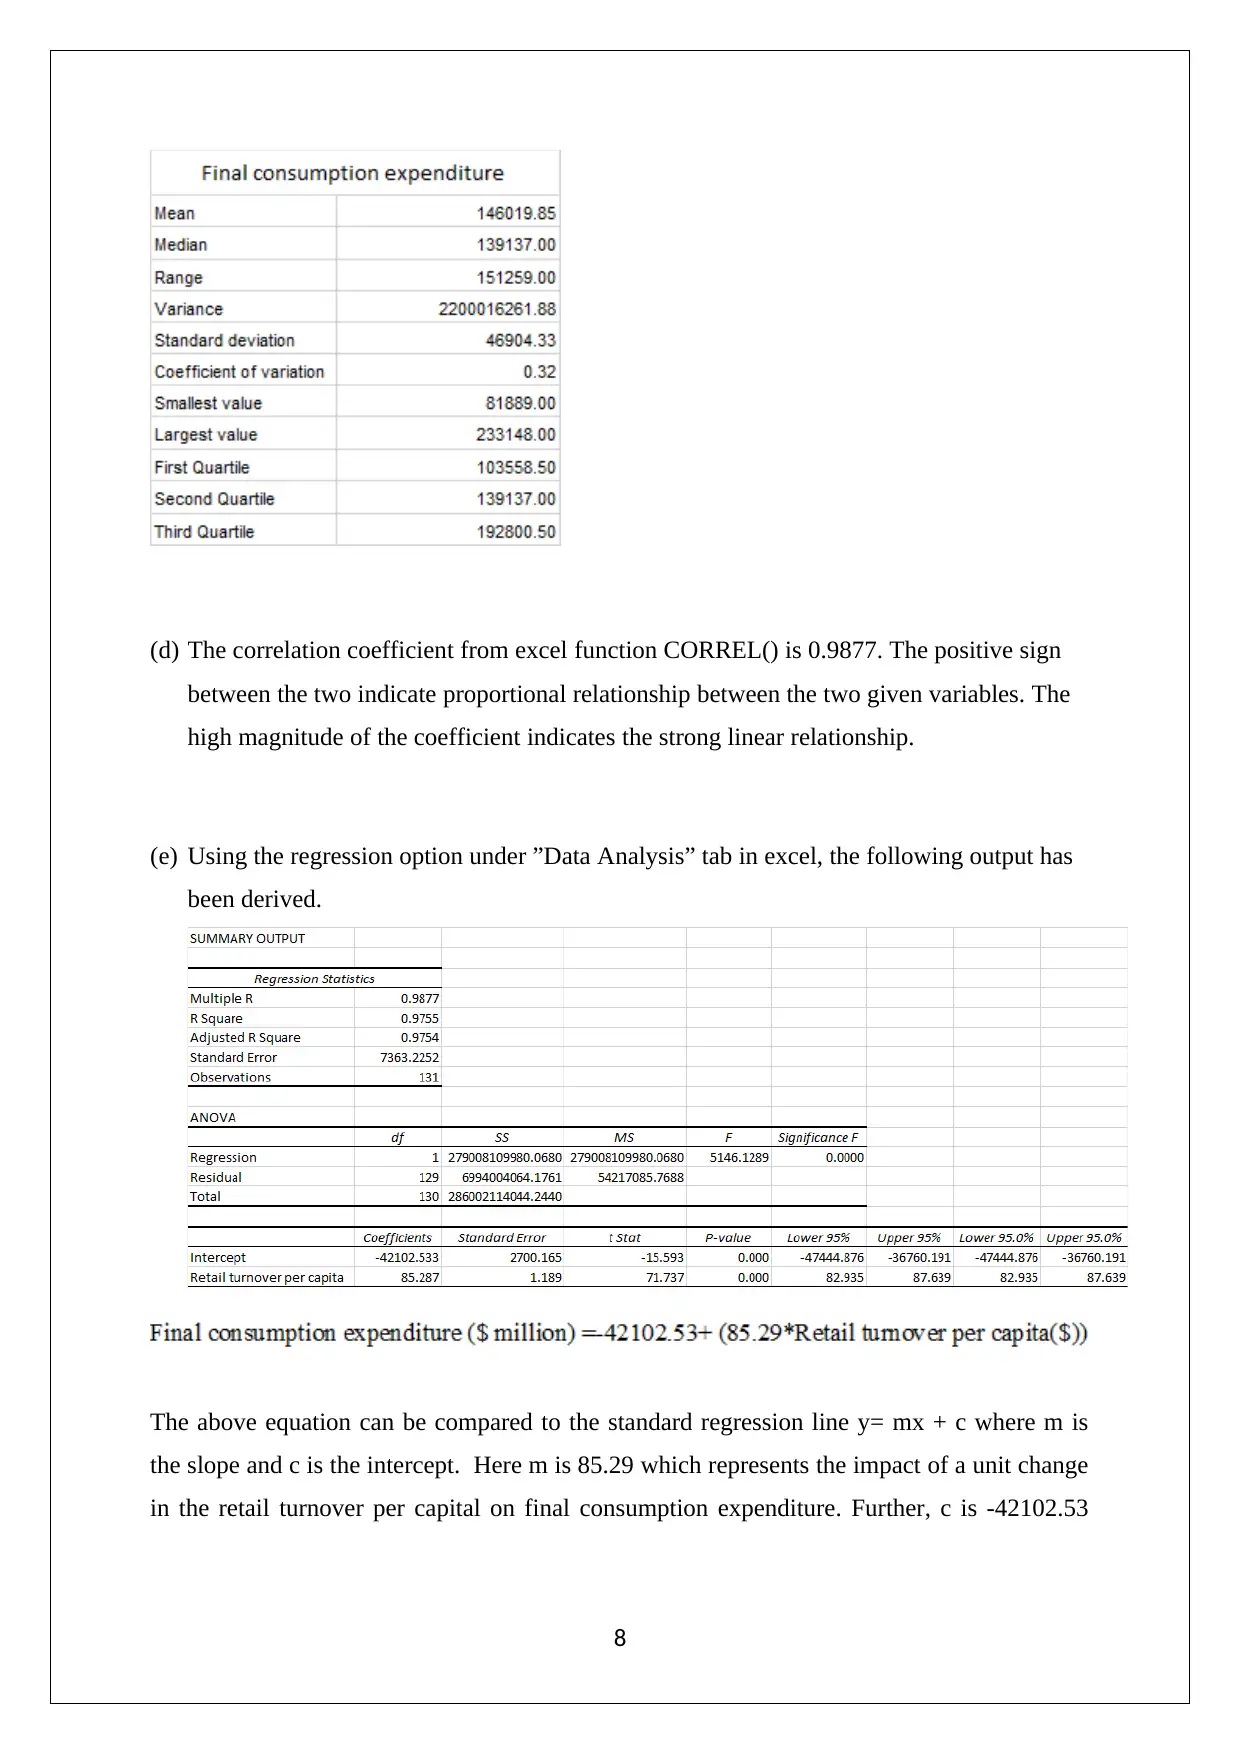
This statistics assignment provides a comprehensive analysis of Australian export data, umbrella sales, and retail turnover per capita. It includes bar charts and pie charts to visualize export trends, highlighting the surge of China as a dominant destination and the stagnation of exports to New Zealand. The assignment further explores the relationship between umbrella sales and cumulative frequency, including the creation of histograms and ogives. Finally, it delves into time series analysis, examining the correlation and regression between retail turnover per capita and final consumption expenditure, with detailed calculations of the correlation coefficient, regression equation, coefficient of determination, and hypothesis testing to determine the significance of the relationship between the two variables. The analysis is supported by data tables and Excel outputs, providing insights into the predictive power of the model and the significance of the slope coefficient.
tabler-icon-diamond-filled.svg

Contribute Materials

Your contribution can guide someone’s learning journey. Share your documents today.
Document Page
STATISTICS
STUDENT ID:
[Pick the date]
tabler-icon-diamond-filled.svg

Secure Best Marks with AI Grader

Need help grading? Try our AI Grader for instant feedback on your assignments.
Document Page
Question 1
(a) The bar chart for depicting Australian exports is illustrated below.
(b) The pie chart for denoting the percentage break up of exports from Australia is shown
below.
2
Document Page
(c) From the graphical representation of the data on Australian exports, three key
observations can be drawn.
The amount of exports from Australia to New Zealand has remained stagnant during
the period despite NZ being one of the largest and most assessable (in geographical
terms) country for Aussie exporters.
China has surged as it has become dominant destination of Australian exports in
2014-2015 with a 40% share. The growth of China has implied fall in share of every
other export destination considered.
Australian exports to UK as a destination have dwindled in absolute terms during the
given period which comes as a surprise and may require further analysis.
Question 2
(a) The umbrella sale frequency distribution is exhibited as follows.
3
Document Page
(b) The umbrella sale cumulative frequency distribution is exhibited as follows.
(c) Histogram
(d) Ogive
4
tabler-icon-diamond-filled.svg

Secure Best Marks with AI Grader

Need help grading? Try our AI Grader for instant feedback on your assignments.
Document Page
(e) Proportion of umbrella P (<60)
= 0.20 + 0.10 + 0.05 = 0.35
(f) Proportion of umbrella P (>70)
= 0.05 + 0.13 + 0.20= 0.38
Question 3
(a) Time series display
5
Document Page
(b) Scatter display
6
Document Page
Independent variable for the above plot – RETAIL TUNROVER PER CAPITA
Dependent variable for the above plot – FINAL CONSUMPTION EXPENDITURE
As there is variation in the retail turnover per person, the consumption expenditure would
also be impacted and thereby the above selection has been done.
(c) The requisite tables are shown below.
7
tabler-icon-diamond-filled.svg

Paraphrase This Document

Need a fresh take? Get an instant paraphrase of this document with our AI Paraphraser
Document Page
(d) The correlation coefficient from excel function CORREL() is 0.9877. The positive sign
between the two indicate proportional relationship between the two given variables. The
high magnitude of the coefficient indicates the strong linear relationship.
(e) Using the regression option under ”Data Analysis” tab in excel, the following output has
been derived.
The above equation can be compared to the standard regression line y= mx + c where m is
the slope and c is the intercept. Here m is 85.29 which represents the impact of a unit change
in the retail turnover per capital on final consumption expenditure. Further, c is -42102.53
8
Document Page
which would indicate the final consumption expenditure expected when the retail turnover is
nil and is more of a theoretical concept with limited usage practically.
(f) Coefficient of determination (Also known as R2) = 0.9755
Interpretation: This value is quite high which implies high predictive power of the model.
The independent variable would account for approximately 98% of the dependent variable
changes.
(g) The relevant hypotheses for this testing are indicated as follows.
H0: β = 0
Ha: β 0
The relevant test statistics along with p value are obtained from the regression output and
summarised as follows.
A key observation is that p values does not exceed alpha. Hence reject H0 which would imply
that H1 is accepted. This leads to the logical conclusion that the significance of slope
coefficient and linear relationship is established at 5% significance level.
(h) The excel regression output indicates the standard error value as 7,363.23. This is on the
lower end for the given model which is an indicator for a superior fit. The fit of the model
refers to the deviation between the predicted values and actual values. For good fir
models, the standard error value would be low.
9
chevron_up_icon
1 out of 9
circle_padding
hide_on_mobile
zoom_out_icon
logo.png

Your All-in-One AI-Powered Toolkit for Academic Success.

Available 24*7 on WhatsApp / Email

[object Object]